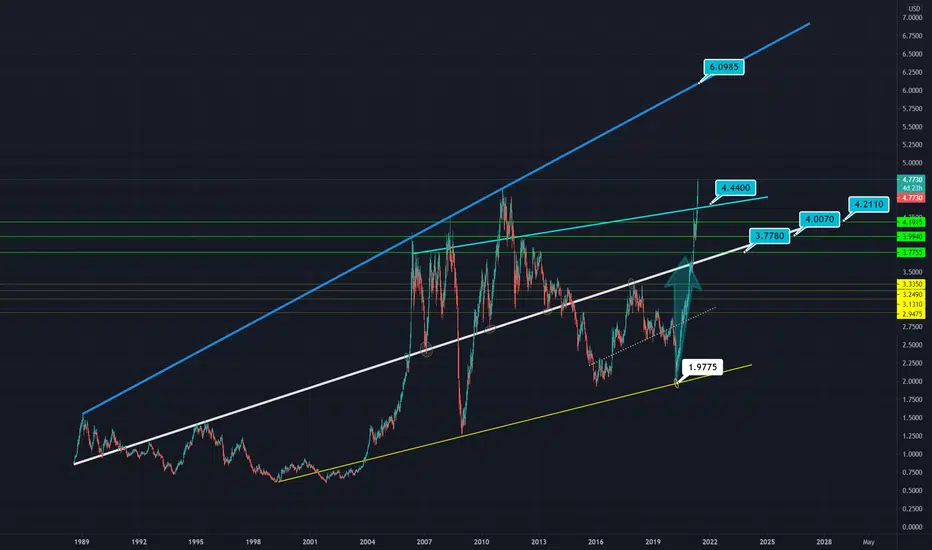
COPPEROpportunity to watch in Copper.
Possible impulse for Long.
Price is a bit below it ATH, but, before dump, it must clear the path.
Let me know what do you think. And thumb up if you find this is good content.
Peace and Joy!
Crypto SolArb
Copper

Pray for Uncle Jones - 6 Month Copper ChartInflation along with supply shortages will send copper to the moon

Sentiment Sunday - GoldSentiment Sunday:
- Eyes are on gold this week, gold bugs are buzzing about a possible explosive breakout.
- Rising material costs signaling consumer inflation, yet Fed's monetary inflation model has not indicated inflation yet.
- Mixed sentiment, as Fed is likely to maintain dovish monetary policies.
- Energy, Industrials, and Industrial/Capital Goods-related materials showing strength, supporting a 'Reflation' macro quadrant situation.
- Poor employment data signaling a possible move toward stagflation. I speculate that the economic data from now will begin to reflect the effects of the pandemic.
- Lumber, copper, cryptocurrencies seeing massive gains, speculators expecting the precious metals to finally trail.
- Elon Musk stated that DOGE was a 'hustle' in his anticipated Saturday Night Live hosting, causing a correction in the cryptocurrency market. Investors are likely exiting and preparing to move into lagging inflationary assets.
- Trend is still not defined, but the bullish case for gold is rather strong.
GLHF,
DPT
Disclaimer:
We absolutely do not provide financial advice in any shape or form. We do not recommend investing based on our opinions and strongly cautions that securities trading and investment involves high risk and that you can lose a lot of money. Loss of principal is possible. We do not recommend risking money you cannot afford to lose. We do not guarantee future performance nor accuracy in historical analyses. We are not registered investment advisors. Our ideas, opinions and statements are not a substitute for professional investment advice. We provide ideas containing impersonal market observations and our opinions. Our speculations may be used in preparation to form your own ideas.

COPPER (XCU/USD) – Week 20 – New top expected.As we mentioned in our previous analysis, Copper pulled-back and it looks like the price is starting to lose momentum, after reaching our trendline.
In this context, in the coming week expect this pair to make a new top.
Trade with care.
Best regards,
Financial Flagship
Disclaimer: The analysis provided is purely informative and it should not be used as financial advice. Remember that you need a plan before you start trading; so, take this knowledge and use it as a guidebook that will ultimately help you understand the market and easily predict your next move.
📢Check out our:
📹YouTube: www.youtube.com
🌍Website: www.finflagship.com

copper trand 15 minit candal chart copper is up trade progress long time this year copper 36% gain this rang very somuth for sell but without stoploss no trade my prediction in the chart


Copper close to complete the measured move!Copper has a healthy stair-step trend, with mid-term consolidations after big rally's, as drawn in chart.
We are about to make the measured move which I projected in my last chart on this ETF, at this point I expect we could enter a period of consolidation.
Risk Management
I will tight my exits to the 5-day moving average once we complete the measured move. That way I can still be in it if it continues to rally, but will secure my gains which I set in my initial plan.
To see the initial plan and breakout setup, click on related ideas "Copper breaking out"

COPPER (XCU/USD) – Week 19 – Strong bulls.In our previous analysis, Copper continued, as expected, its strong bullish momentum.
In this context, we anticipate a pullback to occur in the following days, towards the support area before continuing the big Monthly uptrend.
Trade with care.
Best regards,
Financial Flagship
Disclaimer: The analysis provided is purely informative and it should not be used as financial advice. Remember that you need a plan before you start trading; so, take this knowledge and use it as a guidebook that will ultimately help you understand the market and easily predict your next move.


Traditional market analysis 12/05/2020 #1Going through several FX pairs, the importance of the USD, all the important commodities (Gold, Copper, Oil) and finally some indices like the Nasdaq 100, S&P 500, Nikkei etc.

#COPPER mcx -12TH MAY 2021- HOURLY TRADE#COPPER mcx -12TH MAY 2021- HOURLY TRADE- COPPER IS TRADING ABOVE THE WEEKLY SUPPORT AND TREND LINE SO WE WILL BE LOOKING FOR THE BUY OPPORTUNITIES NEAR 794 AND SL WOULD BE AT 787 AND TARGET 822 , TRAIL SL, TRADE CAUTIOUSLY.

Copper prices are facing bullish pressure, potential upside Copper prices are testing our first support in line with our 23.6% fibonacci retracement, 61.8% fibonacci extension and ascending trend line where we could see a further upside above this level. EMA and Ichimoku cloud are showing signs of bullish pressure as well, in line with our bullish bias. A break above our upside confirmation level in line with our horizontal swing high resistance could provide the bullish acceleration to our first resistance target.

Jubilee Metals Group Jubilee broke a strong resistance at R3.50, shooting up 18% to hit R4.15.
I expect a pullback as it reaches the upper end of the trend line, before moving higher again.
I'll use this upcoming pullback to add to my position.

Copper Mcx Daily AnalysisPls look at charts
Target given both sides.
This is for education purpose only.

Copper prices are testing support, potential bounce Copper prices are testing our first support in line with our 23.6% fibonacci retracement, 61.8% fibonacci extension and ascending trend line where we could see a further upside above this level. EMA and Ichimoku cloud are showing signs of bullish pressure as well, in line with our bullish bias.


The Inflation has LandedThe media has recognized and confirmed what we have been warning about for some time, that inflation was on the way. Well it is finally here.
‘The accommodative/bailout policies of Greenspan and his protégé Bernanke as figureheads of federal intervention and involvement into financial and monetary affairs and their ability to arbitrarily yield federal power have done nothing more than turn market participants into Pavlov’s dogs. The money they have materialized and forced fed into the global financial system without any commensurate increase in production in their economies is money in search of mischief and is very likely to find it…in the form of very serious inflation.’ theimpartiallens.com March 2015 & 2020
‘The powers that be have had to intervene in every crisis we’ve had since the 1980s. and since The Great Financial Crisis of 2007, we now realize that we can never ever stop printing money. It is inflate or die’. theimpartiallens.com February 2021
Cost-Push Inflation
The only people who can’t see the inflation are the authorities who are printing the money. They use the corrupt and decades old revision of the CPI. Meanwhile inflation is rampant in the real world. We mentioned in the following piece theimpartiallens.com that inflation manifests itself in different ways. It can go into stocks, bonds, foreign countries, oil, crypto, your health costs, your housing costs, educational costs, etc. The powers that be can live in denial and it’s not a river in Egypt. But the inflation we warned about that is now taking shape, the one they fear, the one that will bring about the revolutions, is cost-push inflation, especially food price inflation. They will try to disguise it for a while longer with shrinkflation, but when the masses realize that they are spending the same, but their kids are still hungry…watch out!
One of our favorite investment themes ie. 'Real Assets' has finally caught a bid since the summer of 2020 as we can see from the performance of the following ETF’s:
Agriculture (DBA) +45%
Commodities (DBC) +72%<
Base Metals (DBB) +69%
Agri-Business (MOO) 75%
Uranium (URA) 112%
WTI Crude Oil (DBO) 111%
Water (FIW) 64%
Palladium (PALL) 61%
Brent Crude Oil (BNO) 117%
Rare Earths (REMX) +172%
Copper Miners (COPX) 300%
Lithium (LIT) 148%
Cannabis (YOLO) 150%
Time to Rebalance Portfolios?
No harm in taking SOME crypto gains and buying some real stuff! Gold, Silver & the mining companies look interesting here. We went long the following six ETF’s in March/April 2020 in anticipation of upcoming inflation: GDX (Gold & Silver Miners), GDXJ (Junior Gold & Silver Miners), WPM (Gold, Silver, Palladium, Cobalt), WTR (Water), GLD (Gold), COW (LIvestock).
‘Nobody ever lost money taking a profit.’ Bernard Baruch
“Art is making something out of nothing, and selling it.”
― Frank Zappa
theimpartiallens.com

Copper prices are facing bullish pressure Copper prices are facing bullish pressure from our first support in line with our 23.6% fibonacci retracement, 61.8% fibonacci extension and ascending trend line where we could see a further upside above this level. EMA and Ichimoku cloud are showing signs of bullish pressure as well, in line with our bullish bias.

COPPER- Can it go to 6??Copper is flying high and the question is where to?
We have reached all 4 take profit targets , relatively faster than expected.
Does Copper price have potential to go to 5 or even 6? I guess we will find out soon.
the FXPROFESSOR
COPPER (XCU/USD) – Week 18 – Strong bulls.In our previous analysis, Copper broke the top, despite our initial expectations regarding a possible price decrease.
Having said that, in the following days, we anticipate a pullback towards the support area before resuming its uptrend.
Trade with care.
Best regards,
Financial Flagship
Disclaimer: The analysis provided is purely informative and it should not be used as financial advice. Remember that you need a plan before you start trading; so, take this knowledge and use it as a guidebook that will ultimately help you understand the market and easily predict your next move.

Copper is facing bullish pressure, potential upside Copper prices are facing bullish pressure from our first support in line with our 38.2% fibonacci retracement, 61.8% fibonacci extension and graphical pullback support, where we could see a further upside above this level. EMA and Ichimoku cloud are showing signs of bullish pressure as well, in line with our bullish bias.

Copper Miners ST Top COPX wave 5 top lies out of channel around the 25th of June.
The end of June will be in my mind, 25th-28th have recurred as dates of peak projections on so many charts of mine that I will make a trading plan around it. We could see a slow down in metals and miners late summer into the autumn. I think Q4 will probably rip into a larger crash, not so sure on the David Hunter Q3 Bust, maybe Q4.
A correction at that point may retrace a minimum of 15% to the 50D MA

TRQThis is weekly chart. Considering how well Dr. Copper ran lately and how Gold is about to break out this chart looks great. Easy $9 up potential in a short term and if we get Golden cross and Gold and Copper prices reaching new ATH previous $290 range is very realistic possibility. I would buy this one if I had any $$$ left. I am all in already. Good luck
