Dash Is Sitting At The Strong Support Within The Wedge PatternDash made a strong rally, as anticipated earlier, but the recent sharp decline suggests that the five-wave bullish impulse has likely been completed. As a result, price action now appears to be in a higher-degree three-wave corrective phase. This pullback fits well with a broader ABC corrective structure following the impulsive advance.
On the 4-hour chart, Dash seems to be trading within wave C of this higher-degree correction. Moreover, price action suggests that the market may be in the final stages of wave (5) within a wedge pattern. This setup often signals trend exhaustion, especially when combined with strong historical support. In this case, the 40 area stands out as a key support zone where buyers could step back in and stabilize the price.
Given this technical structure, traders should be alert for a potential rebound and the early stages of a new rally, particularly if price manages to recover and hold above the 53.50 level. However, it’s important to remain cautious, as the first meaningful bullish evidence would only be seen on a breakout above the 71 area. A decisive move above 105 would then serve as full bullish confirmation, signaling that a larger upside continuation is back in play.
Until those levels are reclaimed, price action should be monitored closely, as volatility may remain elevated near the current support zone.
Correction

Is AVGO’s drop over yet?Oracle AVGO — Price Analysis
Chart A (Daily):
Price had been oscillating within an 80-day channel, and after failing to reach the channel’s upper boundary due to repeated divergences, it finally broke below the bullish channel with two strong, high-volume daily candles—the highest selling volume seen on this chart in the past 68 days—and closed below the channel.
Chart B (4H):
This structure is also visible on the 4-hour chart as a wedge pattern, where price initially experienced a fake breakout to the upside and has now broken the lower boundary of the wedge.
Outlook:
This corrective move could potentially continue at least to the gap zone highlighted on the chart, which is a significant gap, and possibly extend further to the support zone at the lower end of the extended channel. Once price reaches these areas, we should watch for potential reactions.
Note: This analysis will be updated as the situation develops.
Follow me on TradingView for more analyses and live stock trades.
NASDAQ:AVGO

Google is trading in a high-risk zone.Google (Alphabet) Stock Analysis
As shown on Chart A, Google is trading within a 5-year ascending channel on the weekly timeframe and has now reached the upper boundary of the channel.
On Chart B (daily timeframe), price has broken below its rising channel and has already moved toward the mid-level of the extended channel.
Given the strong bullish momentum in the most recent move, the probability of a sharp sell-off appears limited. However, considering the bearish divergence in the last price leg, along with the presence of a large unfilled gap that price has never revisited, a corrective move can be expected.
Based on these factors, a pullback at least toward the $217 level remains a plausible scenario.
This analysis will be updated accordingly.
Follow me on TradingView for more analyses and live stock trades.
NASDAQ:GOOG

SP500 Remains Bullish After The FED MeetingS&P 500 has made a very nice retracement recently; in fact for almost the whole November we have seen a pullback of around 5 to 6%, which is quite a lot for the S&P 500, and what is really important is that the market has stopped around the 6500 area, which basically goes back to October 10th when we saw a massive sell-off on that Friday when Trump threatened with new tariffs on China. But afterwards, as you can see, the market recovered, so it looks like a very beautiful rebound from that zone with impulsive characteristics, even beyond the diagonal and trendline resistance lines. This likely confirms that bulls are ready to resume higher into a potential fifth wave, which can be made by a new lower-degree five-wave bullish cycle. Ideally, new trend will resume soon after the current setback that can be flat in wave 2, so be aware of a bullish continuation into all-time highs and 7k are, possibly still this month.
After the FED meeting last week, we can see it making an irregular flat correction in wave (2) that can find the support at 6800 area, so soon be aware of a bullish resumption within wave (3).

XAUUSD Correction toward the strong 4160–4130 zoneXAUUSD Scenarios
Current Price: 4208
Gold is in a very strong long-term uptrend (Wave 3 of the Elliott structure on the monthly and weekly charts), but is currently in the corrective phase of Wave 4 (H4 and lower time frames).
The rejection from the upper Monthly Golden Bollinger Band, combined with a Daily Doji signal and the breakdown of the H4 regression channel, suggests a deeper correction before Wave 3 resumes.
Most Likely Scenarios based on current data in Order of Probability :
1. Correction toward the strong 4160–4130 zone (70% probability)
(overlap of Monthly MSZ + Weekly Support + Daily Trendline)
→ followed by continuation of Wave 3 toward targets 4330 → 4438
2. A direct breakout of the 4245–4255 resistance zone (20% probability)
and continuation of the uptrend without a deep pullback
3. Breakdown of the 4130 support (probability less than 10%)
would activate a short-term bearish scenario toward 4050–4000

The 100K Magnet: Bitcoin Can’t Resist This Zone!!!🧲🧲Bitcoin is aggressively climbing, and the chart makes one thing very clear, the red zone above is acting like a powerful magnet pulling price toward it.
Here’s why:
1️⃣ 100k Round Number
Major round numbers always attract liquidity. Traders, algorithms, and even long-term investors pay attention to them, making 100,000 a natural magnet for price.
2️⃣ Supply Zone
This area hosted heavy selling in the past, meaning there’s unfilled liquidity sitting there. Markets tend to revisit such zones to rebalance orders.
3️⃣ Major Resistance Zone
Historically, this level acted as a ceiling multiple times. What was once previous resistance often turns into the next major test.
With all three factors stacked together, the entire zone becomes a high-gravity area, and BTC tends to get "pulled" toward such confluences.
🏹As long as BTC maintains its short-term momentum, a retest of this magnet zone becomes the most likely scenario. After that? The reaction will reveal whether the bulls can finally break through, or get rejected again.
Will Bitcoin reclaim the magnet zone this time? 🤔
⚠️ Disclaimer: This is not financial advice. Always do your own research and manage risk properly.
📚 Stick to your trading plan regarding entries, risk, and management.
Good luck! 🍀
All Strategies Are Good; If Managed Properly!
~Richard Nasr

Oklo dropped 50% is there more to come Update on the original video where we forecast a correction for Oklo in which case we got a really nice drop to the downside .
I cover what I think may be next while we are Currently sitting at the .618

Apple Stock Setup: Momentum and Patterns Point Toward New ATHA deep dive into Apple’s latest technical setup, analyzing MACD momentum, RSI strength, and emerging chart patterns that signal a potential breakout toward a new all-time high around $290.

BITCOIN: A TALE OF EXHAUSTED BULLSmart money tends to accumulate heavily when sentiment is at extreme fear, signaling belief in a rebound. It is often correct, though not consistently.
Much of the pessimism appears to be fully priced in at this point. Thus, a bullish scenario remains technically possible, although broader conditions still align with a bear-market environment.
Let's see.

Bitcoin 2026History doesn’t repeat like a record player — but it rhymes.
By tracking patterns critically (not fatalistically), we can:
1. Spot early warnings of past mistakes.
2. Identify where old models fail or not.
3. Make more informed choices about the future.
I'll make 12 updates ahead and we will find out how this patterns works in case of btc/usd.
Key Questions to Test Over 12 Months
Do halving cycles still drive price action, or has the market “priced it in”?
Does BTC is still just a “risk tech” (correlated with Nasdaq)?
Core Metrics to Track Monthly
a) Price & Volatility
BTC/USD closing price (monthly average).
30‑day volatility (standard deviation of daily returns).
Compare to past cycles (2013, 2017, 2021 peaks/bottoms).
b) On‑Chain Activity
Active addresses (network usage).
Exchange inflows/outflows (signaling accumulation vs. selling).
Hash rate (miner confidence).
c) Macroeconomic Context
U.S. inflation rate and Fed policy (interest rates, QT/QE).
Global liquidity conditions (M2 money supply, T‑bill yields).
Risk‑on/risk‑off sentiment (S&P 500, gold, USD index).
d) Regulatory & Adoption Shifts
New crypto regulations (U.S., EU, Asia).
Institutional adoption (spot ETF flows, corporate treasury allocations).
Tech updates (Bitcoin protocol changes, Lightning Network growth).
Meanwhile we will focus on charts.
The information and publications are not meant to be, and do not constitute, financial, investment, trading, or other types of advice or recommendations.

Ripple Is Still Bullish Despite Recent Spike LowerRipple is still bullish despite the recent spike lower, which can act as a strong support from a technical and Elliott wave perspective.
Ripple is a blockchain-based digital payment protocol designed for fast, low-cost international money transfers. Its native cryptocurrency, XRP, helps facilitate transactions between different currencies, making cross-border payments quicker and cheaper compared to traditional systems like SWIFT.
Ripple sold-off recently and it made a huge spike lower due to the market manipulation, but these spikes usually act as a strong support. It still looks like a complex W-X-Y correction in wave IV on a daily chart, which can now resume the bullish trend within final wave V of (V).
In the 4-hour chart, we can see a massive spike down, but out of wave (B) triangle pattern, so it’s a penultimate move into wave (C) of Y. With the current strong rebound and recovery, seems like bulls are back in the game, and it looks to be forming a bullish setup with waves 1 and 2. So watch out for further rally within wave 3 of a five-wave bullish cycle, especially if jumps back into 2.7 area and later above 3.10 bullish confirmation level.

Your Playbook for Deep Corrections: Top Seven Things to KnowEvery trader hopes that whatever is happening with any pullback is healthy. “Just a healthy retreat, it’ll go back, it always does. R-r-right?”
While that’s true (obviously, markets had always shot up to records after deep losses), your job is to survive that lower leg and ideally come out stronger than before.
Because sometimes the market doesn’t correct immediately. It drops, turns around, drops some more and doesn’t ask you how you’re doing.
Where are we in the valuation cycle now? In the “Is this AI thing a bubble” talks.
With stocks stretched, AI valuations orbiting Saturn, and Nvidia NASDAQ:NVDA dictating the market’s fate, investors are starting to ask: What happens if this thing unwinds… fast?
A deep correction shakes your portfolio like nothing else, ultimately putting your strategy (and sanity) to a test. That's why you must know how to deal with correction ( if when it comes).
Here’s your playbook. Seven things every trader should know when markets get serious.
⚡️ 1. Know What’s Driving the Tempo
Right now, the tempo-setter isn't in the economic calendar (but good to keep an eye on it). It's not gold, the US dollar, oil prices, or consumer sentiment.
It’s Nvidia NASDAQ:NVDA
The stock has shot to stratospheric levels, climbing with such force that the entire market now reacts to its every earnings forecast, capex comment, and Jensen Huang metaphor about the "virtuous cycle of AI.”
When a single company starts steering the market’s mood, you know the stakes are high. Nvidia’s rise has been spectacular. Its potential fall could also be spectacular.
If there’s a crash in the current market, undoubtedly tech goes first, and AI-tied shares are poised to lead the plunge. Not because the companies are bad, but because valuations are sky-high, crowded, and pumped by shady-looking multi-billion-dollar deals.
🧨 2. Sky-High Valuations Fall the Hardest
AI has been the market’s darling. And like any hot market corner, the exit door gets crowded when the music stops.
These stocks work great in a liquidity-rich, momentum-heavy environment. But in a deep correction, they can drop first and fastest.
Why?
They’re relatively expensive.
They’re owned by institutions (by boatloads).
They’re deeply intertwined with leverage.
When selling starts, it spreads: chips, software, cloud. Really anything with “AI initiative” mentioned in the last five earnings calls.
If the correction deepens, correlations go to 1 , and “diversification” starts to feel like a theoretical concept.
🧺 3. Staples Can Survive. But Aren’t Safe.
What tends to hold up in a downturn?
Companies that produce things people buy every day.
Coca-Cola NYSE:KO , Procter & Gamble NYSE:PG , Walmart NYSE:WMT , Costco NASDAQ:COST . These are the boring giants who don’t need AI hype to sell toothpaste, detergent, and caffeine.
But here’s the catch.
When tech crashes, fund managers don’t just sell tech.
They sell everything with liquidity to buy the tech names they've been waiting to own at a discount.
That includes consumer staples. Even the defensive darlings can get dumped to fund someone’s impulsive “NVDA is finally cheap!” moment.
🧭 4. Corrections Have Phases. Know Which One You’re In.
Corrections tend to move in waves:
Denial: “This is just a dip.”
Realization: “This is not a dip.”
Capitulation: “Sell everything.”
Bargain hunting: “Wait… everything is on sale.”
Recovery: “We survived. Buy up!”
Don’t confuse early weakness with late-stage panic.
Ideally, you want to buy when everyone else is emotionally unavailable, not when they’re still debating if it’s a pullback or an opportunity.
📊 5. Liquidity Matters More Than Fundamentals
In a deep correction, fundamentals usually take a backseat.
Everything becomes about liquidity.
Who needs cash?
Who has margin calls?
Who needs to rotate?
Which institutions need to de-risk?
This is why great companies drop alongside mediocre ones.
Liquidity can trump logic.
Market structure can trump valuation.
And algos don’t care that you really like that stock long-term.
🧘♂️ 6. Your Mindset Is a Position Too
Corrections can provoke every trading impulse, especially if they're steep and you expect a quick rebound:
Revenge trades
Over-leveraged dip buying
Premature bottom-calling
The hardest thing during a deep correction isn’t predicting the bottom, but not losing your head (and cash) before the bottom arrives.
Pro traders work with a few rules that help them avoid emotional decision making:
Pre-set drawdown limits
Scaling entries
Non-negotiable stop-losses
Portfolio hedges
Cash as an asset
If you don’t have a playbook before the drop, you’ll be writing one during the drop.
🛒 7. Buy the Best, Not the Loudest
When markets crack, everything goes on sale, everyone knows that.
Before you go bargain hunting and deep discount shopping, prioritize:
Cash-generating giants
Companies with pricing power (and moat)
Firms selling essentials in whatever industry
Businesses that don’t rely on hype to survive
🧾 The Takeaway
A deep correction may not be the end of the world, but it could be the market’s way of redistributing opportunity.
Nvidia and the AI titans have been running the show. And they’ll likely lead any sharp selloff.
And yes, even your safe, boring consumer staples can get dragged into the downside.
But corrections create clarity. They separate narrative from value, hype from durability, and momentum from substance.
If you stay disciplined, patient, and unemotional, a correction becomes less of a threat and more of a roadmap, pointing you toward assets worth owning when the next bull run begins.
Off to you : What’s your take on the current market situation? Do you see a bubble in the works, ready to go pop? Or it’s all looking fine and dandy, no reason for caution?

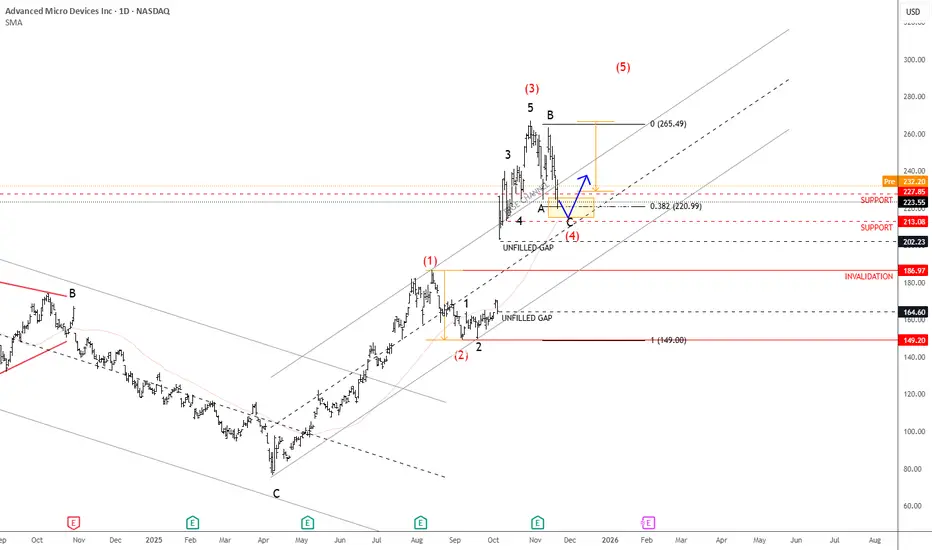
AMD Is Approaching Support, While Finishing A CorrectionAMD is in a very strong uptrend, supported by the impressive rally since early October when it gapped higher on positive AI news. Since then, the stock has gained more than 50%, and this bullish momentum could continue after a retracement, especially considering latest company’s better-than-expected earnings report.
But based in latest price action, we assume that the market is now in a corrective pullback before resuming higher, ideally forming wave four within a broader five-wave sequence. The previous high around 220 could act as the first key support, followed by the 200 area, which also aligns with upper range of unfilled gap. So if we are correct, then later this month or early in December, the market can once again stabilize and turn up for a new high, while the price is above 187 invalidation level.
Highlights:
Trend: Strong uptrend, wave four correction in view
Support: 220 / 200 zone
Invalidation: Below 186
Note: Wait for a pullback to complete before considering new long opportunities
BTC: 2021 playbook. People expect a V shape bounce, when I think the odds favor more of a 2021 type of long correction (death cross swing). Reason being, the break of a strong momentum log trend, lower lows in BTC/SPX.
If we are on the bottom --> it took 2 months , before next break out. (20 May -> 20 July).
I think most momentum stocks, like NASDAQ:PLTR , NASDAQ:HOOD should lose their momentum and form tops (people who didnt sell the top, should take profit next time it's at ATH). Stage cycle.
BTC is a risk on indicator. TVC:DXY dollar has broke out, indicating demand for cash.
//November is usually a strong month. Good news - stocks drop is a sign of top.

End of crypto cycle or healthy correction?Has the crypto cycle ended? If so that means no alt-season for sure.
Consider:
Bitcoin's 4 year cycle
The 4 year CRYPTOCAP:BTC cycle is well documented by now, and something X pundits are hanging their hats on, claiming the top is in.
Institutions are investing
The likes of Harvard, with an endowment now boasts Bitcoin as its largest holding (at $116k/coin no less).
The Fed is cutting rates and pausing QT
It might be a slow easing cycle due to entrenched inflation, but easing is better than tightening for risk assets.
Is it possible we've topped for this cycle and prices are heading much lower from here? Absolutely. However I think it's a good place to hedge on there still being upside left. Nibble at ostensible value with cautious optimism.

NVDA: 1 week before earnings effect. Supply-demand imbalance.Parretto principle (20-80): small important things can have great influence in grand scheme of things. Some events have greater weight, than say 80-90% of daily events.
Stocks move based on Supply-demand dynamics (disbalance etc), patterns or trends are just a feedback.
The problem with using charts as a feedback for strength (or feedback for S-D strength) is that: (1) on a expensive market, with extended prices (with high supply too), (2) during important NVDA earnings, it's almost predictable how markets would sink, or at least be volatile.
Demand stalls. Supply gets worried. Price down.
//People are risk averse. Hence.. predictable.

BTC: Careful out there.Bitcoin has lost it's momentum, also evident in GOLD/BTCUSD graph (meaning, gold has stole the show from btc). Lower Lows in this graph would mean bear market or a deeper correction Imo.
Other bad sign is SOXX/SPX lower highs, underperforming. Could be a sign for market top but lets see.

$BTC Correction DOES NOT = Bear MarketPeople are rushing to call it a 🐻 market for CRYPTOCAP:BTC while the correction is 27.8%
Fun Facts:
There were 2x 32%+ corrections between 2024-25
On average, there are at least 3x 30%+ every bull cycle
🐻are in control since summer no doubt
But it's not a 🐻market yet...

BTCUSD Bulls Aim Higher: Buyers Eye Breakout Toward $107,500Hello traders! Let’s take a look at the current BTCUSD structure. After an extended corrective phase within a descending movement, the market found solid support near the $100,000–$100,200 Buyer Zone, which aligns with both the horizontal Support Level and the lower boundary of the broader structure. This zone has repeatedly triggered strong buying reactions in the past, confirming it as a key demand area. Recently, Bitcoin began forming a bullish correction channel, where price has been developing higher highs and higher lows, suggesting early signs of trend recovery. Within this structure, buyers successfully defended the Buyer Zone, followed by a steady rise toward the $107,000–$107,500 Resistance Level — a zone that previously acted as a Seller Zone during prior rejections. At the moment, BTCUSD is consolidating inside this ascending channel, trading slightly below resistance. The market may attempt another push toward TP1 at $107,500, which aligns with the upper resistance line and marks a potential short-term target. If price manages a confirmed breakout above this level, we could see further continuation toward the next resistance around $111,000. However, if the price faces rejection at the current resistance, a temporary pullback toward the Support Line or Buyer Zone ($100,200–$101,000) could occur before the next wave of growth. The structure remains bullish as long as Bitcoin stays above the ascending Support Line. Please share this idea with your friends and click Boost 🚀

Monitoring AI Valuation - Precision on Upcoming CorrectionThese are the three largest market-cap listed companies on the Nasdaq.
If we are concerned about an AI bubble, I’m going to show you how I perform a quick glance at some top companies and their index to determine the likelihood of an upcoming short-, mid-, or long-term correction.
In 2017, Microsoft’s P/E reached its highest at 45 — and it continued to rise after that.
In 2023, Nvidia’s P/E reached its highest at 147 — and it continued to rise after that.
In 2024, Apple’s P/E reached its highest at 40 — and it continued to rise after that.
Micro E-mini Nasdaq-100 Index
Ticker: MNQ
Minimum fluctuation:
0.25 index points = $0.50
Disclaimer:
• What presented here is not a recommendation, please consult your licensed broker.
• Our mission is to create lateral thinking skills for every investor and trader, knowing when to take a calculated risk with market uncertainty and a bolder risk when opportunity arises.
CME Real-time Market Data help identify trading set-ups in real-time and express my market views. If you have futures in your trading portfolio, you can check out on CME Group data plans available that suit your trading needs www.tradingview.com

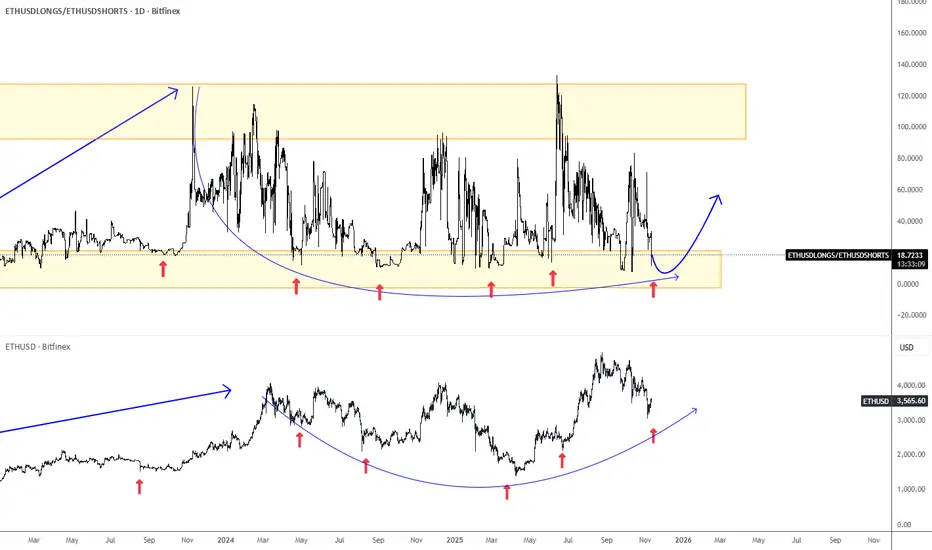
Ethereum Is Approaching SupportEthereum has been slowing down since August, but the wave structure remains slow, choppy, and overlapping, which suggests a correction within an ongoing uptrend. The ideal support area appears to be around the 3000 level.
One of the main reasons Ethereum may find support is the ETHUSD Longs/Shorts ratio chart, which came back to the lower end of its range. This indicates that many speculators are attempting to short the market while giving up on long positions.
If we take past cycles into account, Ethereum may experience limited weakness. Therefore, keep an eye out for a potential rebound and a bullish continuation, while the ETHUSD Longs/Shorts ratio chart could move back toward the upper side of its range.
DCR - The Calm Before the Next Impulse!📈DCR has recently surged in a parabolic manner, posting one of its strongest rallies in months. However, after such a vertical move, a correction phase was inevitable, and that’s exactly what we’re seeing now.
📉At the moment, price is retracing within a clear descending channel, approaching a massive confluence zone marked by the demand area and the lower red trendline. This intersection represents a key area of interest to look for potential long setups.
⚔️If buyers manage to defend this zone, DCR could soon resume its next impulsive leg upward, potentially breaking out of the correction structure and extending the broader bullish momentum.
⚠️ Disclaimer: This is not financial advice. Always do your own research and manage risk properly.
📊All Strategies Are Good; If Managed Properly!
~Richard Nasr

BTCUSD Tests Buyer Zone — Eyes Break Below $100KHello traders, here’s my current outlook on Bitcoin (BTCUSD). The market continues to trade within a broader bearish structure after breaking down from the previous rising channel. The price failed to hold above the $110,000–$111,000 Seller Zone, where multiple fake breakouts occurred, indicating strong bearish pressure and aggressive selling activity in that region. After the rejection from the Seller Zone, BTC shifted into a descending trend structure, forming lower highs along a clearly defined Resistance Trendline. Each corrective move to the upside has been capped by this trendline, confirming that sellers are maintaining control. Meanwhile, the Support Level around $100,200–$101,000 has acted as a key Buyer Zone, where price has repeatedly paused and reacted, suggesting that buyers are attempting to absorb selling pressure here. Currently, BTC is consolidating just above this Support Zone, but the overall momentum remains bearish. If the price fails to break above the descending Resistance Line, we could see a continuation of the downtrend, likely pushing toward a retest of the $100,200 Support Level. A confirmed breakdown below this level would expose the next downside support levels and reinforce the sellers’ dominance. However, if buyers manage to hold the price above $100,200 and force a breakout above the descending Resistance Line, a short-term corrective recovery could unfold toward the $103,000–$105,000 region. This area remains critical and is likely where sellers may look to re-enter the market based on previous reaction structure. For now, the market structure favors a bearish bias, with the trend down and sellers maintaining stronger control. I am watching for a reaction at the current support — if the level breaks, continuation lower becomes the primary expectation. Please share this idea with your friends and click Boost 🚀
