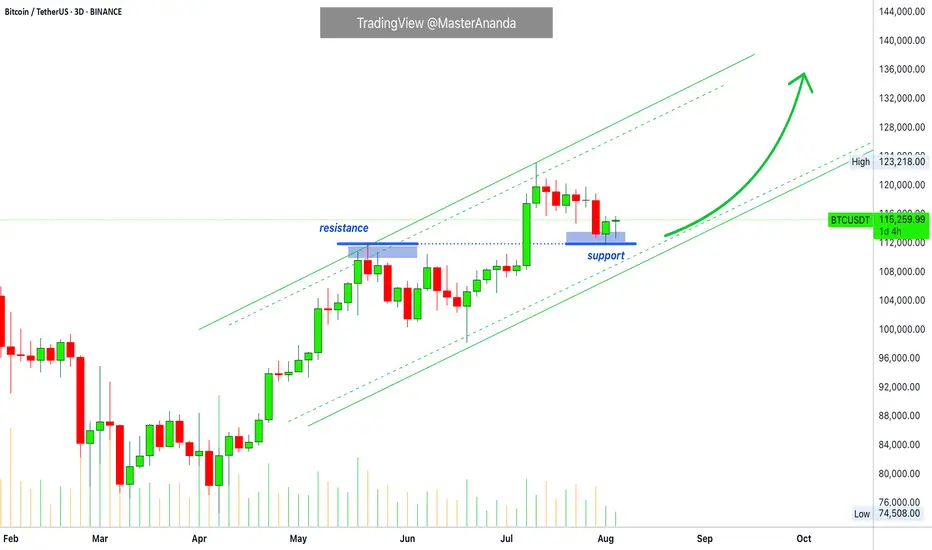
Bitcoin Update • Resistance Turned Support · TOP Altcoins ChoiceTraders hedge for a Bitcoin drop below $100,000?
Meanwhile, Bitcoin is rising trading above 115K. Resistance turned support.
The last all-time high turned out to work as support this time.
The retrace from 123,000 to 115,000 amounts to a 6.5% decline, which simply means that Bitcoin is trading at or near resistance. Staying close to resistance after a new all-time high is major signal of strength. A bearish signal would only become real if a high volume drop develops or Bitcoin closes weekly below 110,000. This isn't happening right now so the bulls win.
Are you a bull? You win.
I am a bull. I win.
👉 As Bitcoin continues bullish the altcoins market will continue to grow. Knowing this, which one is your Top Altcoin Choice ?
👉 Leave a comment with your favorite altcoin.
I will do a full analysis for you and publish in my profile.
If the chart doesn't look great, I might reply right here in the comments section.
Thanks a lot for the continued support. It is appreciated.
Let's play again.
Let's trade again.
Together we can win.
Success, profits and growth long-term.
Namaste.
Crypto
Dogecoin Turns Bullish · Leveraged Trade · 3320% Potential @8XThe support zone is the 0.618 - 0.786 Fib. retracement levels marked blue and purple on the chart. We can clearly see two hammers (candlestick patterns), last week and this week. We can see the higher lows but also the broader rising channel structure. We can also see the even bigger structure coming from the low in 2024. In short, a long-term bullish cycle unfolding right in front of our eyes... Dogecoin is going up.
I am approaching this pair for my people with high leverage. High leverage means high risk. At the same time, we also have a very high potential for reward. The last target goes beyond 3,000%.
You don't have to go for all the targets nor all the lev. You can use lower leverage for less risk, more stability and peace of mind. You can do 2-3X and this would be a safe trade setup. You can do 4-5X for mild risk but still a strong potential for reward. And finally, you can do 6-8X as an expert knowing that you can get liquidated in a flash. All money can be gone. But, if my timing is right, you can end up with a position so strong that regardless of what happens after the breakout, sell early or late, you will be happy with the results.
It is always tricky, but we continue to learn and improve. Here we can see what is possible. Knowing what is possible, planning, preparing and taking action in the right way, we can achieve our goals and quit our day-job.
Trading is no different to any other profession/work, it takes time, practice, patience and dedication. The only difference is that here when you get it right you are rewarded for the long haul. Once you learn how to trade, that is, learn to play the market at its own rhythm, you can collect as much money as you want. It is true, but it takes years of hard work.
Here we have Dogecoin again. Will it grow? Will it crash?
Time will tell, but my money is on prices going up.
My money, my rep, my trust.
Let's see... Let's wait and see.
Not all trades are meant to be won.
If you follow capital allocation and a good strategy, you are able to take in the losses that are inevitable and still win big at the end of the game.
Remember, it is not about winning the all; it is about winning big, it is about winning over and over; it is about creating the habit of winning and this habit will make all the time and effort we invest in this venture worth it. It is not about being right, it is about getting paid.
With the right mindset and a little bit of patience... We can do this!
Namaste.

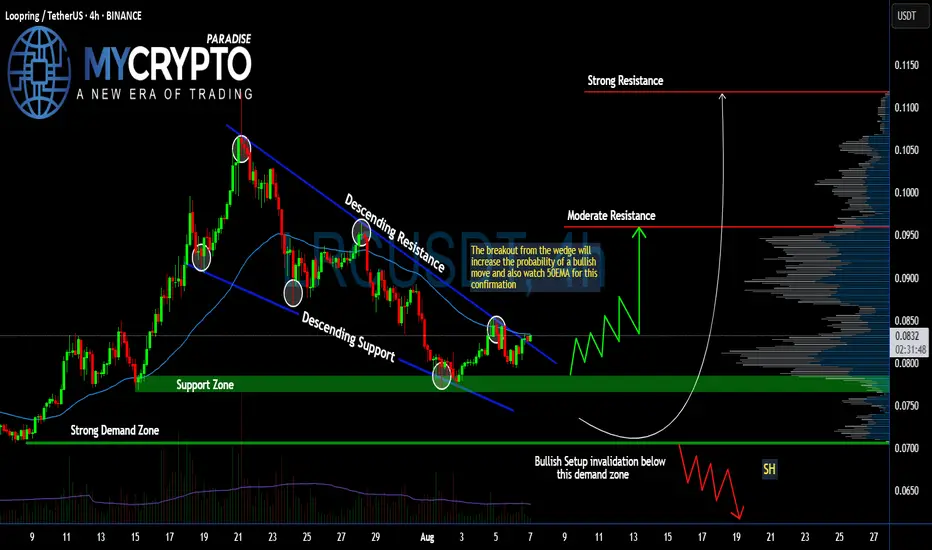
#LRC Ready for a Massive Recovery From Here | Must Watch Yello, Paradisers! Is #LRCUSDT finally ready for a breakout, or is it just another trap for early bulls? Let's break down the current structure of #LRC.
💎#Loopring ( CAPITALCOM:LRC ) has been moving within a descending wedge pattern for weeks, with price consistently making lower highs and lower lows—clearly respecting both descending resistance and support levels. However, we are now starting to see signs of change as it retests the upper trendline.
💎A breakout above the descending resistance is about to occur, and it’s doing so right around the 50EMA, which adds further confluence for a possible bullish move. This move is increasing the probability of a short-term trend reversal.
💎The support zone around $0.078–$0.082 is the key region to watch now. If bulls can hold above this zone and reclaim it as a base, we could see a breakout continuation toward the moderate resistance at $0.096. Should momentum build up from there, the next big target is the strong resistance at $0.1118—a level marked by historical seller interest and significant volume profile resistance.
💎However, if #LRCUSD falls below the strong demand zone at $0.0706, this entire bullish setup becomes invalid. That breakdown would suggest the market isn't ready yet, and could trigger another wave down toward fresh lows.
Stay patient, Paradisers. Let the breakout confirm, and only then do we strike with conviction.
MyCryptoParadise
iFeel the success🌴
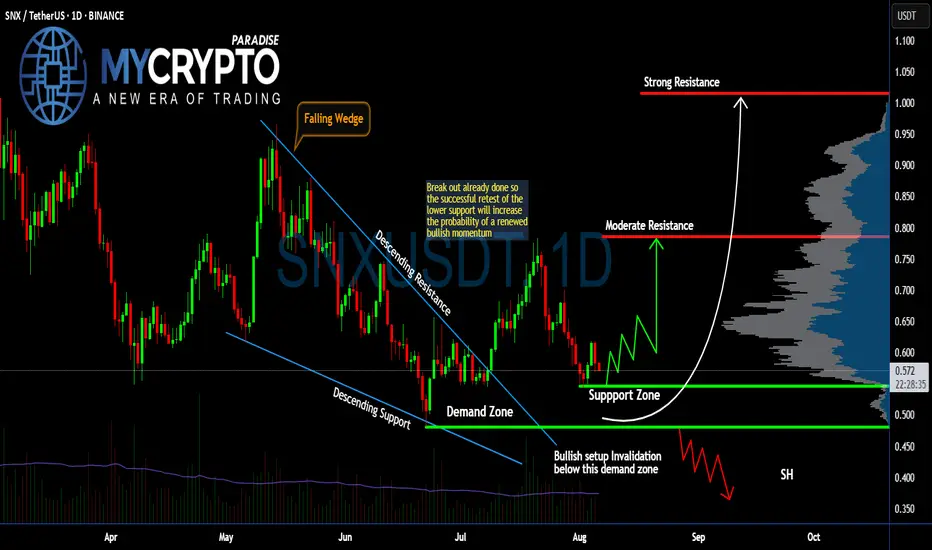
Can #SNX Bulls Sustain the Current Momentum? Watch it CloselyYello, Paradisers! Is this #SNX setup just another fakeout in disguise, or is the market quietly setting up for a major bullish momentum shift? Let’s dissect what’s really happening on #SNXUSDT:
💎After moving through a falling wedge pattern for months, #Synthetix has already broken out above the descending resistance, signaling an early shift in trend. However, the real move hasn’t yet begun—a proper retest of the support zone between $0.50–$0.54 is what we’re watching for now.
💎This support zone aligns with the prior wedge breakout and also overlaps with a visible demand area, making it a key region where buyers could step in again. If bulls defend this area successfully, we expect a renewed rally toward the moderate resistance level at $0.78.
💎From there, the next upside target lies at the strong resistance around $1.01—a level with heavy volume profile resistance and previous seller activity. But that level will only come into play if the bulls reclaim momentum with conviction.
💎On the flip side, if #SNXUSD breaks below $0.48, which is our bullish invalidation level, the setup collapses and opens the door for a deeper drop toward the $0.40–$0.35 zone, where short-sellers are likely to pile in.
Stay patient, Paradisers. Let the breakout confirm, and only then do we strike with conviction.
MyCryptoParadise
iFeel the success🌴
BTC - Short Setup at 0.702 Fibonacci & Fair Value GapMarket Context
Bitcoin recently rejected from a major resistance area and has since been retracing downward, finding temporary support inside a bullish Fair Value Gap. The market is currently in a corrective phase, with buyers attempting to defend lower levels while sellers look for optimal positions to reload shorts. This environment shows a classic tug-of-war between these two forces as price moves between supply and demand zones.
Consolidation and Current Phase
Although the prior consolidation has been broken, the current price action can still be described as corrective, with intraday structure forming lower highs. The bullish Fair Value Gap beneath price has been respected so far, creating a temporary base. However, the path remains complex, as the market has unfilled imbalances both above and below.
Bearish Retest Scenario
One key scenario involves a retracement toward the bearish Fair Value Gap near 117K, which also aligns with the 0.702 Fibonacci retracement level. This confluence makes it a high-probability area for sellers to step in again. A rejection from that zone would likely resume the downtrend, with the next logical target being the deeper unfilled bullish Fair Value Gap around 110K. This zone acts as a magnet for price due to the inefficiency left behind during the last rally.
Bullish Defense Scenario
For bulls to regain control, the current Fair Value Gap at 114K must hold, followed by a strong move that invalidates the lower-high structure. Such a move would need to break above the 117K bearish FVG with conviction. Only then could momentum shift back to the upside, opening the door for another challenge of the higher resistance zones.
Final Words
Patience and precision are key when dealing with setups like this. Let the market come to your level — and react with intent.
If you found this breakdown helpful, a like is much appreciated! Let me know in the comments what you think or if you’re watching the same zones.

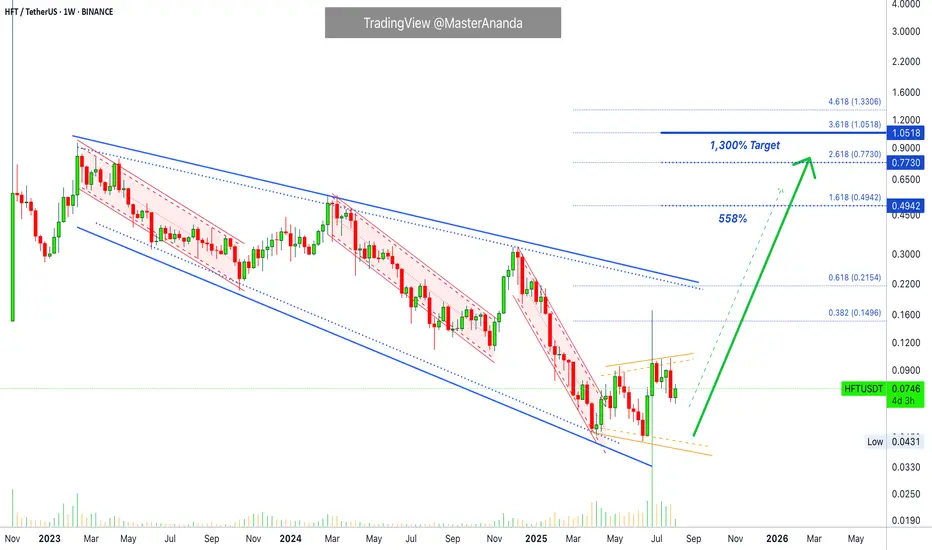
Hashflow Already Hit Bottom, I Can Prove It · 1,300% PPThe bottom is in. I can prove it and you will agree.
Good afternoon my fellow Cryptocurrency trader, how are you feeling in this wonderful day?
Hashflow (HFT) has been dropping since February 2023, a major decline but there is good news, just recently market conditions and price action dynamics started to change. Come April 2025 a downtrend is no more. Instead, when a new low was hit in June the chart ended as a double-bottom rather than a bearish impulse. And this is not all.
After the low in June 2025, the market bottom and all-time low, HFTUSDT produced the highest volume ever in a single week, by far the highest. Even higher than the first week of trading which tends to have the highest volume. And this confirms the bottom is in.
A downtrend ends, the bottom is confirmed. This combination reveals what comes next. Yes! A major bullish rise, a bullish impulse, a bullish cycle, a bullish wave. These are all the names for what you are about to experience next.
It is very simple actually, the market moves in cycles and within these cycles we have waves. The market was going down, long-term, as soon as the downturn is over we get a growing phase. Hashflow is set to grow.
Thank you for reading.
Namaste.
BITCOIN PULLBACK FROM SUPPLY AREA|SHORT|
✅BITCOIN price grew again
To retest the resistance of 116k
But it is a strong key level
So we are seeing a bearish reaction
And we will likely see a
Further bearish move down
SHORT🔥
✅Like and subscribe to never miss a new idea!✅
OM Prepares Recovery Catastrophic Crash · 2,000% Easy PotentialMantraDAO (OM) performed a catastrophic crash in April and the bottom was hit in June. Keep in mind that it doesn't matter how hard a project crashes, it tends always to recover.
Once upon a time Solana produced a major, major crash and people started to run away. I saw this as an amazing opportunity and recommend buy for Solana when it was below $20 and guess what happened next? Solana is today one of the top performers.
When a project produces a very strong crash, for one reason or the other, it tends to recover strongly at the next market cycle. The action tends to move back to the previous high or the baseline.
OMUSDT found support exactly where there was a stop in February 2024. The launchpad for the final leg-up of the previous bullish cycle. When I saw this same level activated perfectly, it called my attention. What do you see?
Resistance (the last high) turns into support. Support (February 2024) stays support. Long-term support tends to work over and over and here we have a long-term one.
The action short-term has already many of the classic reversal signals. After the main drop in April we had some lower lows as an ending diagonal. Then the main low is followed by a higher low, rising volume and marketwide action heating up.
It is here...
We are here...
It is happening now...
Crypto is going up.
Prepare for the ride, prepare for the profits and prepare for the fun.
It will be wild... You will be extremely happy with the results.
MantraDAO is set to grow.
Buy when prices are low.
Namaste.

Polygon · Bottom, Recovery & 5,000% Growth PotentialPolygon has been bullish since April, clearly rising from its base for months. Now this Cryptocurrency trading pair is preparing for a new phase and market cycle. It is preparing for its 2025 bull market wave.
Polygon after a major drop produced a clear bottom and higher lows. This process has been active now four 120 days/4 months. This is a long consolidation period and there are no new lows, clearly. A rising triangle as a reversal signal is also present on the chart.
The accumulation period has been lasting, we can see how patience is key for success. Who would be able to hold for four long months? Who is still holding wise for 120 days?
Well, those who wait get paid. Those who waited will get paid but there is no need to wait because you can still buy and profit from the incoming bullish wave. The difference is that prices are higher now so growth potential is limited compared to several months in the past, that's how it works. The market builds up strength slowly and as this strength is being built prices grow.
When there is enough strength, enough interest and enough growth, the masses enter the market and this produces a major bull run. I've been warning you, we are getting very close. The action is already happening now, don't be surprised when you see a 300%+ bullish jump. That is exactly what is coming and it will all happen within a few months.
Expect 500% to start but aim for 1,000%, 2,000% and in some cases even more. Many good, strong and reputable pairs will grow 3,000%, 4,000% or 5,000%. Polygon will be one of the big ones.
Thanks a lot for your continued support.
Namaste.

BTCD Bear Market Confirmed · Altcoins Bull Market ConfirmedThis is a rising wedge pattern and it broke for the first time after 792 days. We are looking at Bitcoin Dominance (BTC.D) on the monthly timeframe, super long-term.
A classic long-term double-bottom in 2022 launched a massive uptrend. This uptrend developed within a perfect rising wedge. Last month BTC.D broke this pattern with a full red candle and the highest volume since November 2024.
To add some perspective, the highest volume months were last month (red) and November 2024 (red). The highest volume before these two only happened during the climax of the 2021 bull market, so you can have an idea how strong the volume is this time around.
Since Bitcoin Dominance has an inverse relation with the growth in prices of the Cryptocurrency an Altcoins market, when Bitcoin Dominance was ultra bearish and crashing down, 2021, the Cryptocurrency market was ultra bullish and moving up. Seeing this major long-term signal, the highest bearish volume month to break a 792 days long uptrend, reveals the start of another major crash on this index. The major crash on this index is the confirmation of the late 2025 altcoins bull market.
Bitcoin and the altcoins market will continue growing on all terms.
Thanks a lot for your continued support.
If you agree, leave a comment.
Namaste.

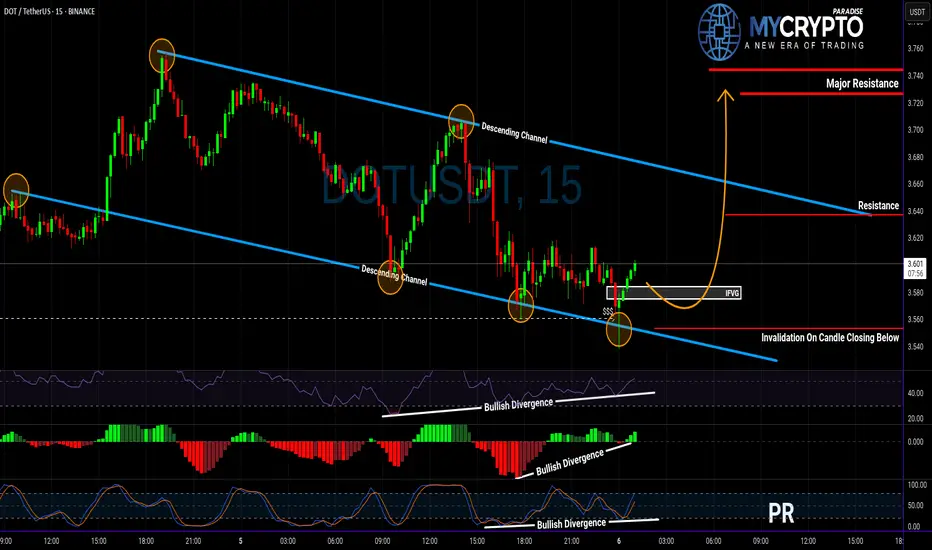
DOT About to Explode or Collapse? Read This Before Entering!Yello Paradisers, are you watching DOT closely? Because this setup could either give aggressive traders a golden entry—or wipe out the impatient ones 👀
💎DOTUSDT is showing strength after sweeping liquidity and now sitting right at the supportive trendline of its descending channel. What’s catching our attention is the clear bullish divergence on RSI, MACD, and Stoch RSI, which together boost the probability of a bullish breakout from here.
💎If we get a pullback, the IFVG zone (Inverse Fair Value Gap) below offers a clean setup for a high RR (risk-to-reward) trade. That would be a more strategic entry for patient traders. But for those who trade more aggressively, the current price is already offering a decent RR setup—just remember, this is not advisable for beginners. Patience and discipline remain key, especially in uncertain zones like this.
💎However, if DOTUSDT breaks down and closes a candle below our invalidation level, the bullish scenario is completely off the table. In that case, the smartest move is to step aside and wait for better confirmation before making any decisions.
🎖Strive for consistency, not quick profits. Treat the market as a businessman, not as a gambler.
MyCryptoParadise
iFeel the success🌴
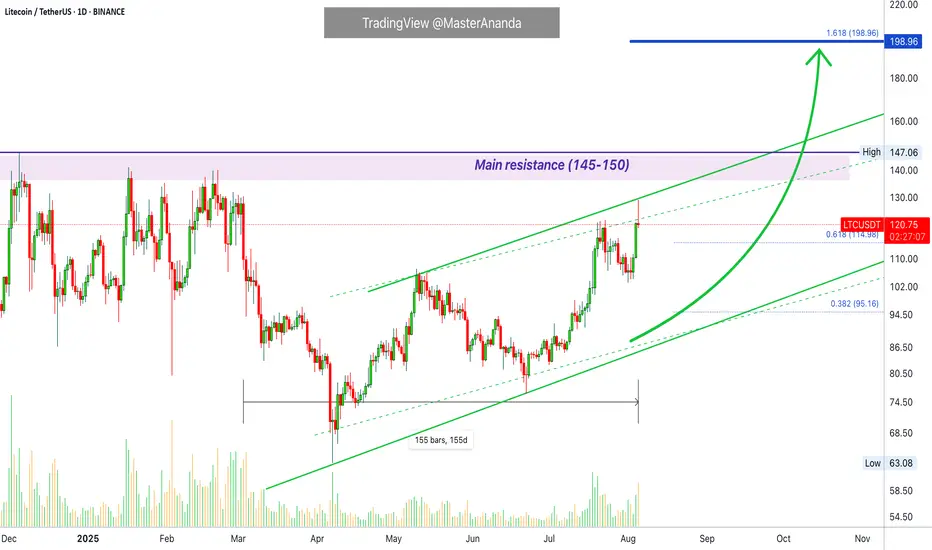
Litecoin Hits a New High · Update · Highest Price in 5 MonthsToday Litecoin hit its highest price in more than five months, since March 2025. Soon Litecoin will break its December 2024 high and produce the highest prices since the last bull market, 2021. We are getting very close now.
A few weeks back the market was in a similar situation, doubt started to creep in and people wondered if the market was set to endure a long-term correction or resume higher. We used Bitcoin Cash which was moving ahead to prove the rest of the market would do the same and it happened as predicted. Before Bitcoin Cash, further back, we used XRP and it worked.
Today we are looking at Litecoin and the action this chart is showing matches additional growth. While some pairs are retracing or consolidating, others continue to move ahead. This only happens in a bull market, and, when Bitcoin retraces while the altcoins continue to grow, this is a sure sign that the bulls are buying and the market expects additional growth.
Additional growth but remember retraces will always be present along the way. The market grows steadily but it takes time. Five steps: three steps forward, two step back. Allow time for variations. Retraces and corrections are an opportunity to rebuy and reload.
Secure profits when prices are up; buy back at support.
Sell when prices are high; sell when the market is green.
Sell when everything feels fine and great.
Buy when prices are low; buy when the market is red.
Buy when everything feels down and depressed.
Go against the market impulse. Make your decisions based on information. The market is growing and set to continue growing long-term. Choose wisely and let the market take care of the rest.
Namaste.
DOGE Breakout?After a 13 day rally and a 12 day pullback, could DOGE be breaking out and confirming a new 4H trading range?
After a bounce off the bullish orderblock DOGE has broken out of the diagonal downtrend, then pulled back to retest the previous diagonal resistance level as new support. This is a textbook breakout play & retest but this doesn't 100% guarantee the breakout will be successful. Should it be a successful breakout Local Resistance is the first clear level of interest for the bears to fight back.
This type of setup does give a clear invalidation should price fall back into the downtrend with acceptance. A fakeout could also lead to a loss of the Major Support level, that would introduce a potential revisit of $0.166.

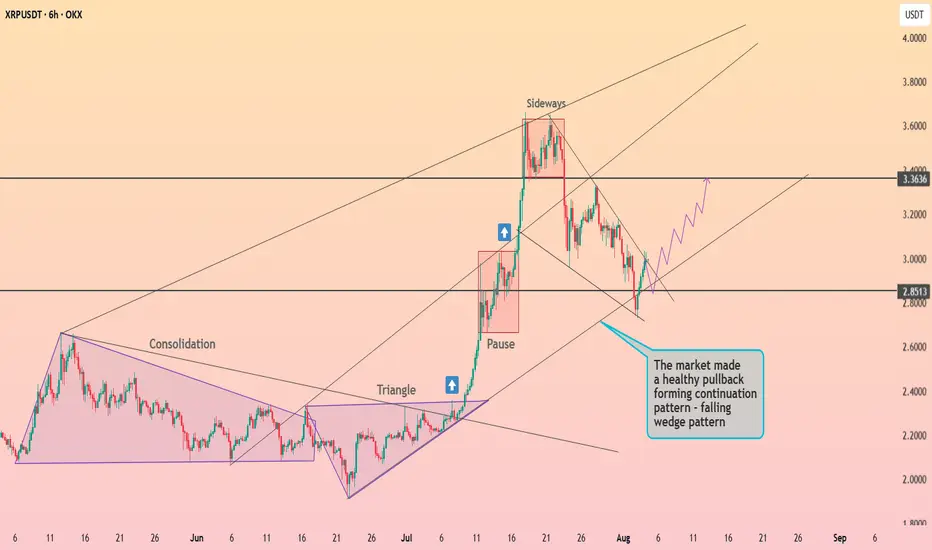
XRP is preparing to exit the wedge ┆ HolderStatOKX:XRPUSDT is forming a falling wedge after a sharp breakout and pullback. Price is stabilizing near $2.85, a key former resistance level. If bulls reclaim momentum here, a move toward $3.36 becomes a high-probability scenario.
Bitcoin Ready for Takeoff - $150K Target Ahead! MARKETSCOM:BITCOIN is showing impressive strength after successfully retesting its May high and bouncing back with conviction. This level, along with the 50 EMA, is currently acting as a strong support zone. Holding above this area signals that buyers are in control, and this zone now serves as a major support for the ongoing bullish trend.
At the moment, CRYPTOCAP:BTC is facing minor resistance in the $115K–$116K range. A decisive breakout above this level is likely to trigger strong momentum, opening the doors for a new all-time high. Once this resistance is cleared, our previous projection of $150K comes into play as the next major target.
For now, it’s crucial for MARKETSCOM:BITCOIN to hold the current support zone to maintain the bullish structure. As always, traders should manage risk effectively and place stop-losses to protect their capital in case of unexpected volatility.
Follow Our Tradingview Account for More Technical Analysis Updates, | Like, Share and Comment Your thoughts

U.S. Dollar Index (DXY) !!U.S. Dollar Index (DXY)
Long-Term Channel Support Held
The chart shows DXY moving within a rising parallel channel since around 2008.
Recent price action bounced right from the lower trendline (~98 zone), indicating strong structural support.
Bearish Pressure
DXY dropped below 100, currently around 98.72, down 1.32% this month.
Trading below the 200-month EMA, which suggests weakening long-term strength.
Bearish candlesticks forming near the lower channel indicate an increased risk of a breakdown if support fails.
Ichimoku Cloud Signal
Price below the Kumo (cloud) = bearish territory.
Cloud turning thin ahead — signaling potential indecision or transition.
What This Means for Markets
If the DXY breaks below this channel, it could trigger a broader USD sell-off, potentially bullish for cryptocurrencies, gold, and emerging markets.
If support holds, expect a rebound toward the 104–106 zone, especially if macro sentiment favors the dollar.
Stay updated and manage your risk accordingly.
DYOR | NFA

SYRUP · Higher & HigherI can see this one rising and rising and somehow I think I am not the only one that can see it. Can you see it? I see SYRUP going up and it is as if it is already happening.
Technical analysis
A several month long support is holding now. This support range was tested twice in the past and both times a bullish move developed. Now is the third time and after this support zone was activated SYRUPUSDT has been closing green. Today will be the third green day and when this happens we know what happens and what happens is that the market tends to grow really strong in the ensuing days. It gets bigger and bigger and it happens all the time. It happens after the correction or retrace ends.
A retrace just ended lasting a total of 8 days. From 25-July through 2-August. A very short retrace but the next will be a higher high and the bullish wave will be nothing like the retrace. The bullish side is many times stronger and the market will blow up next. It can take some time to start but as momentum grows, expect to see a pattern of rising prices.
Thank you for reading.
Namaste.

TON/USDT |Toncoin Pullback – Watching for Bounce Toward $4.20+By analyzing the Toncoin chart on the 3-day timeframe, we can see that after reaching $3.73, the price has entered a correction phase and is currently trading around $3.30. We should soon watch for a potential bullish reaction from the $3.03–$3.30 zone. If the next upward move begins, the bullish targets will be $3.74, $4.20, and $4.68.
Please support me with your likes and comments to motivate me to share more analysis with you and share your opinion about the possible trend of this chart with me !
Best Regards , Arman Shaban

ETH | Ethereum Game Plan - Swing Long IdeaETH | Ethereum Game Plan - Swing Long Idea
📊 Market Sentiment
Market sentiment remains bullish, supported by expectations of a 0.25% rate cut at the upcoming FOMC meeting. The weakening USD and rising risk appetite across global markets are favoring crypto assets in particular.
📈 Technical Analysis
Price swept the range low (Weekly Fair Value Gap), resulting in a deviation.
It then aggressively reclaimed higher levels and closed above key resistance.
A 12H demand zone was formed during this move.
We’re now seeing a retracement towards that 12H demand zone.
📌 Game Plan
I’m looking for price to hit the 12H demand zone at $3,530 and show a strong reaction.
This level is also below the 0.5 Fibonacci retracement, placing it in the discount area — an ideal entry zone for me.
🎯 Setup Trigger
After price taps the demand zone, I want to see a 1H–4H bullish break of structure to confirm the reversal before entering.
📋 Trade Management
Stoploss: Below 1H–4H swing low
Targets:
• TP1: $3,872
• TP2: $4,090
I’ll trail my stop to lock in profits aggressively as price moves in my favor.
💬 Like, follow, and comment if this breakdown supports your trading!
More setups and market insights coming soon — stay connected!

Gns Looking Goodmajor trendline breakout and retest has already confirmed, currently consolidating under resistance, expecting breakout, successful breakout could give 2x rally in coming days.

Bitcoin is forming a double bottom ┆ HolderStatKUCOIN:BTCUSDT is bouncing from 112,000 support, forming a potential double bottom. The setup aligns with prior bullish continuations from similar consolidation zones. A push toward the ATH region could follow if buyers remain in control.

Sun Token Prepares Major Rise · No ResistanceSun Token (SUN) has been rising. It has been rising short-term, long-term and at all times. It has been green now seven weeks and I am publishing because I see a major advance starting. Something like August 2024 or February-March 2024. Something like this.
SUNUSDT hit bottom November 2022 and it has been growing since. The main low happened November 2022, then August 2024 and finally April 2025. All higher lows of course and a very strong chart.
SUNUSDT is a strong buy and already moving up, but what is about to happen is when bullish momentum grows. Something like a surprise move because it is so strong.
That's what I see based on the many weeks of bullish consolidation. When prices are rising slowly, not one sell. Everything is always buying. This pattern always reveals a clear bullish bias and leads to a strong bullish breakout.
The action is happening above all moving average with strong oscillators also, that is, all the classic signals are present on this chart and already confirmed bullish. Let's see how it goes in the coming months but my money is that you will be seeing much higher prices, everything is about to grow really strong.
Namaste.

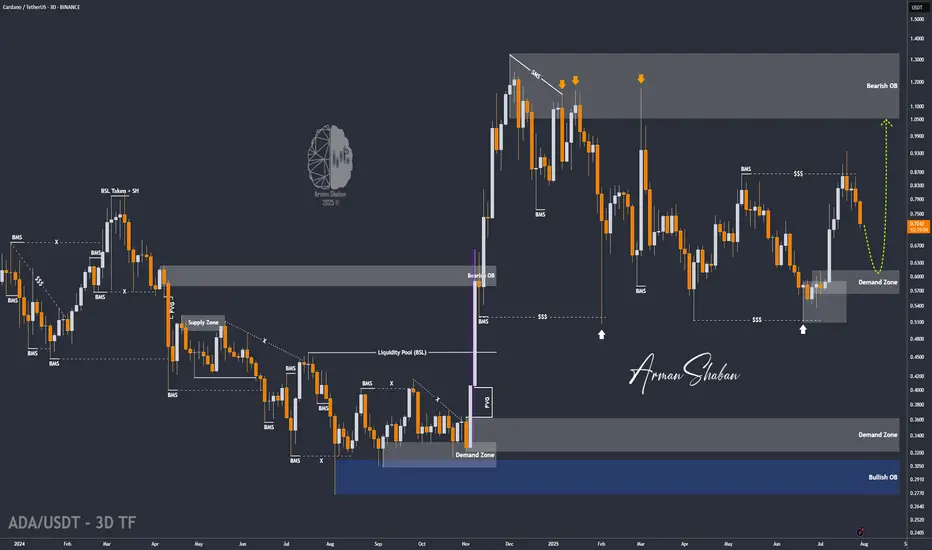
ADA/USDT | ADA Slips Below Support – Watching $0.61 for Support!By analyzing the Cardano chart on the 3-day timeframe, we can see that the price failed to hold above the $0.75 support and is currently trading around $0.72. Given the current momentum, a deeper correction for ADA seems likely. If the price fails to stabilize above $0.69, we could see a sharp drop toward the $0.61 zone. If ADA reaches this key support area, keep a close eye on it — a strong bullish reaction could lead to the next big upside move!
Please support me with your likes and comments to motivate me to share more analysis with you and share your opinion about the possible trend of this chart with me !
Best Regards , Arman Shaban