OTHERS.D 50.00% FIB CRITICAL LEVEL **Hello dear altcoin degens, HODL-ers, and traders,**
How are you doing this Saturday? I hope you’re enjoying the weekend in your own unique way!
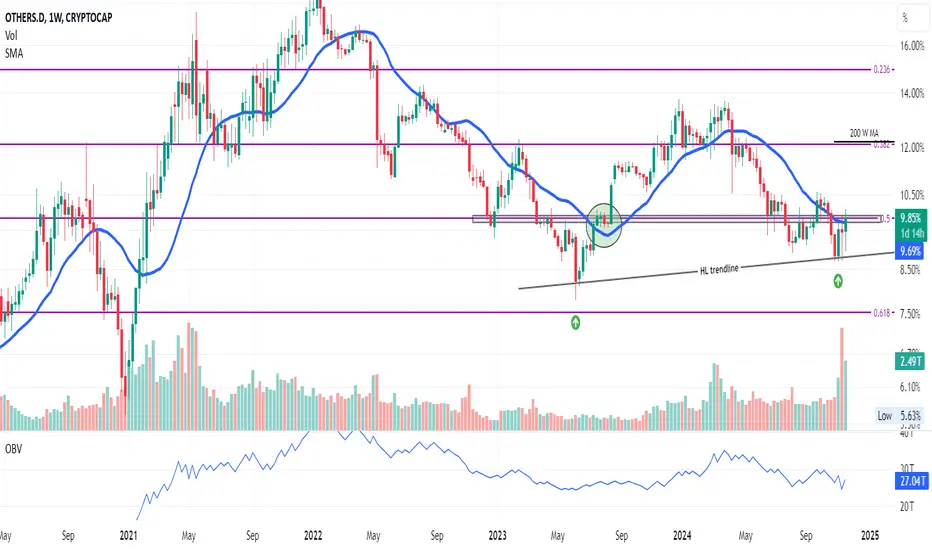
This is **OTHERS.D**, the index representing the market cap of altcoins outside the top 10. On the weekly time frame, there are several key points of interest that could help us analyze what might happen next. However, as always in trading, nothing should be taken for granted.
**Key Observations**
1. **Higher Lows Trendline:**
- We can clearly see a series of higher lows, starting with the bottom formed during the week of **June 5, 2023**, and another higher low during the week of **October 28, 2024**. This upward trendline is a promising signal for the altcoin market.
2. **The Role of the 21MA (Moving Average):**
- Historically, the 21MA has acted as a reliable support level before price moves higher, as seen between **July 17,2023** and **August 7, 2024** (highlighted with a green circle).
- Currently, the price is trading above this 21MA, which is an encouraging sign.
3. **The Critical 50% Fibonacci Level:**
- The 50% Fib retracement level has historically been significant. The green circle highlights how this level previously served as the launchpad for an upward move.
- At present, the price is trying to break through this level, which is acting as resistance.
**Combining Support Factors**
When we combine the **21MA** and the **50% Fibonacci level**, we get an area of strong support/resistance. For now, the price is attempting to break through this resistance zone.
**What’s Next?**
- If the weekly candle closes **above this critical area**, it’s a bullish signal and great news for those hunting the elusive **altseason**!
- Until then, we wait. The weekly close will provide more clarity, and based on the outcome, we can decide on the next course of action.
**Final Note**
Patience is key in this game. Stay safe, and let’s see how this plays out!
Crypto-trading

Bitcoin trend is UP - best LONG after SL hunt or Bitcoin trend is UP - best LONG after SL hunt or local consolidation
wait for it and watch full update

BRIEFING Week #46 : Beware of trend ReversalsHere's your weekly update ! Brought to you each weekend with years of track-record history..
Don't forget to hit the like/follow button if you feel like this post deserves it ;)
That's the best way to support me and help pushing this content to other users.
Kindly,
Phil

BRETT/USDT NEW ATH EXPECTINGBRETT can show a new increase trend in the coming time.
There is a possibility for a new ATH in the coming period.

$ENAUSDT going new ATHBINANCE:ENAUSDT
This coin will perform well in this cycle. A very strong team and a very good prospect to fly to the overhang.
Targets are on the chart. Adding to the portfolio.

BRIEFING Week #45 : What a FireworkHere's your weekly update ! Brought to you each weekend with years of track-record history..
Don't forget to hit the like/follow button if you feel like this post deserves it ;)
That's the best way to support me and help pushing this content to other users.
Kindly,
Phil

$BCHUSDT taked the target!BINANCE:BCHUSDT done it!
My congratulations everybody who trade this. But now its not the end.

BITCOIN Will Keep Growing! Buy!
Hello,Traders!
BITCOIN keeps growing
And we are seeing a
Strong bullish breakout
Of the key level around 74k$
Which reinforces our bullish
Bias and we will be expecting
A further move up
Buy!
Like, comment and subscribe to help us grow!
Check out other forecasts below too!

BRIEFING Week #44: Ready For a Wild Ride ?Here's your weekly update ! Brought to you each weekend with years of track-record history..
Don't forget to hit the like/follow button if you feel like this post deserves it ;)
That's the best way to support me and help pushing this content to other users.
Kindly,
Phil

$BCH ready to PUMP!BINANCE:BCHUSDT.P
Now this coin is ready to be pummeled. A good reversal from a strong support level has occurred and now is the time to get in the trade.
I think the price will move to the resistance level of $376, after which there will be a breakout and a rise to $440.
Subscribe to my reviews at the link below in the subscription.

$SOL must take 190$BINANCE:SOLUSDT.P
After a strong correction, Solana is poised to rise with the rest of the market. Earlier I wrote that a correction was needed and expected a Long earlier, but now is the time to get in the trade!
Subscribe to my reviews at the link below in the Signature.

$ETH Is This the Perfect Entry Point or a Trap?BINANCE:ETHUSDT.P
On the chart we can see that the correction I mentioned earlier is underway.
The price is now at the Fibonacci level, which could be the reversal point of this movement.
Also, the price may go a little lower to gain more volume at the support level.
After that a longing pattern will be formed. And the movement will continue towards the strong resistance level and there will be a final denouement. If the price is able to break the resistance level, we will go to take a take, if not, we will have to move the stop.
Entry data:
Entry: 2580
SL: 2468
TP: 2952

$BCH to $440BITMEX:BCHUSDT.P
I see another interesting pattern here.
We enter this trade carefully.
Entry: 375.4
SL: 361.1
TP: 440

SOL going UP!BITMEX:SOLUSDT.P
There is a good and strong pattern on solana + it has not yet performed.
We enter the trade with the following criteria:
Entry: 176.11
SL: 170.8
TP: 191

Bitcoin Breaking Higher Highs: What to Watch for NextBitcoin is currently breaking above a recent higher high, signaling potential for continued upward momentum. If it successfully surpasses this level with strong volume, it could indicate that buyers are in control and ready to push prices higher. However, it’s essential to wait for confirmation—this means letting Bitcoin close above the high to avoid a potential false breakout. By waiting for a clean break, traders can enter with more confidence, aligning with the trend and reducing risk. If this higher high holds, it may serve as new support, creating a solid foundation for the next move upward.

SEI Long Spot Trade (CHoC & Support Flip)Market Context: SEI’s recent price action is suggesting a potential reversal with a Change of Character (CHoC) confirmed by a higher high and a retest of the $0.35 resistance as support. A reclaim of the 200 EMA as support would add strength to the upward continuation outlook.
Trade Setup:
Entry: Around $0.40
Take Profit:
First target: $0.63
Second target: $0.89
Stop Loss: Daily close below $0.34
This setup is positioned to capitalize on the momentum shift, with upside targets aligning with higher levels if support holds. #SEI #Crypto #Trading

MYRO Long Spot Trade (Structure Shift & Support Flip)Market Context: MYRO has reclaimed the $0.10 level, flipping former resistance into support and signaling a structure shift to the upside. This provides a solid entry zone with a favorable risk-to-reward ratio as the setup targets mid-range and higher levels.
Trade Setup:
Entry: Around $0.11
Take Profit:
First target: $0.16
Second target: $0.22
Third target: $0.26
Stop Loss: Daily close below $0.09
This setup capitalizes on the structure shift with targets aligning with key levels. #MYRO #Crypto #Trading #SupportFlip

SOL small correction and growthBINANCE:SOLUSDT
On solana we closed the trade perfectly as soon as I noticed the selling.
Now the correction that I was talking about earlier has started.
On the chart I have marked the 168.5-170.5 zone - this is the zone we need a correction to.
Also on the chart you can see 2 levels, which can also become a reversal level.
Now we expect the movement to these trigger zones. I advise not to open any trades before that, even if it turns from the current ones.

ALPHAUSDT.PHow are you on this beautiful Friday?
I’m watching the ALPHAUSDT pair on the daily chart, and it seems bearish. Here’s why:
First, there’s an inverse hammer candle that was stopped at the black line resistance.
Second, the price has fallen back below the 200MA after a failed crossover.
One thing I don’t like is the volume from October 22. However, when switching to the 4H candles, I can see that most of the volume was on the downside, which reinforces my bearish bias.
Thanks for reading!

AVAX Up TrendBINANCE:AVAXUSDT
Parsing by subscriber request.
The coin is above a good level of interest, which can be seen in the chart.
We can see that when the price reached this level there is a good volume, which signals that there is a big buyer here, but judging by the chart there is a feeling that the bags are not full yet. Therefore, there may still be a localized decline.

AR Long Spot Trade (Low Volatility Expansion)Market Context: AR is holding above a critical level with low volatility, suggesting a potential expansion soon. This offers a good entry opportunity.
Trade Setup:
Entry: Around $18
Take Profit:
First target: $24
Second target: $30
Stop Loss: Below $16.5
This trade is positioned for potential breakout and expansion. #AR #Crypto #Trading #Volatility

WLD -pumped as we planned. Big move is COMING!WLD -pumped as we planned. Big move is COMING!
In a previous video i shared VAL as key support zone 1.8
Price did 40% from that
at this moment we need range before price will go on
