Bitcoin - time to take SL of Buyers adn SellersBitcoin - time to take SL of Buyers adn Sellers
Price reached key resistance POC of a range - i expect a pullback
key zone for long is VWAP + VAH
Crypto

Bitcoin - LONG playedout!! NEW Entry!!Bitcoin - LONG playedout!! NEW Entry!!
price bounced from VAL as we expected
now it's time to tise
follow thetrned until clear reversal

FUN Testing Red Resistance – Breakout Potential! 🚀 FUN Testing Red Resistance – Breakout Potential! 📈
FUN is currently testing the red resistance zone. If the price breaks through, the first target could be the green line level! 📊
Let’s catch this breakout together! 💼💸

BTCUSDT IDEAAt the highs on the one side and on the contrary formations seems to be a chance for breakout to capturing more upside might put a limited move but with momentum (on the upside).
Only hurdle seems to be supplies on daily TF at this price.


Is #XTZ Ready For a Major Breakout or Another Trap Ahead?Yello Paradisers! Are you prepared for what might be one of the sneakiest reversals brewing quietly on #XTZUSDT? Let's see the current setup of #Tezos:
💎#XTZ is trying to break out of a descending broadening wedge formation, a setup that typically signals the end of a corrective structure and the potential beginning of a major impulsive move. We’re likely witnessing the very first wave of this new impulse, and what happens next will depend entirely on how the price reacts to the overhead dynamic resistance.
💎The 1st impulsive wave appears to be nearing completion, and based on structure and current momentum, a minor pullback is both expected and healthy. This retracement will likely serve as a reset before the next leg higher begins, offering a potential entry for those who missed the breakout. However, we do not expect this correction to break below the origin of the first wave — doing so would undermine the integrity of the new trend.
💎Currently, the #XTZUSD is facing strong resistance from the EMA, which it must convincingly break and reclaim. This EMA level has repeatedly acted as a lid on price action, and until it’s cleared, any upside move remains tentative. However, if buyers step in with real volume, we could see a rapid acceleration toward the mid-term resistance at $0.916. That level has historically marked a shift in market control. And beyond it, the next major resistance lies at $1.134, a key supply zone that could trigger heavy distribution.
💎On the downside, the structure remains clean. The $0.491 – $0.516 zone is now our major support, and it must hold. If the price falls below this support and closes with weakness, it will invalidate the current bullish thesis and likely lead to a deeper correction.
Play it safe, respect the structure, and let the market come to you!
MyCryptoParadise
iFeel the success🌴

Bitcoin H4 | Potential bullish bounce off a pullback supportBitcoin (BTC/USD) could fall towards a pullback support and potentially bounce off this level to climb higher.
Buy entry is at 99,502.40 which is a pullback support that aligns close to the 23.6% Fibonacci retracement.
Stop loss is at 92,800.00 which is a level that lies underneath a multi-swing-low support and the 38.2% Fibonacci retracement.
Take profit is at 106,765.40 which is a multi-swing-high resistance.
High Risk Investment Warning
Trading Forex/CFDs on margin carries a high level of risk and may not be suitable for all investors. Leverage can work against you.
Stratos Markets Limited (tradu.com):
CFDs are complex instruments and come with a high risk of losing money rapidly due to leverage. 63% of retail investor accounts lose money when trading CFDs with this provider. You should consider whether you understand how CFDs work and whether you can afford to take the high risk of losing your money.
Stratos Europe Ltd (tradu.com):
CFDs are complex instruments and come with a high risk of losing money rapidly due to leverage. 63% of retail investor accounts lose money when trading CFDs with this provider. You should consider whether you understand how CFDs work and whether you can afford to take the high risk of losing your money.
Stratos Global LLC (tradu.com):
Losses can exceed deposits.
Please be advised that the information presented on TradingView is provided to Tradu (‘Company’, ‘we’) by a third-party provider (‘TFA Global Pte Ltd’). Please be reminded that you are solely responsible for the trading decisions on your account. There is a very high degree of risk involved in trading. Any information and/or content is intended entirely for research, educational and informational purposes only and does not constitute investment or consultation advice or investment strategy. The information is not tailored to the investment needs of any specific person and therefore does not involve a consideration of any of the investment objectives, financial situation or needs of any viewer that may receive it. Kindly also note that past performance is not a reliable indicator of future results. Actual results may differ materially from those anticipated in forward-looking or past performance statements. We assume no liability as to the accuracy or completeness of any of the information and/or content provided herein and the Company cannot be held responsible for any omission, mistake nor for any loss or damage including without limitation to any loss of profit which may arise from reliance on any information supplied by TFA Global Pte Ltd.
The speaker(s) is neither an employee, agent nor representative of Tradu and is therefore acting independently. The opinions given are their own, constitute general market commentary, and do not constitute the opinion or advice of Tradu or any form of personal or investment advice. Tradu neither endorses nor guarantees offerings of third-party speakers, nor is Tradu responsible for the content, veracity or opinions of third-party speakers, presenters or participants.

XAUUSD BULLISH OR BEARISH DETAILED ANALYSISXAUUSD is currently trading around 3250, consolidating within a well-defined bullish flag structure after a strong impulsive rally. This flag pattern on the 12-hour chart reflects healthy profit-taking and reaccumulation after a significant upward move. The current price action is respecting the lower boundary of the flag, and with growing volume on bullish candles, the setup suggests a high probability of a breakout to the upside, targeting the 3650 region.
From a macroeconomic perspective, gold remains in strong demand due to ongoing global uncertainties and persistent inflation concerns. The US CPI print remains sticky above 3%, keeping real yields under pressure and supporting gold's bullish bias. Furthermore, with the Fed expected to hold interest rates steady for longer, the market is starting to price in fewer rate cuts this year. This continues to undermine the USD and supports gold as a store of value. Additionally, rising central bank gold purchases and geopolitical risk premium are adding further tailwinds.
Technically, we are watching for a clean breakout above the upper flag resistance around 3280–3300. A breakout with volume confirmation would open the door toward the psychological 3400 level first, followed by a push toward the 3650 target area. Momentum indicators are turning up, and price is showing signs of basing just above previous support levels, adding confidence to the bullish continuation scenario.
Gold remains one of the strongest trending assets in 2025, and this consolidation is likely just a pause before the next leg higher. As global markets digest the impact of persistent inflation and macro volatility, precious metals like gold are likely to outperform. This flag formation provides a textbook continuation setup for traders looking to position with the broader trend.

Kaspa on Its Path to Glory (TA + Trading Plan) + UPDATETechnical Analysis for KASPA (KAS)
Current Price: 0.11268 USD
Timeframe: 4-Hour Chart
Indicators and Key Observations:
Price Action: Kaspa is currently in an ascending triangle pattern, with price action approaching the resistance line, which has been tested multiple times without a clear break. This pattern indicates the possibility of a breakout if the price moves above the resistance line.
Support Zone: The support level has been consistent, forming a base near 0.1070 USD. This is a crucial area where buying interest has been observed.
Resistance Line: The price is approaching the resistance at around 0.1130 USD. A breakout above this level could signal bullish continuation towards higher targets (potentially 0.1900 USD as indicated by the chart’s blue arrow).
Technical Indicators:
VWC Cipher B Divergences: The indicator shows bullish signals, suggesting that price might continue to rise, especially if it successfully breaks the resistance line.
RSI (Relative Strength Index): The RSI is sitting at around 52.96, indicating that the asset is neither overbought nor oversold. This gives space for potential bullish momentum.
MFI (Money Flow Index): The MFI is relatively neutral, indicating that there is no immediate imbalance between buying and selling pressure.
Stochastic Oscillator: The oscillator shows a potential bullish crossover, with the signal line moving towards the overbought zone.
Trading Plan for KASPA (KAS)
Entry Strategy:
Long Entry: Consider entering a long position once the price breaks and closes above the resistance line around 0.1130 USD. Look for confirmation through a strong green candle to ensure momentum continuation.
Target: The primary target for this trade is 0.18 USD, as indicated by the blue arrow in the chart. A second target can be placed near the psychological level of 0.20 USD, depending on market conditions and price action.
Stop-Loss Strategy:
Place the stop-loss slightly below the support zone, ideally around 0.1060-0.1070 USD, to protect against a false breakout. The stop-loss should be adjusted as the price moves in your favor to lock in profits.
Risk-Reward Ratio:
The risk-reward ratio for this trade is favorable, as the potential upside (0.18-0.20 USD) significantly outweighs the downside risk (stop-loss below 0.1070 USD). A risk-reward ratio of 2:1 or higher is ideal for entering the trade.
Volume Confirmation:
Ensure that the breakout above resistance is accompanied by an increase in volume. Low-volume breakouts can lead to false signals, so confirming the move with higher-than-average volume is crucial for a successful trade.
Risk Management:
As always, never risk more than 2% of your trading account on any single trade. Use proper position sizing and adjust your stop-loss accordingly to maintain a controlled risk profile.
Recent News - Crescendo Upgrade 🚀
Today, Kaspa has rolled out its Crescendo upgrade, which boosts the network speed to 10 blocks per second. This is a major leap in scalability, enhancing transaction speed and efficiency. The upgrade is expected to drive greater adoption and increase investor interest, potentially providing additional support for the upward momentum in the KAS market.
Kaspa (KAS) is showing signs of bullish momentum, with key technical indicators pointing to a potential breakout above resistance. The recent Crescendo upgrade adds further optimism for the coin's future prospects, making this an exciting trade to consider. Be sure to monitor price action closely and implement strict risk management strategies for optimal results.

AUDUSD BULLISH OR BEARISH DETAILED ANALYSISAUDUSD is currently trading at 0.6400 and forming a clear inverse head and shoulders pattern on the 12-hour timeframe, a well-known bullish reversal structure. The neckline breakout is nearing, and the recent price behavior shows strong bullish volume support, indicating growing confidence among buyers. With a projected target of 0.6700, this setup offers a favorable risk-to-reward ratio as we transition into a potential trend shift in favor of the Aussie.
On the fundamental front, the Australian dollar is benefiting from a more resilient macro backdrop. Recent Australian jobs data came in stronger than expected, and the RBA remains cautious on rate cuts, especially with inflation pressures still lingering. Meanwhile, US inflation remains sticky, but with the Fed leaning toward a “higher-for-longer” stance rather than aggressive tightening, the greenback has shown signs of exhaustion against risk-linked currencies like AUD.
Technically, the price has respected the 0.6350 support level and is now forming higher lows. The breakout of the neckline around 0.6450 could accelerate bullish momentum, especially if accompanied by a strong candle close and continued volume confirmation. The next resistance lies at 0.6550, with the larger structure aiming for a test of 0.6700. This aligns with broader market sentiment rotating into commodity currencies, particularly as China stimulus hopes and improving risk appetite lift AUD.
AUDUSD remains one of the more technically clean setups among the majors right now. With a bullish pattern forming, supportive fundamentals, and improving sentiment across risk assets, this is a setup that deserves close attention from traders looking to ride the next impulsive leg to the upside.

BTC Approaches All-Time High — But Signs of Weakness Emerge!BTC is once again approaching its all-time high (ATH) on the daily timeframe, generating excitement across the market. However, a closer look at the lower timeframes reveals signs of potential exhaustion as BTC encounters strong resistance. This suggests a pullback could occur before any continuation higher.
On the 4-hour and 1-hour charts, BTC is currently trading within a rising channel, which is often considered a bearish continuation pattern, especially when it forms directly below a key resistance level like the ATH. Price action within this structure is starting to lose momentum, and the presence of bearish divergences and decreasing volume further supports the likelihood of a near-term correction.
Where Could We Buy the Dip?
A pullback may offer a strategic entry opportunity for traders looking to ride the next leg up. Notably, two fair value gaps (FVGs) were created during the recent upward move. The first FVG could provide a minor bounce, but the second one is more compelling for a higher-probability long setup.
This second FVG aligns with a well-established support zone and coincides with the Golden Pocket of the Fibonacci retracement (between the 0.618 and 0.65 levels). This confluence of technical factors makes it a strong area of interest for bulls, and a potential springboard for price to retest, and possibly break, the ATH.
In summary, while BTC is showing strength on the higher timeframes, lower timeframe patterns suggest that a healthy correction is likely. Patience and proper level selection will be key. Watching how price reacts around the second FVG and the Golden Pocket zone may present one of the best opportunities for re-entry.
-------------------------------
Thanks for your support.
- Make sure to follow me so you don't miss out on the next analysis!
- Drop a like and leave a comment!
PEPE/USDT Potential UpsdesHey Traders, in today's trading session we are monitoring PEPE/USDT for a buying opportunity around 0.00001260 zone, PEPE/USDT is trading in an uptrend and currently is in a correction phase in which it is approaching the trend at 0.00001260 support and resistance area.
Trade safe, Joe.

DOTUSDT Potential UpsidesHey Traders, in today's trading session we are monitoring DOTUSDT for a buying opportunity around 5.030 zone, DOTUSDT is trading in an uptrend and currenty is in a correction phase in which it is approaching the trend at 5.030 support and resistance area.
Trade safe, Joe.

BTC at Key Inflection Zone – Breakout or Rejection Ahead?Asset: BTC/USD
Timeframe: 4H or Daily (based on visual pattern structure)
As of: May 6, 2025
Indicators:
50 EMA (Red): $91,615.79
200 EMA (Blue): $89,305.75
Key Technical Zones:
🔴 Resistance Zone: ~$104,000 – $108,000
This area has historically acted as a major supply zone.
Price has been rejected from this level multiple times, indicating strong selling pressure.
🔁 Flip Zone (Resistance turned Support/Support turned Resistance): ~$95,500 – $100,000
The current price ($95,234.23) is testing this zone from below.
A confirmed break and hold above could signal continuation toward the higher resistance.
🟢 Strong Support Zone: ~$88,000 – $91,000
Confluence of 50 EMA and 200 EMA adds strength to this demand zone.
Previous breakout level and accumulation area.
EMA Outlook:
50 EMA > 200 EMA: Short-term bullish crossover is active, indicating bullish momentum.
Both EMAs are sloping upward slightly, suggesting trend strengthening.
Price is currently above both EMAs, which acts as dynamic support.
Potential Scenarios:
✅ Bullish Scenario:
If price reclaims the $95,500–$100,000 resistance-turned-support zone:
Expect upward momentum to continue.
Target: $104,000–$108,000 zone.
Break of $108K could lead to a macro bull continuation.
⚠️ Bearish Scenario:
If price rejects the current zone and fails to hold above the $91,000 support:
Look for retest of $88,000–$89,000 area (confluence with EMAs).
Breakdown below that zone would invalidate bullish structure and signal potential deeper correction.
Summary:
Bias: Bullish above $91K, Neutral between FWB:88K –$91K, Bearish below $88K.
Key Confirmation Needed: Daily close above $100,000 for strong bullish continuation.
Risk Management: Watch for fakeouts within the $95K–$100K range due to past volatility.

$COIN is FLYING! 33% UpsideNASDAQ:COIN Trade Alert 🚨
🎯$240🎯$286 (MM)
- Inverse H&S Breakout ✅
- Massive Volume GAP ✅
- Bullish H5 Indicator ✅
- Crypto flying ✅
Not financial advice

CRV Head and Shoulders Pattern Formed – Breakout Confirmed🚨 CRV Head and Shoulders Pattern Formed – Breakout Confirmed 📉
CRV has formed a head and shoulders pattern and has already broken out of the neckline. This could signal the start of a potential downtrend, with further downside ahead. 📊
Let’s monitor this downtrend together! 💼💸

BTCUSD – Multi-TF Bearish SFP & Fib Retrace Before ATH Rebound
Bearish SFP printed on 4H / 8H / 12H / 1D at $103 345 – $104 985 after a parabolic ~$94 k → $104 k run and multiple rejections at $104 k–$106 k resistance.
Trump tariff-cut announcement sparked a sharp spike into resistance that was quickly sold off, confirming heavy supply at $104 k – $106 k.
Baseline plan: drop to 0.786 Fib ~$102 586, then 0.618 Fib ~$100 613, before a push toward the ATH ~$109 588.
Trade Setups
Short – SFP Breakdown
Trigger: 4H close below $103 345
Entry: ≈ $103 300 on retest
SL: $105 500 (above swing high)
TP1: 0.786 Fib ≈ $102 586 RR ≈ 0.7
TP2: 0.618 Fib ≈ $100 613 RR ≈ 2.6
Long – Fib Rebound
Trigger: Bullish reversal at 0.618 Fib / FVG cluster ≈ $100 613
SL: $99 300 (below FVG)
TP1: SFP top / range high ≈ $104 145 RR ≈ 2.7
TP2: ATH ≈ $109 588 RR ≈ 6.8

Trade Idea: BTCUSD Long ( BUY LIMIT )1. Trade Direction: Long
• Trend Alignment:
• Daily: Strong uptrend resumption with higher highs, higher lows, and price reclaiming above key moving average. RSI > 70 indicates strong momentum.
• 15-Min: Bullish breakout from consolidation, steep EMA slope, MACD rising, momentum increasing.
• 3-Min: Intraday momentum continuation pattern. Clean bullish price structure.
• MACD (All Timeframes): Strong bullish crossover, rising histogram — confirming trend strength.
• RSI (All Timeframes): RSI not yet overextended on lower timeframes, suggesting room for more upside.
• Price Action: Recent breakout with healthy retracement structure and no major bearish divergence.
• Fundamentals (Contextual):
• BTC crossing $100K is a psychological milestone likely to invite more inflows.
• Macro environment remains supportive for digital assets (inflation hedge, fiat debasement narrative).
• Strong market sentiment and volume suggest continuation potential.
⸻
2. Trade Setup
Entry:
• Entry Zone: $102,800
• Price is consolidating above previous resistance (~$102,000), now acting as support.
Stop Loss:
• SL: $101,200
• Below most recent intraday swing low and EMA on lower timeframes, giving it enough room.
Take Profit:
• TP: $106,800
• Near the next psychological level and extension target from recent measured moves.
FUSIONMARKETS:BTCUSD

Notcoin Targets, 1,249% Potential & Long-Term Hold StrategyI was right! Does it makes me an evil person for saying it?
Is this an evil act?
Whatever your answer, that is just your opinion.
The truth is that stating the truth only helps us move forward more easily, more smoothly because now you can trust.
I was right, the retrace after the 1-May rejection ended in a higher low.
I was right, the higher low produced a bullish continuation and the "final resistance" we've been tracking broke.
I was right and this is nice, because Notcoin is now full green, above resistance and ready to continue rising for weeks and months.
You were right, because you liked this articled, you bought and waited.
Waiting is part of the game.
Patience is key and we will have to continue practicing patience because the top is far away. The shakeout (higher low) we saw recently is nothing compared to what we will experience in the near future. You need to be prepared. Prepared to hold strong because we want the top, high profits and maximum growth.
Notcoin is ready now to continue rising, the third wave is now developing for the present bullish impulse. We are aiming first for a target of $0.007063 for a nice 125%, but this is not all, we expect higher prices. The main target for this advance is a lovely $0.015 for a nice 406%.
It can go higher. There is strong resistance at $0.0247 for 686%. This can all be accomplished within 3-4 months.
If the bull market is a strong one, as we know it is based Bitcoin's price action, NOTUSDT can produce even more growth.
A very strong target is now set at $0.042 for more than 1,249% potential for profits... It can go higher. There is no limit to the upside, there is no limit to how far Notcoin can grow.
Prepare to hold long-term.
The longer you wait, the better it gets.
Namaste.

XRP Next Target, How To Approach The Targets, Resistance TradingThe action never happens in just one go it happens step by step. The next advance is confirmed, XRPUSDT today resumes growing (bullish continuation).
The first target is a very easy target but there can still be a stop at this level. This target sits at $3.01 and remains within a lower high compared 16-January 2025. This would be the "easy target" for this current advance.
The main target 2-6 weeks in is $4.50. But there will definitely be some resistance around $3.40. This level was challenged only once and a strong correction followed. This means that on the way up XRPUSDT will make a pause and likely produce several attempts before breaking higher. This is good for two reasons:
1) The pause will give us time to open new positions and adapt to market conditions.
2) We know the $3.40 resistance will break beforehand so we can prepare and act accordingly. So it is a huge advantage knowing that this resistance level is strong.
The question mark though is how long it takes for the resistance to break. It doesn't matter. What matters is the right entry, later on the market can take as long as it wants to reach our targets. It is all good as long as it grows; all is well that ends well.
Everything is easy now because the bullish bias is fully confirmed. Before the recovery and breakout, we would have to make predictions and guess, doubt was still in the air. Currently, we simply buy and hold, we know that any retraces or corrections are just temporary and will always end up resulting in additional growth, for this reason, when prices move down we take it as an opportunity to rebuy and reload.
A portion should be sold each time a resistance level is hit. The market will always give time to buy back lower. This should only be done by those with experience and only when the resistance level is strong. Weak resistance levels should be ignored because the trading pairs can move straight up when challenging those.
We are ready, we are live —Crypto is going up.
The 2025 bull market is here. Wait until late May and see how positive-crazy everything will become. It will be the equivalent of a mini bull run, and it will continue go, on and on and on... It will seen like it has been going forever so much that we will become complacent at some point. When we become complacent and start counting our paper profits, the market will drop. But we know beforehand that this drop will end as a higher low followed by additional growth. Buy and hold.
Thanks a lot for your continued support.
Namaste.

S/USDT Potential UpsidesHey Traders, in today's trading session we are monitoring S/USDT for a buying opportunity around 0.5850 zone, S/USDT is trading in an uptrend and currently is in a correction phase in which it is approaching the trend at 0.5850 support and resistance area.
Trade safe, Joe.

OFFICIAL TRUMP Targets: $50—264%, $121—764%, $192—1,271% &..."Patience is key" has been a valuable and valid tool in the past few weeks. TRUMPUSDT has been consolidating above support and nothing more is needed other than patience to win.
Today we are going to be looking at multiple targets, long-term and short-term. All the targets that are likely to hit in this upcoming bullish cycle.
$TRUMP is growing and will continue to grow. It is normal to see some consolidation before a major move. In fact, the consolidation phase (sideways) is what makes a strong bullish impulse possible. The first wave is in.
A bullish impulse consist of 5 waves. Three waves forward, advances, and two waves backward, corrections. The third wave tends to be the biggest wave based on size and volume but it can happen that the fifth wave ends up being the biggest one.
TRUMPUSDT is about to enter its third wave based on Elliott Wave Theory. The third wave would easily cut through $34 as a resistance level and continue higher to reach $51. This $51 target gives a nice 264% but this is easy. Additional growth can happen within months and TRUMPUSDT can hit $121 for a total of 764%.
The fourth wave is a correction. Seeing that the second wave was very small and short, the fourth wave can be long in size and duration. After this wave comes the final wave which is the speculative wave. In this wave, Wave 5, anything goes.
TRUMPUSDT can continue growing through late 2025 and reach major new All-Time Highs. A $148 target can be easy if $121 is reached within the third wave. A strong peak price for the fifth wave would be $192 for a huge 1,271%. With a strong blow-off top, a $263 target can close the cycle with an astonishing 1,778%. Of course, it can go higher on a wick based on the weekly or monthly timeframes. Surely, this is a new trading pair with no historical data, growth can definitely go beyond the chart.
These targets are based on Elliott Wave Theory and Fibonacci proportions, they can work as a map to help us navigate future price action as the bull market develops.
Thanks a lot for your continued support.
Namaste.

$5,792 Is The Easy Target, Ethereum At $8,519-$11,246 In 2025Ethereum's All-Time High happened November 2021 and sits around $4,868. While Bitcoin went to produce several new All-Time Highs in 2024 and 2025, Ethereum peaked with a triple-top around $4,100. Everything is about to change.
Ethereum (ETHUSDT) is now on its four consecutive green week with rising—high—volume. The next main target within the current bullish wave sits at $5,792, this is an easy target.
Ethereum did not hit a new ATH in 2024 but it is about to make a comeback with a vengeance. Ethereum will grow so strongly that many people will just not be able to understand what is actually happening, the signals are in.
Between March and May we have a classic stop-loss hunt event. It all started in February 2025 when ETHUSDT tested its August 2024 low and support. This level was tested twice and finally broke. The breakdown produced a classic rounded bottom and now the action is back in the bullish zone.
It is as if nothing really happened, a strong market shakeout. A long-term trader could have easily be on vacation while this event took place. When coming back, he would notice on 12-May the prices being in the same buy zone as in August-November 2024. Knowing that this buy zone led to a bullish impulse, which ended with a rejection and triple-top, he would know that the market was gathering strength before another challenge of resistance. This resistance around $4,100 will break easily this time on the way up.
Since ~$5,800 is an easy target, we can expect even higher prices in the coming months, specially the later part of 2025 when the bull market bull run will be in full force. $8,500 is possible and even higher with a blow-off top reaching $11,000 or $13,000 to end the bull market phase.
This is how things are looking now. We will adapt accordingly if market conditions change.
How far up Ethereum can go is anybody's guess, what cannot be doubted is the fact that it is going up; Crypto is going up; Bitcoin is going up more than 100%.
Thank you for reading.
Namaste.

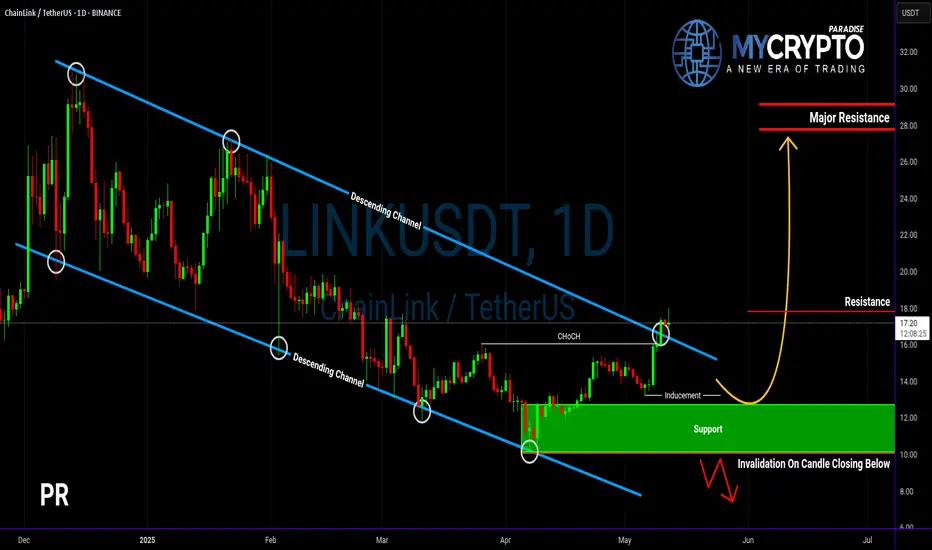
Will LINKUSDT Explode Soon — or Collapse Into a Trap?Yello Paradisers, are you prepared for the next big LINK move? The breakout you’ve been waiting for just happened — but before you jump in, let’s break down what’s really going on behind the chart.
💎LINKUSDT has officially broken out of its descending channel — a significant structural shift that immediately increases the probability of a bullish continuation. On top of that, we’ve seen a bullish CHoCH (Change of Character), a powerful sign that demand is stepping in. These are early but critical signs that bulls may be regaining control.
💎However, experienced traders know not to act on the first sign of strength alone. We now need to see how price behaves on the pullback. If LINK pulls back and takes out the inducement (removing weak hands), we’ll be looking for a bullish internal CHoCH (I-CHoCH) on the 1H timeframe. If that forms, the probability of a solid bounce from the support zone becomes extremely high — giving us the confirmation we need to position for upside.
💎On the other hand, if price breaks down and closes a candle below the support zone, this entire bullish setup becomes invalid. In that case, it would be wise to remain patient and wait for better, more reliable price action to develop before making any move. This is exactly where most traders lose by forcing trades instead of waiting for clear signals.
🎖A big liquidation event, which will first take both longs and shorts and fully get rid of all inexperienced traders before the real move happens, is very close to happening again. so make sure you are playing it safe Paradisers. It will be a huge money-maker for some and a total disaster again for the majority.
MyCryptoParadise
iFeel the success🌴