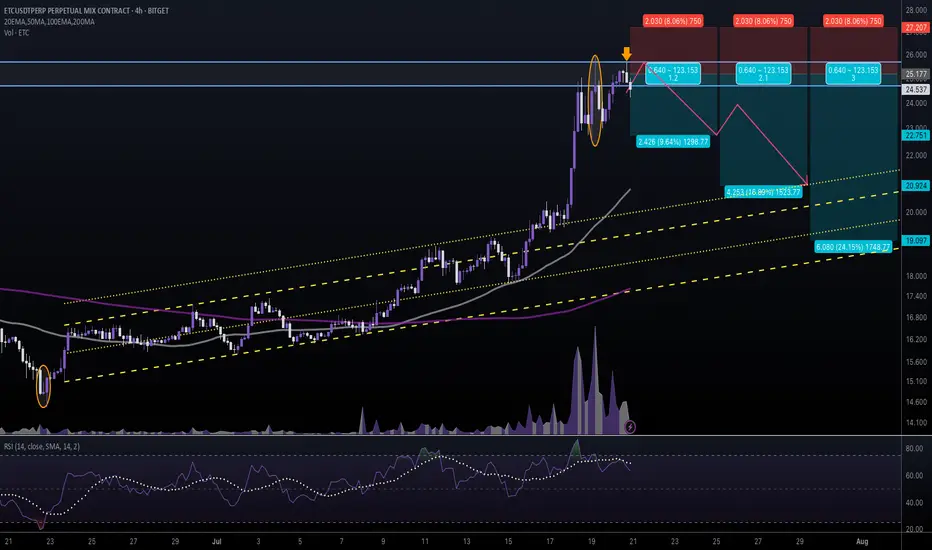
#ETCUSDT #4h (Bitget Futures) Ascending channel retestEthereum Classic printed two evening stars in a row, looks locally topped and ready for correction towards 50MA & 200MA supports.
⚡️⚡️ #ETC/USDT ⚡️⚡️
Exchanges: Bitget Futures
Signal Type: Regular (Short)
Leverage: Isolated (5.0X)
Amount: 5.0%
Entry Zone:
24.679 - 25.675
Take-Profit Targets:
1) 22.751
2) 20.924
3) 19.097
Stop Targets:
1) 27.207
Published By: @Zblaba
CRYPTOCAP:ETC BITGET:ETCUSDT.P #4h #EthereumClassic #PoW #L1 ethereumclassic.org
Risk/Reward= 1:1.2 | 1:2.1 | 1:3.0
Expected Profit= +48.2% | +84.5% | +120.7%
Possible Loss= -40.3%
Estimated Gaintime= 1-2 weeks
Crypto
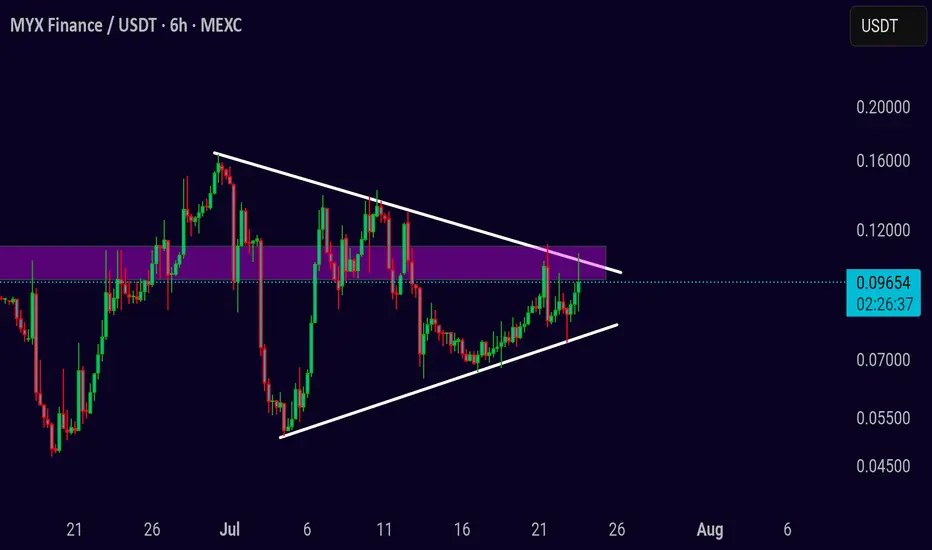
MYX/USDT Tightening Range – Big Move Loading
Pair: MYX/USDT
Timeframe: 6H
Structure: Symmetrical consolidation and breakout watch
MYX has been consolidating within a tightening structure, forming higher lows while repeatedly testing the descending resistance line. Price is now trading near the upper boundary and within a key supply zone, suggesting that a decisive move could be close.
Bullish case:
A confirmed breakout above 0.1100 with strong volume could trigger a continuation move to the upside. If that happens, the next targets to watch are 0.1400 and 0.1800. Look for a retest of the breakout level for a safer entry.
Bearish case:
If MYX fails to sustain above 0.1100 and breaks down below 0.0850, sellers may take control, with potential downside targets around 0.0750 and 0.0650.
Price is approaching a decision point. Monitor volume closely and wait for a clean breakout confirmation before entering a position. Set alerts and stay prepared for either direction.
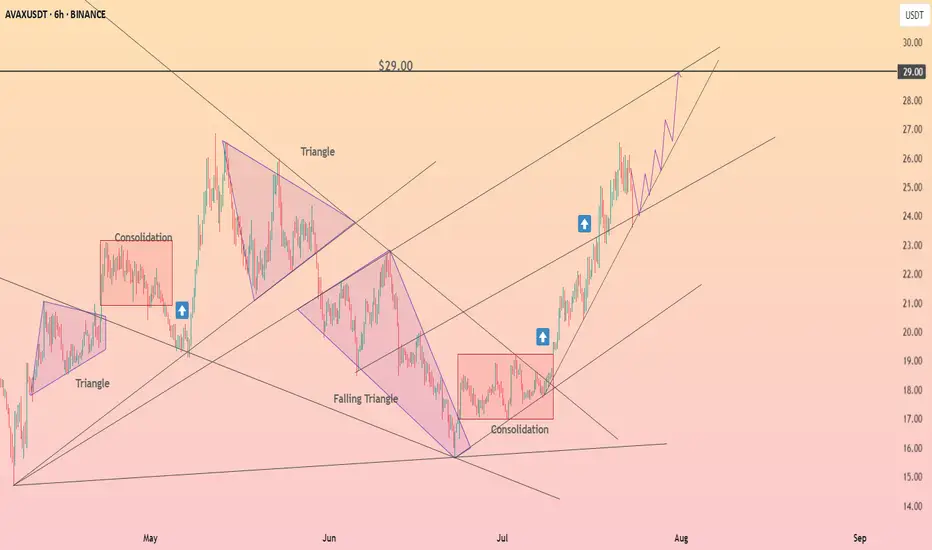
Avalanche corrected from resistance ┆ HolderStatBINANCE:AVAXUSDT broke below $27.6 and is testing $25.9. Breakdown may open $24.5. Bears remain in control.
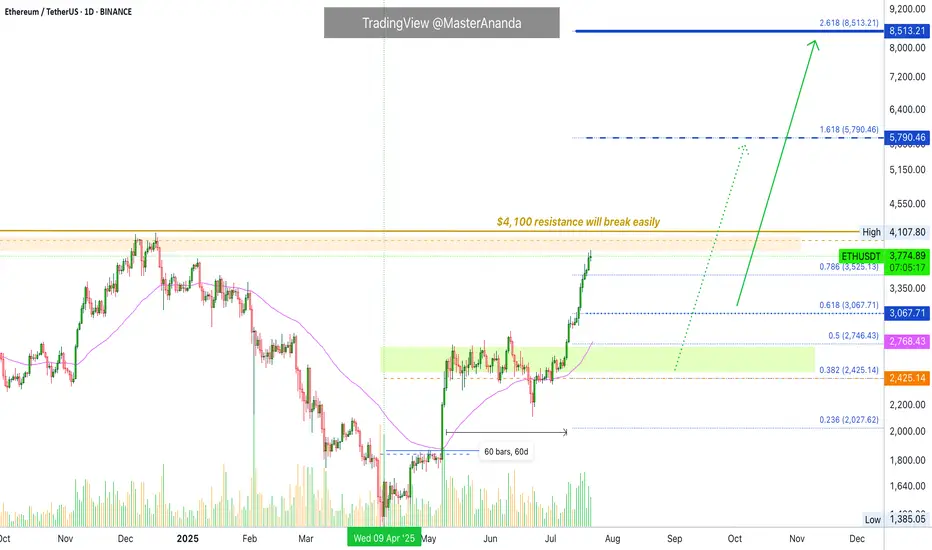
Ethereum Update · Minor Break Below $4,000, Nothing ChangesOk. Straight up has been confirmed but as you already know, the market never moves straight down neither straight up. It seems Ethereum is about to take a small break. This shouldn't alarm you nor be a concern, we are set for sustained long-term growth. When bullish momentum dies down, the market tends to take a break, a pause, before additional growth.
Please remember that these breaks are very tricky, they can last just a few days, say 3-6 days, just as they can go for weeks. It is very hard to predict. In fact, we don't try to predict the duration of those, we simply focus on the bigger picture and know that a new all-time high will be hit in the coming months. This new all-time high will be followed by additional growth.
The short-term can be tricky though. Ethereum will continue rising, but watch out, it can make a pause and this time can be used wisely to profit beautifully from smaller altcoins. Don't let your capital just sit around when it can grow.
Ethereum is awesome but it is also a giant. The smaller altcoins is where the true opportunities lie. The opportunity to quadruple in a matter of months. And this process can be repeated several times for the duration of the bullish cycle.
Namaste.
Hyperliquid is retesting the $44 level ┆ HolderStatKUCOIN:HYPEUSDT has flipped $0.074 into support. Holding this level could trigger a move to $0.088. Structure favors bulls.
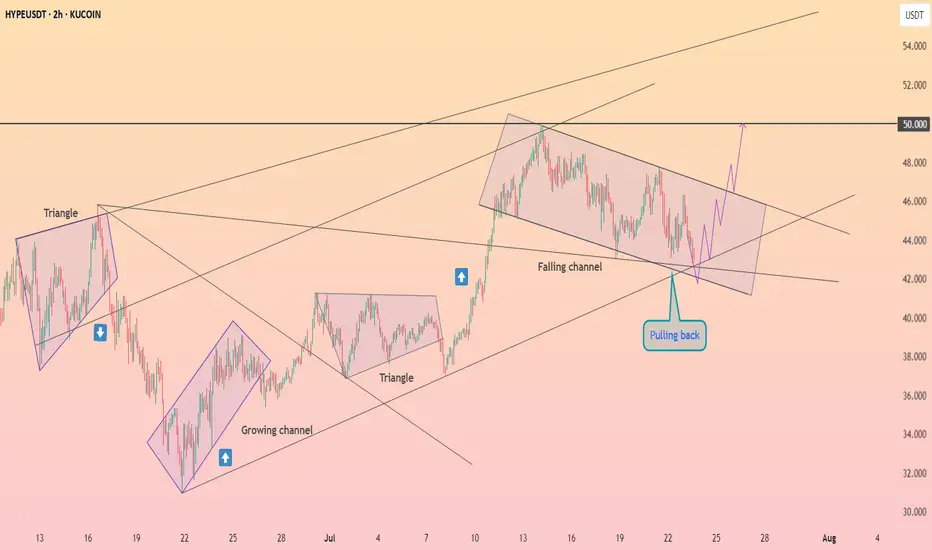
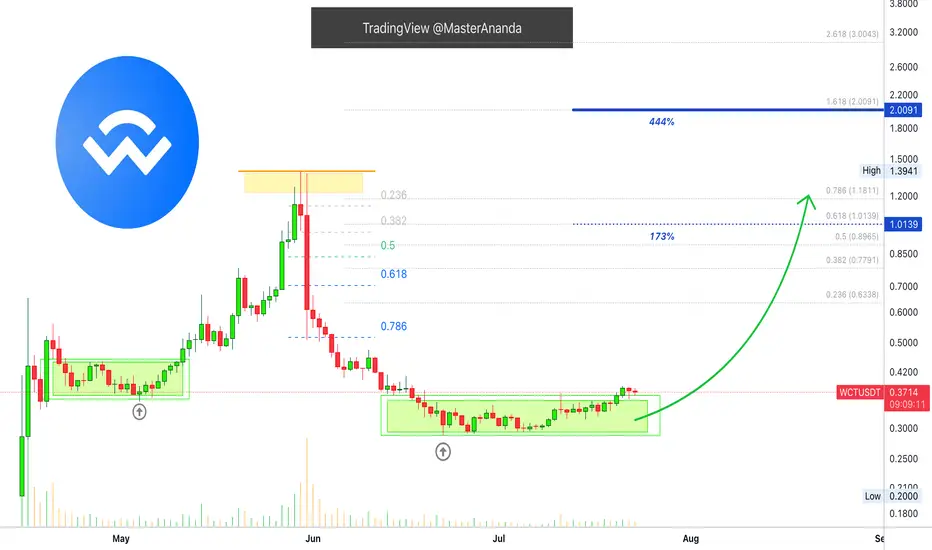
WalletConnect Reaches Support · Simple Signals · Simple StrategyI had to update this chart. It took longer than usual to move and this is always the case. Whenever we plan for 3 days we end up having to wait 10 days. If we plan to wait patiently for two weeks then the wait lasts six weeks and so on. Just be prepared to hold long-term and this can yield better results. No time, just get in when prices are low and hold. This works better.
WalletConnect finally bottomed 22-June and has been recovering slowly. This slow and steady recovery is always a signal of strength and tends to lead to a strong bullish breakout. When you see slowly rising prices for weeks or sometimes even months you know what the outcome will be, a major bullish breakout.
So we buy the support and wait, when the breakout comes, enjoy the profits.
Thank you for reading.
Namaste.
ETH - Altseason ??ETH has rallied sharply and is now entering the major resistance zone between $3,725 and $4,081, which has repeatedly acted as a local top during previous cycles.
This red zone represents a high-supply area, and historically ETH has struggled to break and hold above it without a significant catalyst.
Rejection here could lead to a pullback toward the $2,300–$2,000 range.
A clean breakout and weekly close above $4,081 would flip this resistance into support and open the path toward the all-time high (ATH) at $4,868.
If ETH reclaims this red zone and flips it to support, it will act as a major trigger for a broad Altseason.
Historically, such ETH strength is a key confirmation that capital is rotating from BTC into the altcoin market.
Currently, momentum is favoring bulls unless this red supply zone causes a strong rejection.

ZRX Just Broke Out… But Is It a Bull Trap Before a Collapse?Yello Paradisers did you catch that breakout from the falling wedge, or are you about to get faked out like the rest?
💎#ZRX/USDT has finally broken out of its descending resistance after weeks of compression. While this is a promising signal, this move alone is not enough. What really matters now is how price behaves on the retest. We're watching closely for a pullback either into the previous wedge resistance or directly into the key demand zone between $0.205 and $0.215. That area needs to hold if the bulls want to keep momentum on their side.
💎The structure remains valid as long as we stay above the $0.180 level. A break below that zone would completely invalidate this bullish setup and open the door to a deeper drop. On the upside, if buyers step in with volume, the path toward $0.260 and possibly $0.300 becomes much more realistic.
💎This is not the moment to chase. Let retail traders jump in too early our job is to position smartly, not emotionally. Watch the retest, measure the reaction, and act only when the market confirms.
This is where most retail traders get trapped, they chase the move too late or panic-sell too early. Don’t be that trader. Stay focused. Be precise.
MyCryptoParadise
iFeel the success🌴

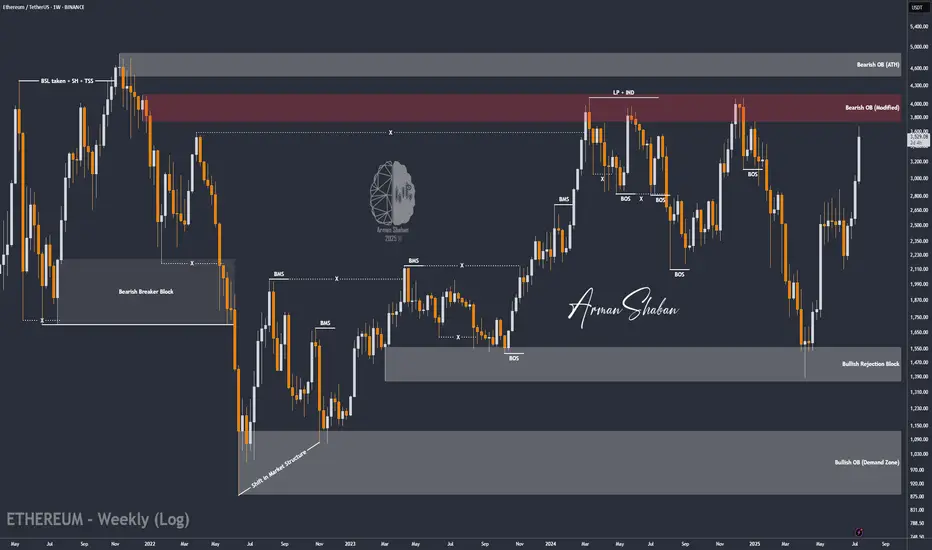
ETH/USDT | The Next Target is $4000 and it's Close! (READ)By analyzing the Ethereum chart on the weekly timeframe, we can see that this cryptocurrency remains one of the strongest major cryptos in the market, continuing its bullish rally despite the overall market correction. It has already hit the next target at $3500, and I believe we might see Ethereum reaching $4000 sooner than expected! Based on previous analyses, if this bullish momentum continues, the next targets will be $3740, $4100, and $4470.
Please support me with your likes and comments to motivate me to share more analysis with you and share your opinion about the possible trend of this chart with me !
Best Regards , Arman Shaban
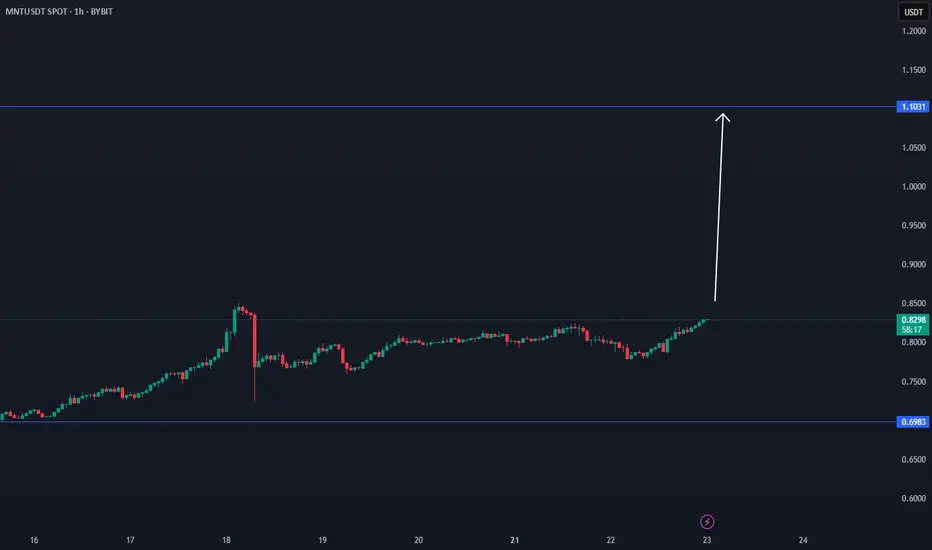
MNT TIME FRAME BREAKMNT has a good chance to break in the coming hours, depending last data.
$1.10 is an important target. 32% increase possibility.
Coin has acctive volume.
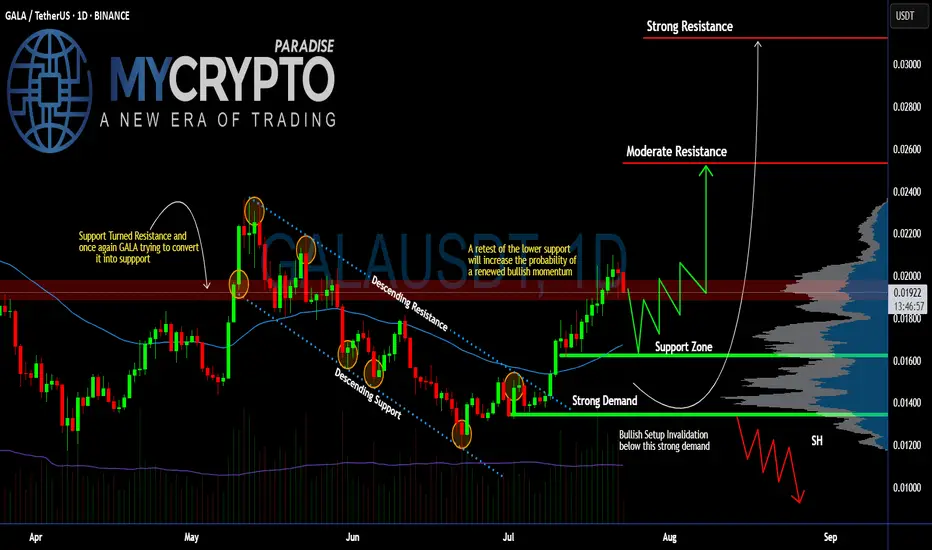
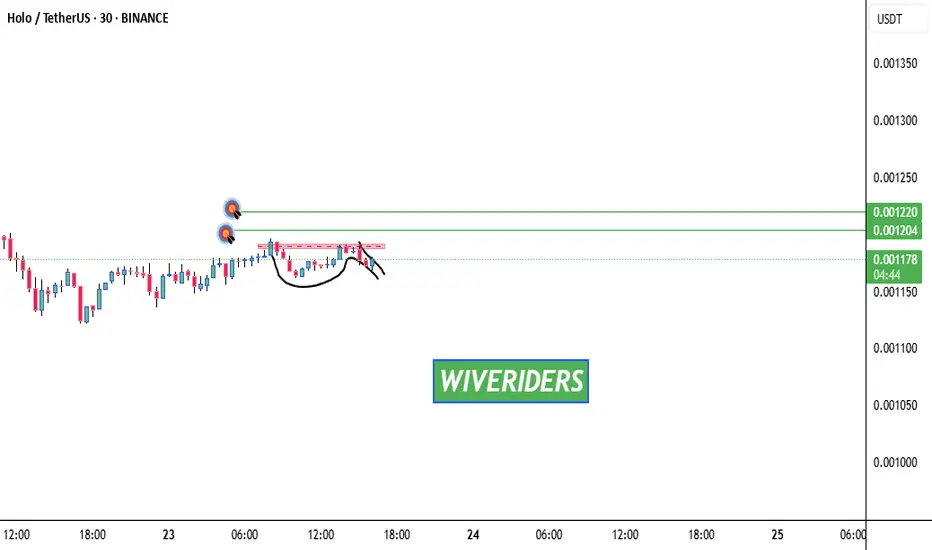
Can #GALA Sustain the Current Bullish Momentum or Will it Fall?Yello, Paradisers! Is this #GALA pullback just a healthy retest before another explosive rally, or are we about to see a deeper drop that will wipe out impatient bulls? Let’s break it down:
💎After weeks of trading inside a descending channel, #GALAUSDT finally broke above the descending resistance, sparking renewed bullish momentum. The breakout has pushed the price toward the $0.020 zone, but now #GALA has encountered a resistance zone (previously support). The question remains: will GALA maintain this level or revisit lower supports before proceeding higher?
💎The current structure shows #GALAUSD attempting to convert its previous resistance into new support around $0.018–$0.020. A clean retest of this support zone would significantly increase the probability of a sustained bullish continuation. The 50EMA acting as support and positive macro trend in crypto market reinforces our bullish bias.
💎If buyers remain in control, the first upside target is the moderate resistance at $0.0253. However, the major profit-taking and strong selling pressure are expected near the $0.0312 zone, where the strongest resistance lies. A successful break and hold above this level would confirm a more aggressive bullish trend.
💎On the flip side, the bullish setup becomes invalid if #GALA loses the strong demand zone at $0.0162–$0.0134. A confirmed close below $0.0134 would flip the structure bearish and open the door for another leg down.
Stay patient, Paradisers. Let the breakout confirm, and only then do we strike with conviction.
MyCryptoParadise
iFeel the success🌴
GOLD - Strong Trendline & Golden Pocket ContinuationMarket Context
Gold is currently trading within a rising wedge structure on the 4-hour timeframe. This formation typically represents a tightening market, where buyers continue to push higher — but with decreasing momentum. The confluence of both trendlines and repeated Golden Pocket bounces makes this setup technically rich and worth watching closely.
Golden Pocket & Trendline Confluence
Throughout the recent move up, price has consistently reacted to the 0.618–0.65 Fibonacci retracement zone — often referred to as the Golden Pocket. Each major retracement has found support not only at this zone but also at a rising trendline, showing strong alignment between horizontal and diagonal demand. This dual-layer support has repeatedly led to sharp rebounds, reinforcing the bullish structure.
What Comes Next?
Price is currently sitting just below the upper resistance of the wedge. If history repeats, a retracement toward the lower trendline could be the next logical step. A reaction in the same region — where the Golden Pocket once again overlaps the trendline — could offer a high-probability long opportunity for continuation toward the top of the wedge or even a breakout.
Alternatively, if price breaks below the trendline with conviction, it could signal exhaustion in the current structure, potentially flipping the bias toward a broader correction.
Final Thoughts
This is a textbook example of how technical confluence can guide trade planning — especially in clean, trending environments like this. Remember: patience is key. Let the market come to your levels.
If you enjoyed this breakdown, a like would go a long way — and feel free to share your thoughts or ideas in the comments below!

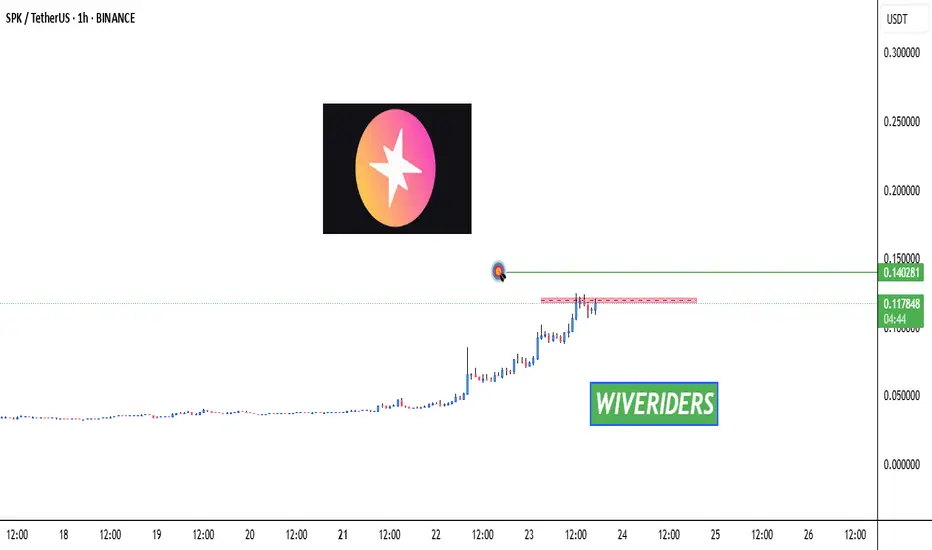
SPK Testing Red Resistance Zone 🚨 INDEX:SPK Testing Red Resistance Zone 🔴📈
INDEX:SPK is now testing the red resistance zone.
📊 Watch for breakout confirmation — if successful:
🎯 First Target → Green line level
This could signal the beginning of a new move up if buyers push through the resistance.
Let’s track it closely for a potential entry! 💼📈
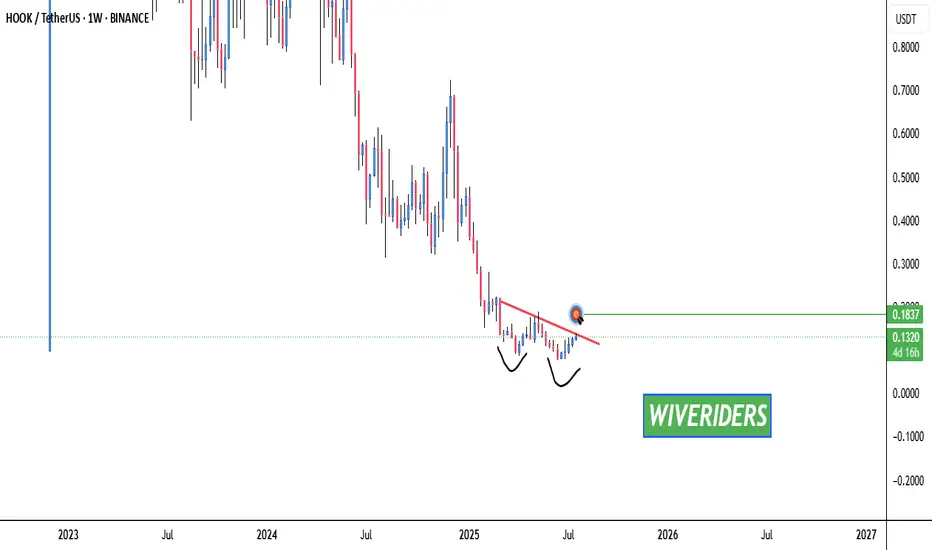
HOOK Testing Red Resistance & Forming Double Bottom🚨 HOOK Testing Red Resistance & Forming Double Bottom 🔴📈
HOOK is currently testing the red resistance trendline and has formed a bullish double bottom pattern, which could indicate a potential reversal.
🎯 If breakout is confirmed:
✅ First Target – Green line level
📊 A confirmed breakout of both the resistance trendline and the double bottom structure could signal strong bullish momentum.
Watch for confirmation before entering! 💼💸
People don't like the truth! Let's be honest, people don't like honesty. They prefer ideas that affirm their own beliefs.
When I read articles and posts from newer traders, it's often from a place of "all in" diamond hands and the notion that things go up forever.
I've been a trader for over 25 years now, and the game isn't about making a quick buck, it's about making money over and over again. This got me thinking, the issue is when you deal with a small account you require leverage, small timeframes and of course the "shit" or bust mindset. If you lose a thousand dollars, $10,000 even $100,000 - what does it matter? That's no different than a game of poker in Vegas.
The idea of being 80% in drawdown, is alien to me. The idea of one trade and one win is also a crazy notion.
Instead of playing with the future, there is an easier way to work. This isn't about slow and boring, it's about psychology and discipline. 10% returns on a million-dollar account isn't all that difficult. Instead of aiming for 300x returns on an alt coin (due to the account size being tiny) You can make less of a percentage gain with a larger account size.
In terms of psychology - the word " HOPE " is used, way too often, it's used when you hope a stock or the price of Bitcoin goes up, it's used when you hope the position comes back in your favour, it's used when you want your 10,000 bucks to double.
This isn't trading, it's gambling.
The truth is, it's not the winners that make you a good trader. It's the way you deal with the losses.
Once you learn proper risk management, a downtrend in a market move is a 1-2% loss coupled with a new opportunity to reverse the bias.
As a disciplined trader, the game is played differently.
Let's assume you don't have $100k spare - prop firms are a great option, OPM = other people's money.
Remove the risk and increase the leverage, all whilst trading with discipline.
The market goes through many phases, cycles and crashes.
You don't always need something as catastrophic to take place, but if you are all in on a position. You need to understand that losses can be severe and long-lasting.
When everyone sees an oasis in the desert, it's often a mirage.
You only have to look at the Japanese lesson in 1989, when the Nikkei was unstoppable-until it wasn't. For that short space in time, everyone was a day trader, housewives to taxi drivers.
Everyone's a genius in a Bull market.
Then comes the crash. The recovery time on that crash?
34-years!!!
I have covered several aspects of psychology here on TradingView;
When it comes to trading, if you are able to keep playing. It's a worthwhile game. If you are gambling, it's a game whereby the house often wins.
Right now, stocks are worth more than their earnings. Gold is up near all-time highs, crypto, indices the same.
All I am saying is if you are all in. Be careful!
Disclaimer
This idea does not constitute as financial advice. It is for educational purposes only, our principal trader has over 25 years' experience in stocks, ETF's, and Forex. Hence each trade setup might have different hold times, entry or exit conditions, and will vary from the post/idea shared here. You can use the information from this post to make your own trading plan for the instrument discussed. Trading carries a risk; a high percentage of retail traders lose money. Please keep this in mind when entering any trade. Stay safe.
Cup & Handle Formation 🚨 XETR:HOT Testing Red Resistance – Cup & Handle Formation 📈
XETR:HOT is currently testing the red resistance zone and has formed a bullish Cup & Handle pattern on the chart — a classic continuation setup.
If breakout is confirmed, potential upside:
✅ First Target: Green line level
✅ Second Target: Green line level
🕵️♂️ Wait for clear breakout confirmation before entering long.
This pattern often signals strong momentum if buyers step in.
Trade smart. Let’s monitor for the perfect entry! 💹💼
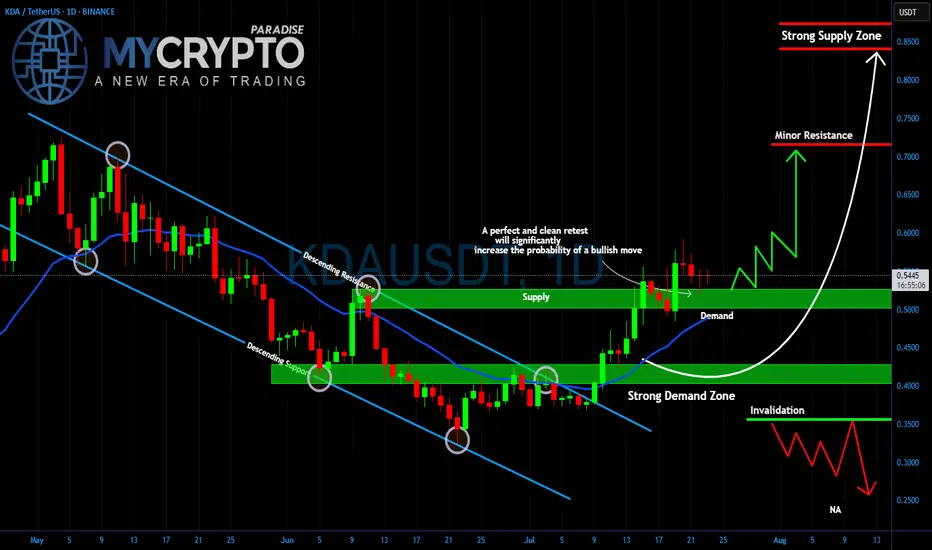
KDA Breakout or Fakeout? Critical Retest AheadYello Paradisers, is #KDA setting up for a major bullish move, or are we looking at another trap designed to wipe out impatient traders? The price has broken out of the descending channel that has been controlling the market for weeks, and now all eyes are on the retest.
💎The strong demand zone around $0.40–0.45 has been the key accumulation area for weeks, holding firmly every time the price dipped. Right now, #KDAUSDT is trading above the $0.50–0.55 demand level, which is acting as a critical support. A clean and confirmed retest of this zone would dramatically increase the probability of a bullish continuation.
💎If buyers step in aggressively, the first target will be the minor resistance at $0.70. Breaking above that could open the way for a push toward the strong supply zone at $0.85, where heavy selling pressure is expected. But if the demand fails and price drops below $0.35, this bullish scenario is invalidated, and a deeper move towards $0.25 becomes likely.
Trade smart, Paradisers. This game rewards patience and discipline, not reckless entries. Stick to your strategy, and you will stay ahead of the herd.
MyCryptoParadise
iFeel the success🌴
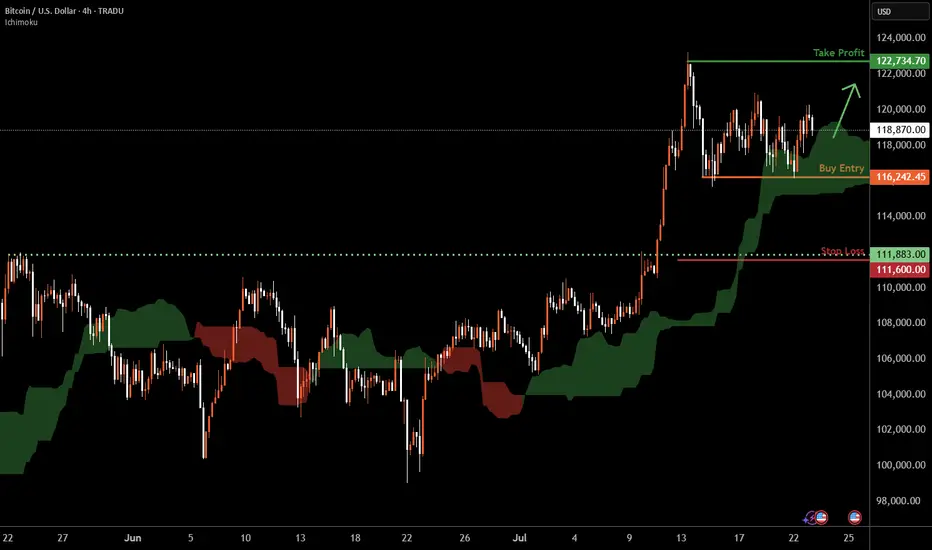
Bitcoin H4 | Crypto to remain elevated?Bitcoin (BTC/USD) is falling towards a multi-swing-low support and could potentially bounce off this level to climb higher.
Buy entry is at 116,242.45 which is a multi-swing-low support.
Stop loss is at 111,600.00 which is a level that lies underneath a pullback support.
Take profit is at 122,734.70 which is a swing-high resistance.
High Risk Investment Warning
Trading Forex/CFDs on margin carries a high level of risk and may not be suitable for all investors. Leverage can work against you.
Stratos Markets Limited (tradu.com ):
CFDs are complex instruments and come with a high risk of losing money rapidly due to leverage. 66% of retail investor accounts lose money when trading CFDs with this provider. You should consider whether you understand how CFDs work and whether you can afford to take the high risk of losing your money.
Stratos Europe Ltd (tradu.com ):
CFDs are complex instruments and come with a high risk of losing money rapidly due to leverage. 66% of retail investor accounts lose money when trading CFDs with this provider. You should consider whether you understand how CFDs work and whether you can afford to take the high risk of losing your money.
Stratos Global LLC (tradu.com ):
Losses can exceed deposits.
Please be advised that the information presented on TradingView is provided to Tradu (‘Company’, ‘we’) by a third-party provider (‘TFA Global Pte Ltd’). Please be reminded that you are solely responsible for the trading decisions on your account. There is a very high degree of risk involved in trading. Any information and/or content is intended entirely for research, educational and informational purposes only and does not constitute investment or consultation advice or investment strategy. The information is not tailored to the investment needs of any specific person and therefore does not involve a consideration of any of the investment objectives, financial situation or needs of any viewer that may receive it. Kindly also note that past performance is not a reliable indicator of future results. Actual results may differ materially from those anticipated in forward-looking or past performance statements. We assume no liability as to the accuracy or completeness of any of the information and/or content provided herein and the Company cannot be held responsible for any omission, mistake nor for any loss or damage including without limitation to any loss of profit which may arise from reliance on any information supplied by TFA Global Pte Ltd.
The speaker(s) is neither an employee, agent nor representative of Tradu and is therefore acting independently. The opinions given are their own, constitute general market commentary, and do not constitute the opinion or advice of Tradu or any form of personal or investment advice. Tradu neither endorses nor guarantees offerings of third-party speakers, nor is Tradu responsible for the content, veracity or opinions of third-party speakers, presenters or participants.
ETH/USDT – Weekly Chart Analysis !! ETH/USDT – Weekly Chart Analysis
ETH is testing a major historical resistance between $3,700 – $4,000 (highlighted green zone).
A clean breakout above this level could push price toward the next key resistance at ~$4,660.
Previous accumulation zone around $2,400 – $2,800 (yellow box) now acts as strong support.
Long-term floor at $1,420 and $1,025, though currently far below.
Bullish Breakout Potential: If ETH sustains above the green resistance, it may retest $4,660+.
A failure to break above $4K could lead to a healthy pullback toward the yellow zone (~$2,800).
Stay updated and manage your risk accordingly.
DYOR | NFA

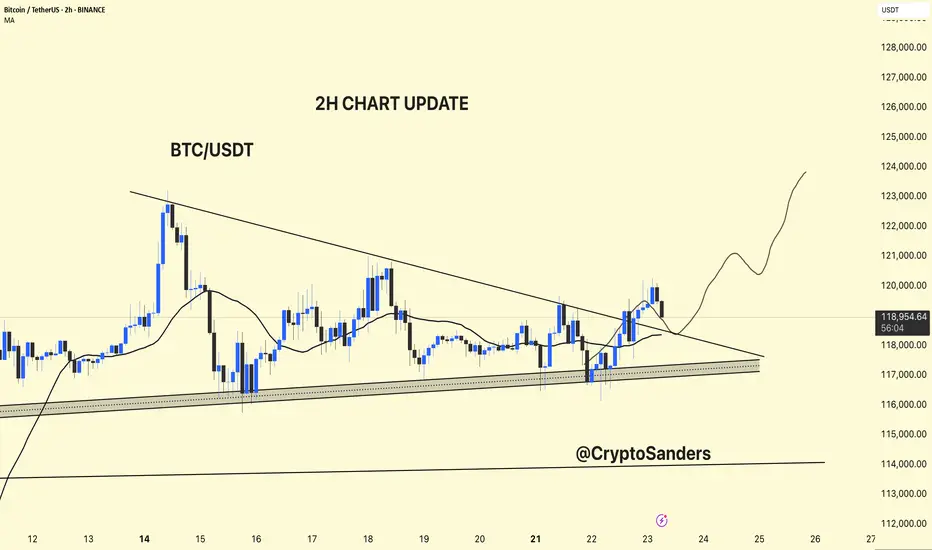
BTC/USDT – 2H Chart Update!!BTC/USDT – 2H Chart Update
Breakout Confirmed:
BTC has broken above the descending trendline but is currently facing resistance at around $ 119,500.
Support Zone:
Strong ascending support between $ 117,000 and $ 118,000 remains intact.
Moving Average:
Price is currently testing the 2H MA (~$118.3). Holding above this could confirm bullish continuation.
Outlook:
If BTC holds above $ 118,000, a move toward $ 123,000–$ 125,000 is likely.
Failure to hold may retest $117K support.
Bias: Short-term bullish unless price breaks below ascending trendline.
Thanks for your support!
DYOR. NFA
Ethereum Name Service Easy $131 Target · $208 Possible or HigherEthereum Name Service really took off in late 2023. March 2024 did nothing to this project. Here we can see an extended period of higher highs until December 2024. Many projects produced a major high in March 2024 to turn bearish until recently. In December, all of these produced a lower high. You can see how different this chart looks. This is a strong project the chart is saying.
There was a strong correction between December and April, this was a marketwide event. You can see how ENSUSDT moved below 0.786 Fib. retracement for several months just to recover. In June it remained below this level only briefly, for two weeks, and we are now full green.
Last week's candle closed above 0.618 Fib. retracement and we are back in the bullish zone. Full blown bullish as Ethereum Name Service is trading at the highest price since January 2025. Everything shows the market being ready for additional growth.
The recovery above support never supports a crash but instead a bullish continuation. For a crash, we would see a rejection or very weak action around resistance. Instead, we have full green candles with rising volume. Perfect conditions for higher prices. Just what we need and want to see.
The targets here are good, $131 and $208. I don't think this will be the end though and we have another wait and see. I think between $285 and $361 is a better prediction, these targets are also shown on the chart.
How far up do you think ENS will go?
Namaste.

Stacks · Major Flush Reveals End of Correction · New CycleStacks all-time high was hit April 2024. This ATH comes as a long-term double-top because it happened within the same November 2021 peak price range.
After a major wave there is always a correction. A correction can happen in any direction. If the trend is bearish, the correction is an up-move. If the trend is bullish, the correction is a down-move. Very simple.
The 2021 all-time high is the natural end of a major bullish cycle and thus a correction follows. The correction lasted from November 2021 until November 2022. Naturally, a major market bottom signals the start of a change of trend.
Here STXUSDT produced a bullish cycle from November 2022 until April 2024, 504 days. In April 2024 we have a new major high and this signals the start of a bearish wave. The bearish wave went from April 2024 through April 2025. The end of the down-move would signal the start of a new bullish cycle but, how do we know the down-move is over? Answer: A major market flush.
On the 12-May week there was a major market flush with a session reaching lower than the 7-April low. This is the bottom signal. It reveals itself as a bottom signal because instead of a new lower low close the week recovered and closed very high. After a higher low in June compared to April we now have four green weeks and we know what the rest of the market is doing so we can predict easily a bullish continuation; a price increase.
The size of the drop between April 2024 and May 2025 reached -92.49%. That's a huge drop. Almost all the gains from the previous 504 days bullish cycle was erased. The market has no reason nor need to move lower, for what? There is no need to dig for anything down there and that's the signal that reveals the bottom is in. Because the correction was so strong, we can expect a change of trend. We are aiming up.
Stacks major market flus in May 2025 reveals the correction is over. With the end of a strong bearish cycle confirmed, we can now expect a strong bullish cycle to develop next. If we go by past history, we can see sustained growth, it can happen for years or in the least many months.
How long will the bullish cycle last?
I don't know.
From March 2020 to November 2021 we have 630 days. The other cycle I just mentioned lasted 504 days. We can use these numbers to make some predictions but it is hard to say because market conditions are not the same.
504 days from May's low into the future gives us a date of September 2026. 630 days puts us at February 2027.
If we go by the law of alternation, we had a long cycle in 2020/2021 so this time we get a short one, say 38% or half the past bull market, this would give us 239 and 315 days. These two will give us dates between January and March 2026 for a new all-time high or cycle top.
Now, I cannot predict how long the bull market will last but I can predict that prices are going up. Since we know we will have a major rise lasting at least 6 months, the next logical step is to buy and hold. When Stacks starts trading 1,000% up, you won't care how the long bull market will last, you will just be very happy and grateful with the results.
The easy target is $6.19, but if we get an extended bull market we can go to $9.83 or even $13, or higher. It all depends on how it all develops, but we are going up. We are talking profits between 600% and 1,400% coming from current prices.
Thanks a lot for your continued support.
Namaste.

Artificial Superintelligence Alliance (FET) Enters Bullish PhaseThere is always really high volume on this chart. FETUSDT trading is very active and this is always a good signal regardless of the overall picture. It means there is interest in this trading pair. Some pairs you can see have absolutely no volume and you know only bots are trading it. When volume is high, you know there are some people buying and selling behind the scenes and when the market goes on a trend, it tends to produce wild moves. So high volume is always good.
The trend is the uptrend next. We already saw a major downtrend starting March 2024. After a low in August 2024, the classic dead-cat-bounce led to a lower high in December and then the final bottom, just two months ago. This is the correction end and bottom and from this bottom we grow. Market conditions are changing.
The bearish phase is over and it lasted more than a year. One year and one month. We are now entering a new phase and it will be a bullish cycle. How long will it last? Can the bullish cycle last just 3 months while the bearish cycle lasted 13 months? These are good eye opening questions. It shows that we might be setting ourselves up for an entire year of growth.
Actually, can be 4 months, 6 months, 8 months, 12 months or more... It doesn't matter, we are going up. Artificial Superintelligence Alliance —FET.
Namaste.
