HYPE | Hyperliquid - Swing Long IdeaHYPE | Hyperliquid - Swing Long Idea
📊 Market Sentiment
Market sentiment remains bullish, supported by expectations of a 0.25% rate cut at the upcoming FOMC meeting. The weakening USD and rising risk appetite across global markets continue to favor crypto assets.
We're currently seeing a minor retracement, primarily driven by the Nasdaq’s pullback — but the overall outlook for the crypto market remains bullish in the weeks ahead.
📈 Technical Analysis
Price broke the bullish trendline that had supported the uptrend for a while.
Following the breakout, we saw a deeper retracement that grabbed the equal lows liquidity.
This area is significant — equal lows often contain large liquidity pools, which smart money tends to target for accumulation.
📌 Game Plan
Price has already broken 4H structure again and formed a 4H demand zone.
It then retested the 4H demand zone and showed a clear rejection — confirming the setup.
🎯 Setup Trigger
I entered the trade precisely at the retest of the 4H demand zone: $38.316
📋 Trade Management
Stoploss: $35.46
Targets:
TP1: $44.80
TP2: $50.00
I will trail my stop to lock in profits aggressively along the way.
💬 Like, follow, and comment if this breakdown supports your trading!
More setups and market insights coming soon — stay connected!
Crypto

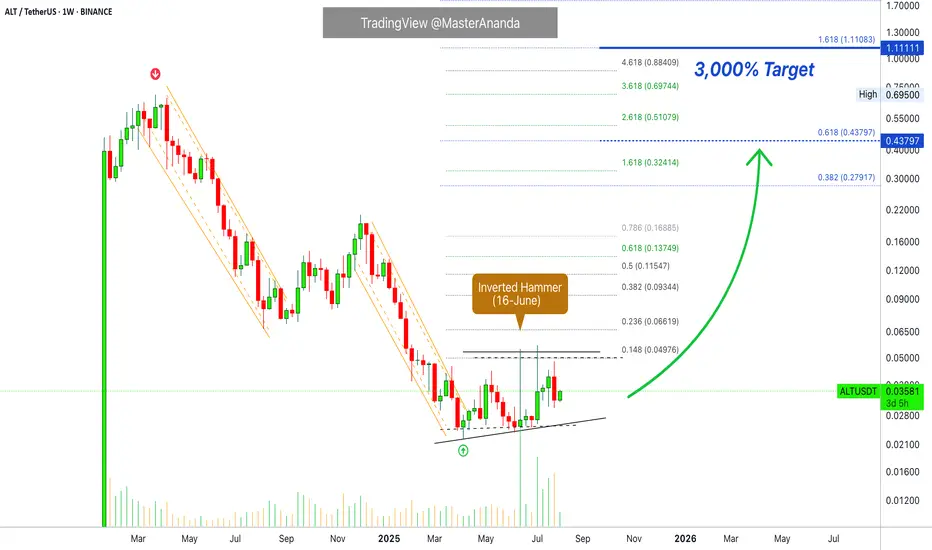
AltLayer 3,000% Late 2025 Target · Bottom ConfirmedThis is a perfect chart. You can see the same drawings made by the candles compared to other altcoins we've been visiting. For example, the main low happened 7-April 2025, four months ago. So AltLayer hit bottom and has been consolidating slowly moving up.
Notice higher lows. Notice how after more than two months in June when the market tried to move lower the session ended as an inverted hammer, with high volume. The hammer as a candlestick pattern is a reversal signal. It is only a valid signal when it comes at the end of a trend. Here we have the major low in April after a major downtrend. These signals confirms the low is in and the trend will soon change.
It is true, because we already have confirmation. ALTUSDT has been challenging resistance with long upper wicks, support remains unchallenged. As this trend continues, bullish momentum will grow and a massive bullish wave will occur. AltLayer has a huge 3,000% potential for growth in the coming months. Can be a bit less but it can also end up being much more.
Namaste.
Bitcoin Cash Update · Good NewsBitcoin Cash has been facing the upper resistance of a long-term and wide bullish flag continuation pattern.
Overall, the chart is extremely bullish. Bitcoin Cash has been growing for 119 days. The action is very controlled with no large drawdowns. It is the perfect build-up pattern for a major advance.
It is good that the action this week is back above the upper flag trendline, as this confirms the market turning bullish. A red close last week and another red close this week would be bad and can point to lower prices. Instead, we have green this week and many altcoins are starting to recover, Bitcoin looks great.
Ethereum and XRP are trading much higher compared to Bitcoin Cash. We know Bitcoin Cash will not stay behind, so it is only a matter of time before we see higher prices. Maybe there will be some stability above $850.
There is still a long road to travel. Everything will continue to get better with each passing day. The market has been growing for months, four months to be exact, but this is only the start. Everything will be much better in the weeks ahead.
Namaste.

Idea for long; TANSSIUSDTI am looking for long here again at 0.05092
this one i am looking to hold bit longer for big profits

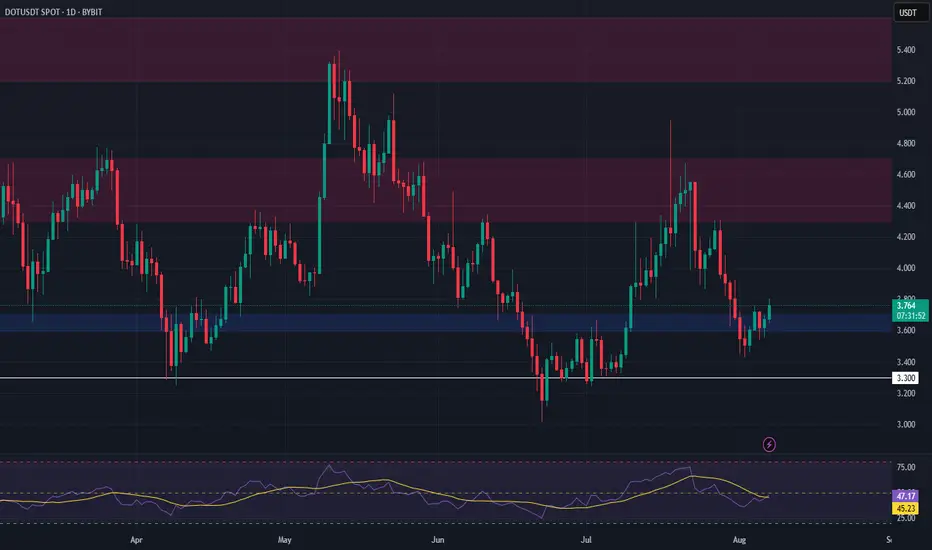
DOT | Bounce Setup from Major Support ZonePolkadot (DOT) has dropped sharply in recent weeks and is now testing a significant support zone between $3.60 – $3.70. This level has historically provided strong demand, making it a potential launch point for a bounce toward higher resistance levels.
Trade Setup:
🔹 Entry Zone: $3.60 – $3.70
🔹 Take Profit Zones:
• TP1: $4.30 – $4.70
• TP2: $5.20 – $5.60
🔹 Stop Loss: Below $3.30
ETHSimple chart :
- Don’t fight the trend, just stick to your strategy.
- follow the signs.
- Never go all in and always DCA.
Only this way we will learn to master our emotions.
Happy Tr4Ding !

BITCOIN Bullish Breakout! Buy!
Hello,Traders!
BITCOIN made a bullish
Breakout of the key horizontal
Level of 115,5k$ and the
Breakout is confirmed so
We are bullish biased and
We will be expecting a
Further bullish move up
Buy!
Comment and subscribe to help us grow!
Check out other forecasts below too!
Disclosure: I am part of Trade Nation's Influencer program and receive a monthly fee for using their TradingView charts in my analysis.

Bitcoin is forming a double bottom ┆ HolderStatKUCOIN:BTCUSDT is bouncing from 112,000 support, forming a potential double bottom. The setup aligns with prior bullish continuations from similar consolidation zones. A push toward the ATH region could follow if buyers remain in control.

Ethereum is consolidating ┆ HolderStatBYBIT:ETHUSDT is trading within a consolidation zone just under $4000 after rallying from sub-$3000 levels. The trend remains strong with prior triangle and consolidation patterns fueling upward moves. A continuation breakout may test the $4000 barrier soon.

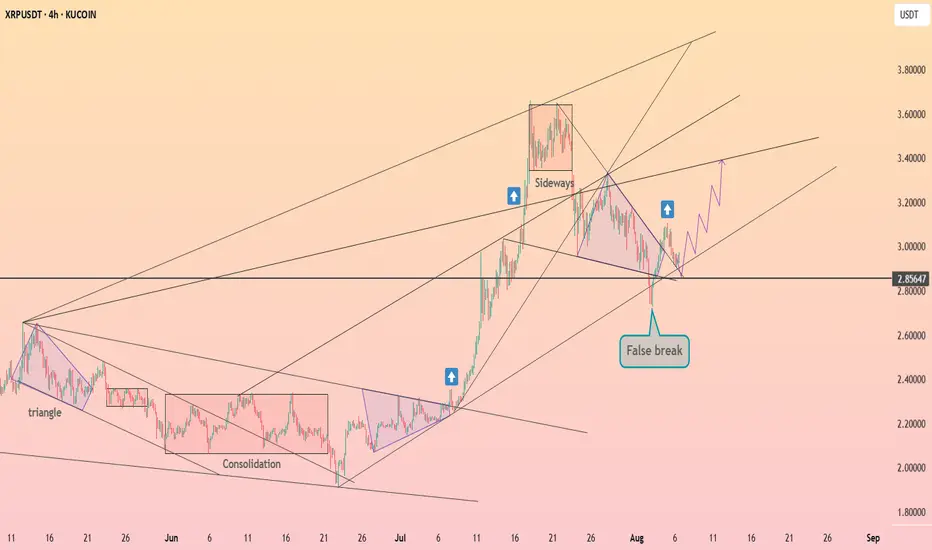
XRP go out from the wedge ┆ HolderStatKUCOIN:XRPUSDT faked a breakdown below 2.85 and is now recovering back into range. This aligns with previous bullish setups following consolidation. As long as the false break holds, price may attempt to move toward 3.40–3.50 again.
Solana formed the rising bottom ┆ HolderStatKUCOIN:SOLUSDT has respected the $158 key support following a structured pullback from recent highs. The setup features repeated bullish continuation patterns such as triangles and consolidation. Expect a potential move toward 184+ if support holds.

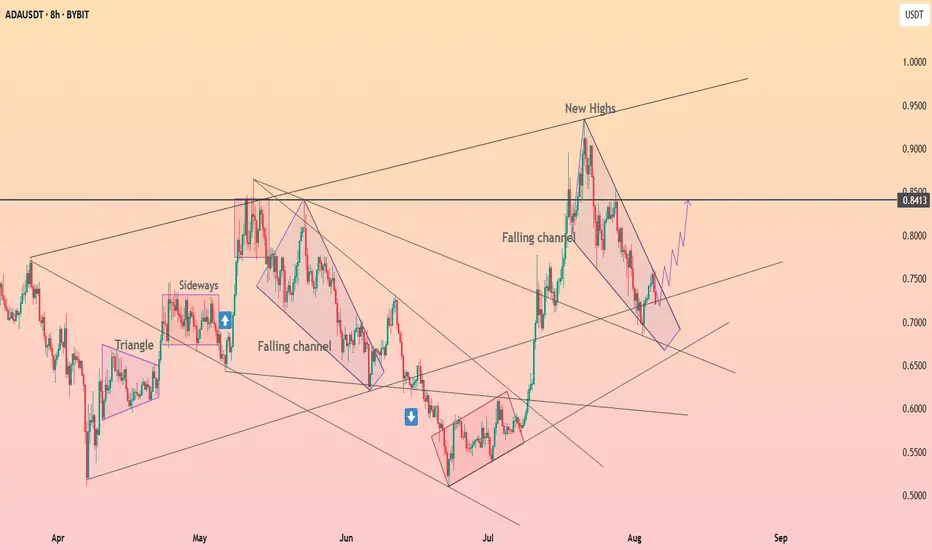
Cardano will break out of the falling channel ┆ HolderStatBYBIT:ADAUSDT broke out of a falling channel and is showing renewed bullish momentum. With structure turning supportive and higher lows forming, a move toward the $0.84 level appears likely if buying strength sustains.
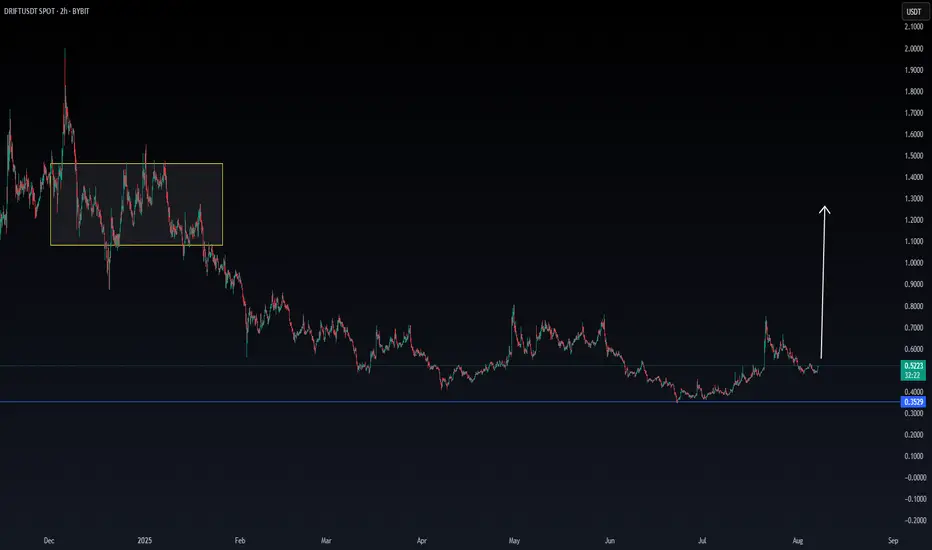
DRIFT/USDT Starting the engine to moonDrift seems to have a new upcoming volume, which can be confirmed in the coming hours.
Will follow Drift for more confirmations.
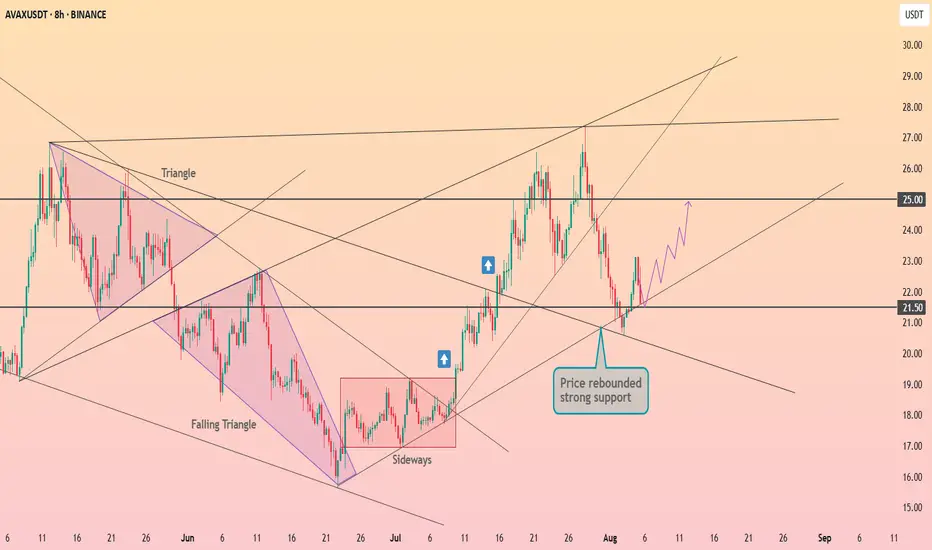
Avalanche will retest the $21.5 level ┆ HolderStatBINANCE:AVAXUSDT bounced sharply from the $21.50 support, confirming the level as a pivot zone. Previous breakout patterns remain intact, and the current price action indicates potential for a move toward $25.00 resistance if buyers maintain control.
Hyperliquid (HYPE): Looking For Recovery | Possible Buy AreaHYPE has had its fun with 200EMA, which recently got broken and now most likely we are going for a retest of that broken zone, which also would fill a local FVG area.
That's what we are looking for rn, a smaller recovery before another wave of sell-side movement.
Swallow Academy

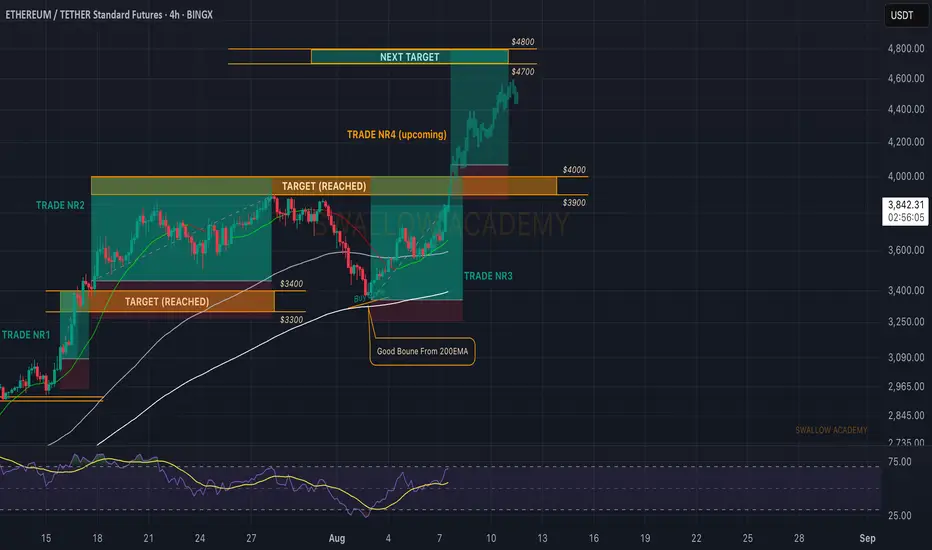
Ethereum (ETH): On Fire, Heading For Another Breakout Attempt ETH is on fire, where the price is catching the buyside momentum and probably going for that $4000K breakout attempt once again, where our trade will be closed as well (in the region of $3950-$4000).
So we wait for that zone to be reached and once we break it there, we will be looking for another entry for a long to $4800!
Swallow Academy
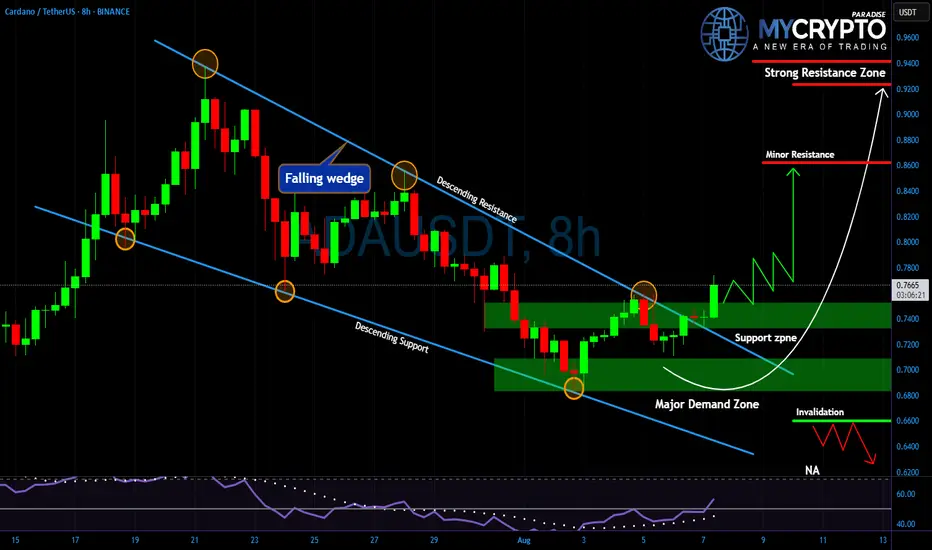
ADA Just Broke Out... But Will It Hold or Collapse From Here?Yello Paradisers, are you ready for what Cardano is about to do next? After weeks of being trapped in a falling wedge, #ADA has finally broken out and this move could either be the start of something big or just another fakeout to trap late buyers.
💎Price has now closed above the descending resistance, confirming the breakout of the falling wedge structure. The 0.7300–0.7450 zone is currently acting as the first area of support. This level needs to hold in order to maintain bullish momentum, or the entire setup could be invalidated. Below that, the major demand zone between 0.6700 and 0.7100 remains critical if #Cardano slips into that range, we’ll be watching for either a bounce or signs of a deeper breakdown.
💎On the upside, the first short-term target sits at 0.8600 where minor resistance is expected, but the real battle will take place between 0.9300 and 0.9500 a strong resistance zone where many traders will be looking to take profits or re-enter shorts. Momentum indicators are showing early strength, with RSI recovering and confirming renewed buyer interest.
💎If bulls can maintain control above the breakout zone, #ADA could enter a healthy consolidation phase before launching into the next leg up. However, a drop below 0.6600 would completely invalidate the current structure and shift the bias back to the downside so risk management remains essential here.
🎖Strive for consistency, not quick profits. Treat the market as a businessman, not as a gambler.
MyCryptoParadise
iFeel the success🌴
Bitcoin inverted HEAD & SHOULDERSIf this is an inverted HEAD & shoulders pattern for bitcoin, then the neckline is already broken and bitcoin is Back testing that now, well the target is $160k as well

Phemex Analysis #103: SOL at $168—Bull Trap or Moon Mission?2025 has been a wild ride for Solana ( PHEMEX:SOLUSDT.P ). Its price soared from $189 on January 1 to an all-time high of $295 on January 19, only to crash over 65% to a low of $95 by April 4. Today, SOL has bounced back to around $168, sitting between a key support at $145 and resistance at $209.
Fundamentally, Solana is trending back into the spotlight. Institutional interest is up, with ETF filings from major players like Franklin Templeton, Grayscale, and VanEck. The launch of the REX-Osprey Solana + Staking ETF (SSK) in July—offering a 7.3% staking yield—has added fuel to SOL’s resurgence. On-chain activity remains strong, with over 22 million active addresses and growing developer engagement following performance upgrades like Alpenglow.
With fundamentals strengthening, institutional interest building, and price action showing renewed life, let's explore the possible near-term moves for Solana.
Possible Scenarios
1. Bullish Breakout to $209 and Beyond
SOL may continue its rebound and test the $180–$190 resistance zone. If that breaks with heavy volume, we could see a bullish continuation toward $200–$209, opening the path for a test of recent highs.
Pro Tips:
Entry Signal: Buy on a breakout above $180 with strong volume confirmation.
Profit Targets: Look to take gains near $200 and $209, while watching for further momentum toward $250+.
Risk Management: Place stop-loss just below $165 to protect against sudden reversals.
2. Consolidation Between $145–$180
If buying pressure isn’t enough for a breakout, SOL could consolidate within the $145–$180 range. This would allow the market to digest recent volatility and prepare for the next move.
Pro Tips:
Range Trading: Use grid bots or buy near support ($145–$150) and sell near resistance ($175–$180).
Breakout Watch: Wait for volume to increase at breakout or breakdown levels before taking a more aggressive position.
3. Bearish Breakdown Toward $145
If broader market sentiment shifts or ETF momentum fades, SOL could fail to hold above $145, triggering a correction toward lower support levels near $130 or even $100–$120 in a severe scenario.
Pro Tips:
Reduce Risk: Scale out of positions or go cautious if $145 fails decisively on high volume.
Dip Accumulation: Long-term investors may look to re-enter at stabilized price zones at $130–$120.
Conclusion
Solana remains in a critical phase where fundamentals—signal upgrades, active developer growth, and institutional ETF activity—align with technical bounce patterns. Whether SOL breaks out into a new rally, consolidates, or pulls back depends on upcoming price action and broader market sentiment. By using clear entry triggers, defined targets, and disciplined risk management, traders can effectively ride Solana’s next wave of volatility.
🔥 Tips:
Armed Your Trading Arsenal with advanced tools like multiple watchlists, basket orders, and real-time strategy adjustments at Phemex. Our USDT-based scaled orders give you precise control over your risk, while iceberg orders provide stealthy execution.
Disclaimer: This is NOT financial or investment advice. Please conduct your own research (DYOR). Phemex is not responsible, directly or indirectly, for any damage or loss incurred or claimed to be caused by or in association with the use of or reliance on any content, goods, or services mentioned in this article.

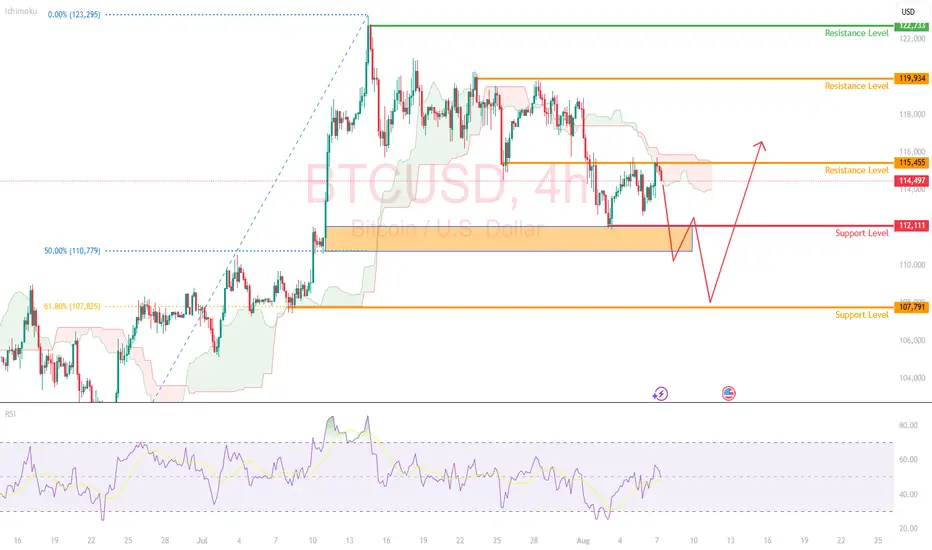
BTCUSD Retrace to ReboundBitcoin is currently trading around $114,500 price level and continues to be held below the $116,000 level.
Price remains in a short-term range between $112,000 and $116,000. But signs are emerging that a breakout may be brewing.
Ichimoku Cloud
BTC is trading into a bearish cloud, which further highlights the possibility of continuation within the range.
RSI
RSI is turning lower from the 60 level, away from the overbought region. This could indicate some downside to come (back into the range).
The Anticipation
Look for a possible break to the downside (below the support level of $112,000 and the 50% retracement level).
Eventually, we could see BTC retest the 108,000 support level before a strong rebound, with possibly a new ATH created.
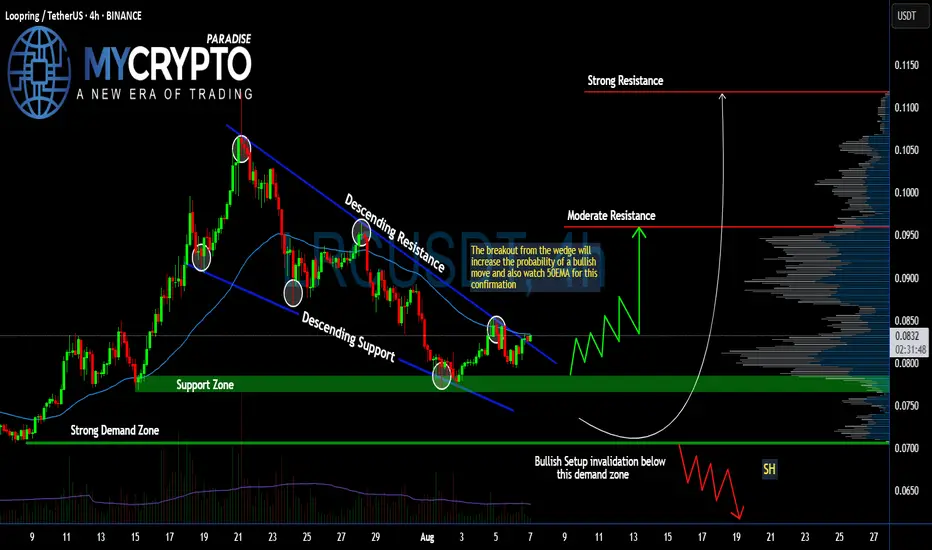
#LRC Ready for a Massive Recovery From Here | Must Watch Yello, Paradisers! Is #LRCUSDT finally ready for a breakout, or is it just another trap for early bulls? Let's break down the current structure of #LRC.
💎#Loopring ( CAPITALCOM:LRC ) has been moving within a descending wedge pattern for weeks, with price consistently making lower highs and lower lows—clearly respecting both descending resistance and support levels. However, we are now starting to see signs of change as it retests the upper trendline.
💎A breakout above the descending resistance is about to occur, and it’s doing so right around the 50EMA, which adds further confluence for a possible bullish move. This move is increasing the probability of a short-term trend reversal.
💎The support zone around $0.078–$0.082 is the key region to watch now. If bulls can hold above this zone and reclaim it as a base, we could see a breakout continuation toward the moderate resistance at $0.096. Should momentum build up from there, the next big target is the strong resistance at $0.1118—a level marked by historical seller interest and significant volume profile resistance.
💎However, if #LRCUSD falls below the strong demand zone at $0.0706, this entire bullish setup becomes invalid. That breakdown would suggest the market isn't ready yet, and could trigger another wave down toward fresh lows.
Stay patient, Paradisers. Let the breakout confirm, and only then do we strike with conviction.
MyCryptoParadise
iFeel the success🌴
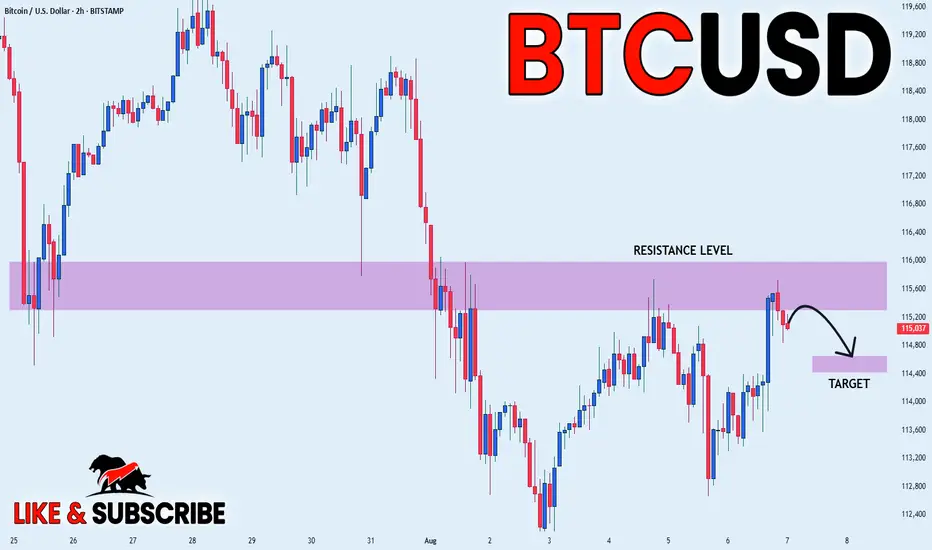
BITCOIN PULLBACK FROM SUPPLY AREA|SHORT|
✅BITCOIN price grew again
To retest the resistance of 116k
But it is a strong key level
So we are seeing a bearish reaction
And we will likely see a
Further bearish move down
SHORT🔥
✅Like and subscribe to never miss a new idea!✅
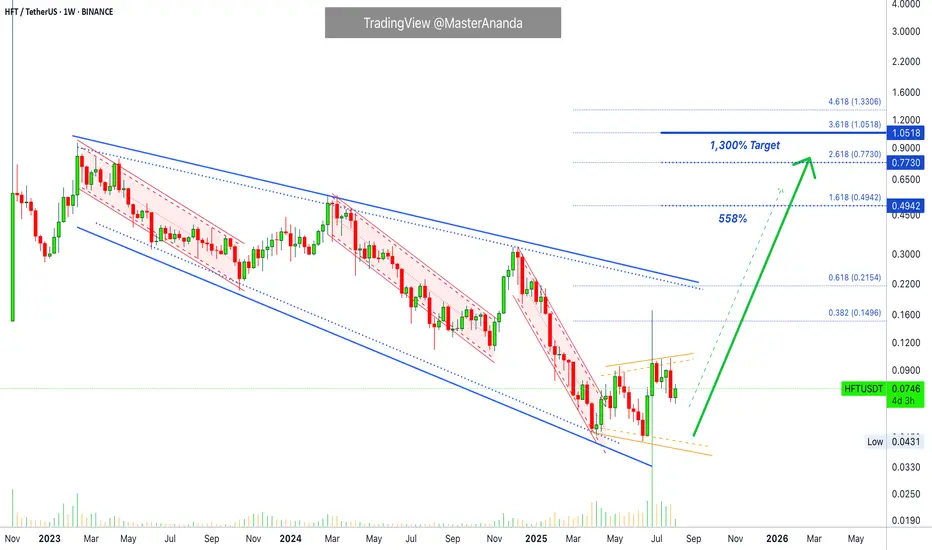
Hashflow Already Hit Bottom, I Can Prove It · 1,300% PPThe bottom is in. I can prove it and you will agree.
Good afternoon my fellow Cryptocurrency trader, how are you feeling in this wonderful day?
Hashflow (HFT) has been dropping since February 2023, a major decline but there is good news, just recently market conditions and price action dynamics started to change. Come April 2025 a downtrend is no more. Instead, when a new low was hit in June the chart ended as a double-bottom rather than a bearish impulse. And this is not all.
After the low in June 2025, the market bottom and all-time low, HFTUSDT produced the highest volume ever in a single week, by far the highest. Even higher than the first week of trading which tends to have the highest volume. And this confirms the bottom is in.
A downtrend ends, the bottom is confirmed. This combination reveals what comes next. Yes! A major bullish rise, a bullish impulse, a bullish cycle, a bullish wave. These are all the names for what you are about to experience next.
It is very simple actually, the market moves in cycles and within these cycles we have waves. The market was going down, long-term, as soon as the downturn is over we get a growing phase. Hashflow is set to grow.
Thank you for reading.
Namaste.