Crypto

Injective Easy 584% Bullish Wave Now PossibleInjective is now ready after a very long period of correction. The peak for this pair happened in March 2024 and in December 2024 there was no higher high, instead, a classic lower high and now a complete ABC correction. This ABC correction comes after a perfect, long-term, 1,2,3,4,5 bullish impulse.
After this correction ends will be the start of a new bullish impulse which will lead to a new All-Time High. The 584% target on the chart is an easy one. The 209% is super easy and can be approached by all types of market participants. This is a strong project.
There is really high volume as prices move to "baseline level." This is a support zone that was created after a long consolidation in 2023. Almost 7 months of consolidation. Sideways, and now this same range that worked as resistance is working as support. Support is confirmed because volume is rising, a very strong rise. INJUSDT is about to grow.
The entire Injective bullish wave, with a bottom in 2022 and a peak in 2024 amounted to 4,631% total growth. This is perfect and the market is ready now for a new round of growth.
Feel free to accumulate; buy and hold.
Namaste.

Technical Analysis: Worldcoin (WLD/USDT) + TRADE PLANTechnical Analysis: Worldcoin (WLD/USDT)
Chart Overview
Pattern: A falling wedge formation is clearly visible, typically a bullish reversal pattern.
Potential Breakout: The price has broken above the upper wedge resistance line, indicating a potential bullish breakout.
Key Levels:
Resistance Zones:
$1.26 (SMA50)
$1.55–$1.65 (major supply zone)
$1.80–$1.90 (final resistance target)
Support Zones:
$1.18 (local support)
$1.00–$1.10 (strong green demand zone)
$0.90 (final downside support)
Indicators & Oscillators
Volume
Volume shows moderate rising interest during breakout—confirmation would be stronger with larger volume spikes.
VMC Cipher B
Momentum waves and money flow are turning bullish.
Green dots at the bottom suggest bullish divergence and likely upward momentum.
RSI (14)
Currently at 52.77, crossing above 50—a bullish signal.
Not yet overbought, so there's room to move upward.
Money Flow Index (MFI)
Reading at 63, indicating strong inflows and increased buying pressure.
Stochastic RSI
Bullish crossover, currently at 66.78/75.27, heading upward—supports the breakout scenario.
Trading Plan
Scenario A: Bullish Breakout Confirmation
Trigger: Close above $1.20–$1.22 with rising volume and continued RSI/MFI strength.
Buy Zone (Spot 1): $1.18–$1.22
Buy Zone (Spot 2): On pullback to wedge breakout line ($1.15–$1.17)
Targets:
TP1: $1.26 (SMA50)
TP2: $1.55–$1.60 (supply zone)
TP3: $1.80 (long-term resistance)
Stop Loss: Below $1.10 (to invalidate breakout)
Risk-Reward Ratio: Minimum 1:2 for TP1, up to 1:4–1:5 for TP3
Scenario B: Failed Breakout / Bearish Rejection
Trigger: Rejection at $1.20–$1.26 and fall below $1.15 with increasing sell volume.
Short Entry (only for experienced traders): Under $1.15
Targets:
TP1: $1.05 (mid-demand zone)
TP2: $0.95–$1.00 (major demand zone)
Stop Loss: Above $1.22
Note: Prefer to stay out if volume is low—wait for clearer structure.
Risk Management & Strategy Notes
Use position sizing: No more than 3–5% of capital per trade.
Be patient—wait for candle close confirmations.
If the price consolidates near $1.20 and volume increases, a strong upward move is likely.
Avoid emotional trading—react to price action, not assumptions.
Worldcoin (WLD/USDT) is showing strong bullish potential with a confirmed breakout from a falling wedge. Indicators support upward momentum, and the structure favors a move toward the $1.50–$1.80 range. Monitor volume and key support levels to manage risk and confirm trend continuation.

Compound 3 Years Consolidation = Ultra-Bull Market (PP: 3,164%)Compound has been consolidating for three years now, similar to DigiByte in time but the chart situation is different, the price here is much better because it is trading lower near support.
I cannot stress it enough. You cannot fail with a pair like this one. Trading at bottom prices after years of consolidation. Once it starts going/growing you will be sitting on a very strong position. Long-term growth. Huge potential for profits vs a minimum risk potential.
Ok. I say "no leverage" but I share leveraged trades. Remember, many people so there is a little bit for everybody.
The trick is to go below 5X. If you do 3X, you are always safe basically, very little risk and you can maximize profits. 5X is also do-able. If you go beyond 5X, it is possible of course and we do it all the time but you run the risk of getting liquidated. So there are some trade-offs.
But of course, you need to do your own thing I am only sharing the charts.
Spot trading, 100% success guaranteed. Worst case scenario, a long wait.
To achieve these two you cannot use a stop-loss. If you do use a stop-loss then you can be shaken out of your position through a market flush. If you buy and hold, set it and forget it, you can win for sure long-term.
Compound has been consolidating for three years and is getting ready to move. Once it starts moving there is no going back. The longer the consolidation phase the stronger the bull market that follows.
Namaste.

Solana Still Bearish, Moving LowerI will alert you here when the bearish potential is completely nullified. Right now, Solana is still bearish. This applies to all other major projects that I shared recently but I will also update those.
The maker produced a rejection yesterday, 3-June, as a lower high. This implies a bearish continuation. The two levels mapped on the chart are the main support zone.
Since the first level is already being challenged, we can aim for the second one.
Once the correction is over, we will go bullish again.
Some of the smaller altcoins can grow while the rest of the market crashes down. Choose wisely. It will be hard right now.
Namaste.

Bitcoin Brewing - A large move is coming!Bitcoin has been under pressure over the last few trading sessions.
Despite the equity markets going higher this asset is stuck in a holding pattern.
We are currently forming a wedge pattern that has given us a directional bias to trade.
Price action is at a 50/50 in terms of falling lower or rallying higher.
Being the fact that the bulls have been forming higher lows & higher highs, we have to give them due respect.
However understand this BTC is showing some distribution signs and is likely going to have a decent selloff within the next 15-45days. We may have 1 more spike higher but we may not.
1 note of interest is the 7day & 20 day moving average just signaled a bearish crossover which is something you need to monitor closely.
I do think the upside is limited to about 115K if we have 1 more move higher.

BTCUSD: This part may be the most exciting of all.Bitcoin is on an excellent bullish 1W technical outlook (RSI = 65.366, MACD = 6742.800, ADX = 33.478) unphazed by the recent short term pullback. This is because the Cycle is only now starting is strongest phase, at least based on the historic price action of the former Cycles. After the U.S. elections in November 2024, we've crossed above the Bear Cycle neckline and on all previous Cycles, that is where the parabolic rally started. How high it can go is anybody's guess and depends largely on fundamentals (adoption, ETF, Rate Cuts) but we can agree that we will see at least 150,000 before this Cycle ends.
## If you like our free content follow our profile to get more daily ideas. ##
## Comments and likes are greatly appreciated. ##

BTC 12H – Slightly Different Picture
The 12H chart tells a slightly different story.
From the PSAR point of view, price has tapped it twice, but that’s not enough for confirmation.
From the system perspective, price is trading above the BB center, with both MLR and SMA also above it—this could justify small scaling.
From the S/R view, price is currently testing weekly resistance and the dotted line marking the daily close. That’s a strong reason to apply proper risk management.
Let’s see how this unfolds.
Scaling in may be a valid option for those considering long exposure—if risk is managed properly.
Feel free to drop your thoughts in the comments—good or bad, all engagement is appreciated.
Take profits. Manage risk. Stay sharp.

BTC Daily – Mixed Signals, Patience Required
From the PSAR perspective, BTC remains in a bearish phase. We need to wait for a PSAR flip to green before considering new long entries.
From the second system view, we’re also still in bearish territory. The setup will shift once MLR crosses above the SMA and BB centre. Currently, price is holding the SMA as support and has paused at the BB centre.
Looking at S/R levels, we’ve seen a solid bounce from the 3D + 5D support and are now holding at the weekly support zone.
Let’s see how this unfolds.
Scaling in may be a valid option for those considering long exposure—if risk is managed properly.
Feel free to drop your thoughts in the comments—good or bad, all engagement is appreciated.
Take profits. Manage risk. Stay sharp.

LDO - Next Impulse Starting Soon!Hello TradingView Family / Fellow Traders. This is Richard, also known as theSignalyst.
After breaking above the $0.8 major high, LDO has shifted from bearish to bullish from a long-term perspective. 📈
This week, it has been undergoing a correction phase within a falling channel marked in red. 🔻
For the bulls to take over and kick off the next impulsive wave toward the $1.5 mark, a breakout above the upper red trendline is needed. 🚀
📚 Always follow your trading plan regarding entry, risk management, and trade management.
Good luck!
All Strategies Are Good; If Managed Properly!
~Rich

AVAX Bulls Walking into a Trap? Yello Paradisers, are we on the edge of a clean breakout or is AVAX setting up the perfect trap before flushing the late bulls?
💎#AVAXUSDT has recently broken above a critical resistance zone and is now attempting a retest. This move appears strong on the surface, but it sits at a dangerous pivot—one that could determine the short-term direction in the days ahead. The structure is unfolding within a clean ascending channel, with both resistance and support levels well respected. These rising boundaries give the breakout credibility, but they also highlight how vulnerable the setup is if key support levels fail.
💎Right now, the level that previously acted as resistance is being tested as support. This is the moment of truth. If the price continues to hold above this level with strength and volume, we’re likely in for a continuation toward the next resistance level around $22.40. But the real test for bulls will come at the $23.00 region, where heavy profit-taking and increased selling pressure are highly likely. That’s where the larger players will look to trap over-leveraged longs and reposition.
💎But this bullish outlook comes with a clear condition and it’s non-negotiable. If #AVAX fails to hold $21.00 and begins closing candles back inside the previous range, the move instantly loses its legitimacy. In that case, our focus turns to the strong demand zone between $20.20 and $20.40. A reaction from this area could still save the structure, offering a potential reload for a bounce. But if this level gives way, the entire bullish setup is invalidated and what was once a breakout turns into a confirmed bull trap.
Trade smart, Paradisers. This setup will reward only the disciplined.
MyCryptoParadise
iFeel the success🌴

XAU/USD (Gold vs US Dollar) 1h timeframe 1. "Bullish Breakout Anticipation: Gold Eyes $3,435 Zone"
This title emphasizes the potential breakout scenario:
The chart shows price pushing into a previous supply zone (highlighted rectangle).
The green box and arrow indicate a bullish target near $3,435.
Key resistance has been tested multiple times (red circles), suggesting weakening seller control.
📈 2. "Double Bottom Reversal Validates Bullish Momentum in XAU/USD"
This reflects a technical pattern recognition:
A potential double bottom forms near the May 15th and late May lows.
The breakout from the neckline (around $3,350–$3,370) confirms the reversal.
Red-to-green zone suggests the projected move post-breakout.
🔄 3. "Range Consolidation Broken: XAU/USD Breaks Key Resistance"
Focuses on market structure:
Horizontal support/resistance lines indicate a range-bound market.
The recent move above previous highs signals a range breakout.
Blue arrow suggests a retest could offer a long entry point.
💡 4. "Buy Opportunity Triggered on Retest: Targeting Supply Zone Break"
This suits a trading plan scenario:
Red and blue arrows suggest a pullback-and-go trade setup.
The price may revisit the breakout level (~$3,348) before heading higher.
The green zone is the profit target area.
⚔️ 5. "Battle of Supply and Demand: Bulls Gaining Control Above $3,370"
Captures the market sentiment shift:
Multiple failed attempts to break lower (marked with red circles).
Final bullish breakout shows momentum shift to buyers.
If volume confirms, the breakout could be strong and sustained.

RNDR (Render) – Higher Low Setup for Potential Upside ExpansionRENDER is holding strong above the $3.50–$4.00 support zone, forming what appears to be a higher low — a classic sign of potential trend continuation. This setup provides a favorable risk-to-reward ratio with clearly defined invalidation and upside targets.
📥 Entry Zone:
$3.50 – $4.00
🔸 Holding above demand
🔸 Prior resistance now acting as support
🔸 Potential higher low setup
🎯 Take Profit Targets:
🥇 $6.00 – Previous local top / liquidity pocket
🥈 $8.00 – Major resistance zone from prior cycle
🥉 $10.00 – Psychological round number + HTF extension target
🛑 Stop Loss:
Daily close below $2.50
Clears invalidation of the structure
Below HTF support base

HolderStat┆ETHUSD road to the sell zoneCRYPTOCAP:ETH price ascends inside a neat channel after a trio of consolidations. The chart’s marked sell zone near 3 100 USDT aligns with upper resistance, yet current higher-low structure, breakout arrows and supportive trendline suggest bulls intend to test that ceiling soon.

HolderStat┆SOLUSD channel surferCRYPTOCAP:SOL exited a falling channel, built a clean growing channel and parked on 165 USDT support. Repetitive consolidation mid-way and a projected path to the 190 USDT level underscore continuing strength, with trendline confluence favoring upside continuation.

HolderStat┆XRPUSD rebound renaissanceCRYPTOCAP:XRP bounced off a long falling wedge, logged a labeled “rebound”, and now glides within a widening channel. Multiple consolidation pauses plus higher lows keep momentum positive; watch the 740 USDT overhead zone as resistance where breakout traders may aim next.

HolderStat┆ADAUSD coiled for new highsCRYPTOCAP:ADA has printed boxy consolidations, respected its rising base and survived a sharp pullback; price now rests on ascending support. With prior “new highs” still warm and trendline resistance nearby, the setup flags a rebound toward 0.78 amid persistent bullish price action.

HolderStat┆BNBUSD breakout ripple effectCRYPTOCAP:BNB punched through a year-long resistance, tagged “breakthrough” and now coils above the trendline. Consecutive consolidation blocks, rising support and a freshly won channel hint at buyers pressing toward the 740 USDT supply zone, extending the crypto’s bullish narrative.

HolderStat┆BTCUSD stairway to athCRYPTOCAP:BTC marched out of strong consolidation, sliced a falling wedge, then keeps stacking bull-flag consolidations on an ascending trendline. Uptrend channel, breakout energy and 100 k support line up for an assault on the 112 k ATH level — bullish momentum in full swing.

AVAX: Low in Sight?AVAX continued its expected decline into the magenta Target Zone between $24.42 and $13.31, before reversing course over the weekend with a modest bounce. While it's possible that this marked the low of the wave ii correction, we're not ruling out the potential for another dip within the zone. For now, the setup remains open-ended. Once orange wave ii has been confirmed as complete, we expect a strong rally to follow in wave iii, likely driving the price beyond resistance at $49.95.
📈 Over 190 precise analyses, clear entry points, and defined Target Zones - that's what we do.

PNUT/USDT – Bull flag breakout attemptPNUT/USDT – Bull flag breakout attempt
PNUT is currently showing signs of breaking out from a bull flag pattern. This pattern typically indicates a continuation of the previous uptrend if confirmed with strong volume.
The price is testing the upper trendline of the flag. If it breaks and closes above this resistance, we may see bullish momentum ahead. However, a rejection from this zone could lead to consolidation or a short-term pullback.
Key levels to monitor:
* Breakout confirmation area
* Support near the flag base
* Volume activity for breakout strength
Keep a close watch — a successful breakout could lead to the next upward move.

#BERAUSDT #1D (Bitget Futures) Descending wedge on supportBeraChain printed a bullish hammer that may have marked a double bottom here on daily.
Reversal seems around the corner, revisiting 50MA & 100EMA resistances would make sense.
⚡️⚡️ #BERA/USDT ⚡️⚡️
Exchanges: Bitget Futures
Signal Type: Regular (Long)
Leverage: Isolated (2.0X)
Amount: 4.8%
Entry Zone:
2.798 - 2.558
Take-Profit Targets:
1) 3.345
2) 3.848
3) 4.350
Stop Targets:
1) 2.120
Published By: @Zblaba
CRYPTOCAP:BERA BITGET:BERAUSDT.P #1D #BeraChain berachain.com
Risk/Reward= 1:1.2 | 1:2.1 | 1:3.0
Expected Profit= +49.8% | +87.4% | +124.9%
Possible Loss= -41.7%
Estimated Gaintime= 1-2 months

USD/JPY.chart pattern..USD/JPY BUY trade idea:
---
📈 Trade Setup Overview
Pair: USD/JPY
Trade Type: BUY
Entry: 142.300
---
🎯 Target Points
Target Level Price Notes
🎯 Target 1 146.400 First major resistance zone
🎯 Target 2 148.500 Final target / swing target
---
📉 Risk Management & Distraction Zones
To complete your setup, you should also consider potential risks/invalidation levels.
🔻 Suggested Stop Loss Zone (Distraction)
Below 141.200 – A break below this support level would:
Invalidate the bullish structure
Likely signal reversal or deep correction
---
✅ Summary Table
Parameter Value
Entry 142.300
Target 1 146.400
Target 2 148.500
Suggested SL ~141.200
R:R (approx.) Good (>2:1)
Trend Bias Bullish
---

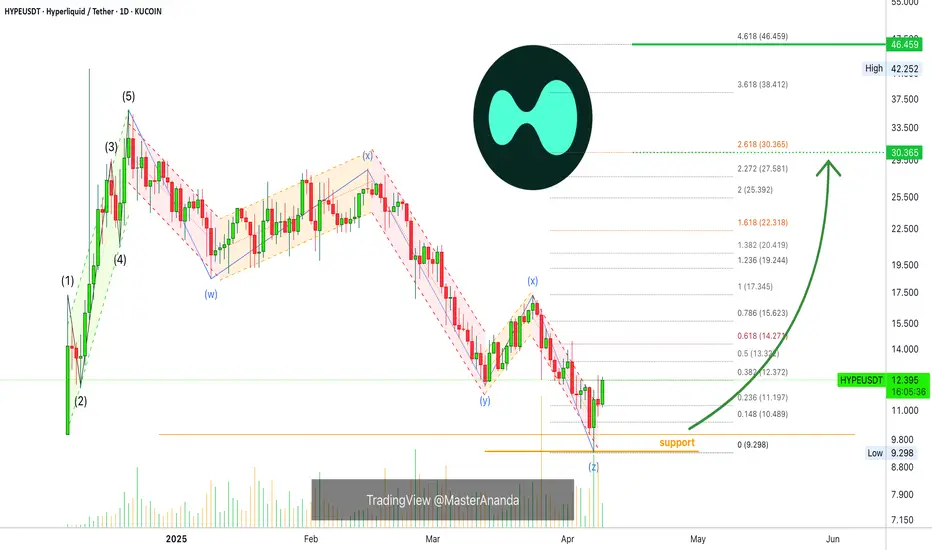
Hyperliquid: Your Altcoin ChoiceLow volume lower low and high volume reversal candle.
Here we do not have six months of data but the chart looks pretty clear. It is simple to read.
I can spot two perfect 5-waves pattern, one going down and another one going up.
Going down is the second one, the correction, and the session that hit a new bottom ended up as a higher low based on the close. That is, the low in December 2024 is $10. The low 7-April is $9.3 but the close happened at $11.5. ($11.5 higher than $10 ).
This can be a bullish signal.
Today's candle trades higher than the 13-March low. A full green candle.
After going down, the market tends to reverse and go up. The action is bullish on the short-term and this is a short-term chart.
Hyperliquid is good as long as it trades above support.
"Support" is clearly depicted orange on the chart.
I used this chart setup to open a short-term based trade.
The main targets are 145% & 270% as shown on the chart.
Thank you for reading and for your continued support.
You are appreciated.
Namaste.