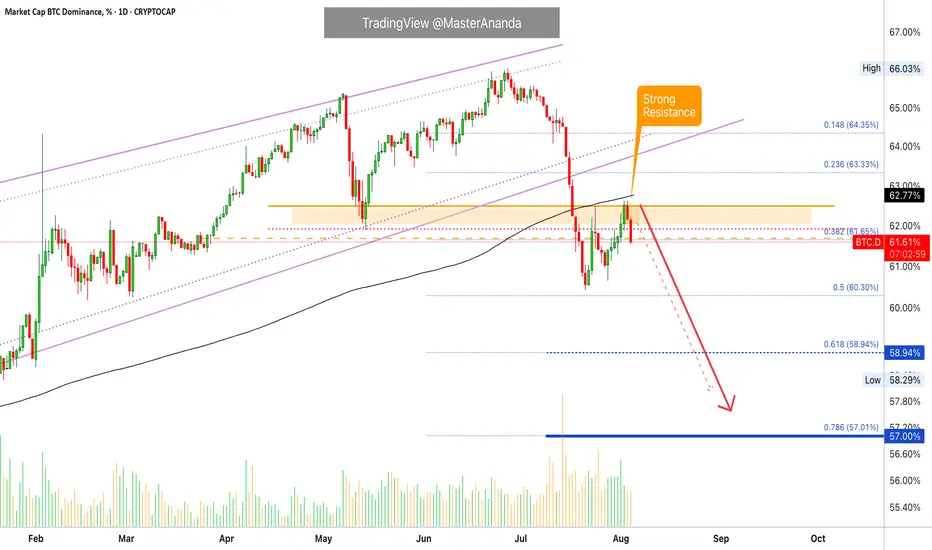
Bitcoin Dominance Update · Daily TimeframeThe rejection is happening right at "strong resistance." Notice that this is the same drawing from my previous update so it was drawn before the fact. Since resistance has been confirmed and the action is happening just as we expected, we can continue to follow our map as it is working.
The next logical move is a drop on Bitcoin Dominance Index (BTC.D), which translates into the resumption of the bullish wave for the altcoins, specially Ethereum and the big projects. It can also signal that Bitcoin will stop dropping and will either consolidate or move higher. This index reveals more than anything else the expected directions of the altcoins.
The retrace is over
The altcoins produced a retrace mainly between 21-July and the 2nd of August. In this period we saw many of the altcoins we are buying and holding move lower but only to produce a strong higher low. This higher low now will resolve into a very strong bullish wave, a bullish resumption.
Moving averages
Here MA200 daily has also been confirmed as resistance and trading below this indicator with a bearish bias, coming from a high point, gives out a very strong bearish signal. It means that long-term bearish action is now in place, the direction/trend. If the action was happening below MA200 but coming from a low point, this signal can have bullish connotations, right now it is bearish.
Bearish Bitcoin Dominance = Bullish Altcoins
The altcoins market will continue to grow, this is only the start. We are set to see growth long-term including now, next week, next month and until late 2025; maybe even for some portion of 2026, maybe even beyond.
Thank you for reading.
Namaste.
Crypto
[Deep Dive] OP – Edition 4: Accumulated Pressure!Optimism (OP) may be quietly setting the stage for a classic reversal play — with structure, sentiment, and cycle theory all lining up.
After a sharp markdown throughout Q4 2024 and early 2025, OP has spent several months forming what appears to be a rounded accumulation base. And if history rhymes, a markup phase could be next.
🔍 Phase Breakdown
📉 Markdown
The aggressive downtrend sent OP tumbling from above $3 all the way to the $0.50–$0.60 support region, wiping out months of bullish structure and triggering capitulation.
📦 Accumulation
Since then, the price has been compressing sideways in a tight range, respecting the $0.50 psychological zone while creating a rounded bottom pattern. This sideways action — combined with declining volatility — suggests sellers are exhausted, and accumulation may be underway.
📈 Markup Potential
The current setup mirrors textbook market cycles, where markdown gives way to accumulation, followed by expansion. If OP breaks above the $0.70–$0.85 resistance zone with volume, the door opens for a rally toward $1.85 and even $2.00 — the next key supply zones.
⚙️ Fundamental Fuel
Optimism is more than just a Layer 2 — it’s the engine behind the Superchain vision. With OP Stack now powering not only Optimism but also chains like Base and Zora, the protocol is becoming the backbone of Ethereum’s scalability roadmap.
Recent key updates include:
- New governance structures via RetroPGF Round 3 distribution.
- Continued expansion of OP Stack rollups.
- Growth in on-chain activity and TVL thanks to Base's rapid adoption.
All of this adds up to strong long-term tailwinds — especially if Ethereum Layer 2 narratives reheat.
🧠 What to Monitor Next
🔍 Break above $0.85 = confirmation of phase shift.
📊 $0.50 remains the key invalidation level for the current bullish thesis.
🧨 Watch for volume spikes near resistance — they often precede explosive markups.
💬 Are we witnessing the calm before Optimism’s storm — or just another pause in a longer downtrend?
🔔 Disclaimer: This post is for educational and informational purposes only. It does not constitute financial advice. Always do your own research and manage risk carefully.
📚 Always follow your trading plan => including entry, risk management, and trade execution.
Good luck!
All strategies are good, if managed properly.
~ Richard Nasr

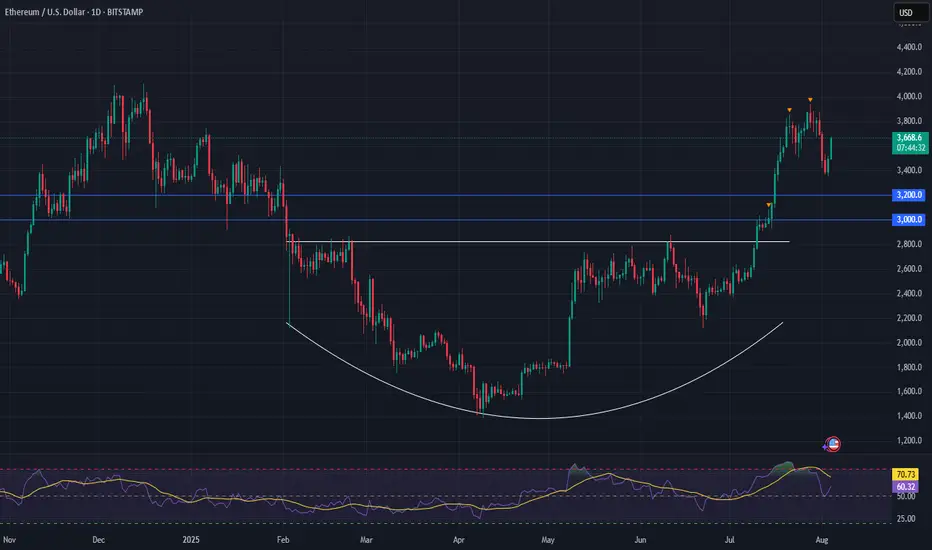
Ethereum (ETH) is setting up for a powerful moveFollowing a strong breakout, ETH has entered a healthy consolidation phase—setting the stage for its next leg higher.
Momentum remains firmly on the bulls’ side, with the breakout from a long-term saucer pattern fueling continued upside pressure.
📈 Technical Highlights:
✅ Short-term target: $4,000+ (breakout continuation)
✅ Long-term potential: $7,000+
🛡️ Key support: $3,000–$3,200 (bullish as long as this holds)
📣 Takeaway:
Ethereum is showing classic bullish structure. With higher-lows forming and strong support below, pullbacks are likely to offer high-probability entries for both traders and long-term holders.
#Ethereum #ETHUSD #Crypto #Trading #TechnicalAnalysis #CryptoTrading #EthereumPrice #Altcoins #Bullish #Breakout
ETH/BTC: Golden Cross Reloaded?This is ETH/BTC on the daily chart.
A major event is about to unfold: the golden cross, where the 50MA crosses above the 200MA.
The last time this happened was in early 2020, around the same price zone, right after a bounce off the 2019 low double bottom and a rejection from the 0.5 Fib level, which sits halfway between the 2019 low and the 0.786 Fib.
In 2025, we’re seeing a strikingly similar pattern:
– Price bounced off the 2019 low
– Got rejected again from the 0.5 level
– And now appears to be gathering strength to flip that level and the 200MA to confirm the Golden Cross
Always take profits and manage risk.
Interaction is welcome.

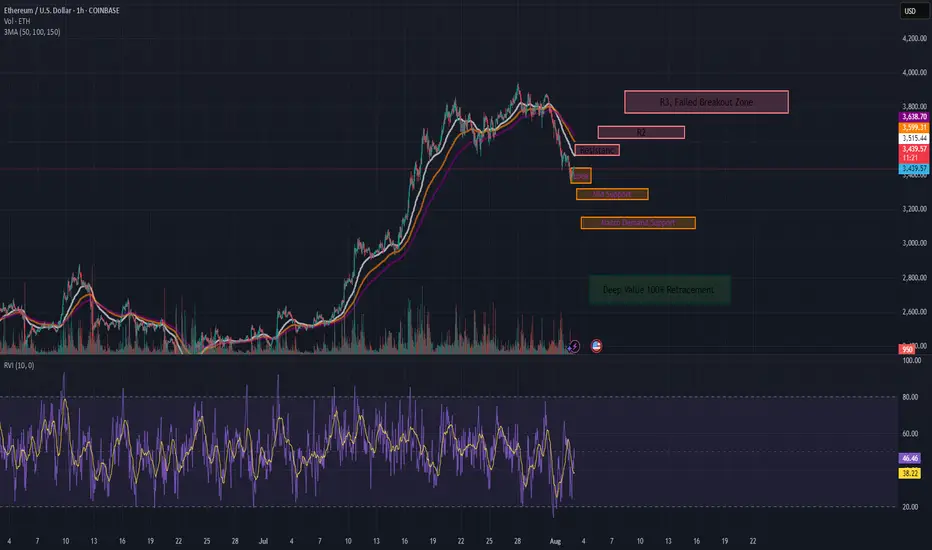
ETH Tactical Long: Laddered Bounce from Absorption ZoneCOINBASE:ETHUSD has been in a steady 1H downtrend, but key support at $3,440 is showing signs of absorption. Volume is thinning on sell-offs, and we're seeing early reversion signals.
This is my over the weekend analysis, not a final recommendation.
Setup Type: Mean Reversion / Absorption Bounce
- Trend: Still bearish on 1H (below 50/100/150 MAs), but slope compression hints at weakening
momentum
- RVI: Below 50, but curling up → early bounce bias
- Volume: Sellers fading into $3,440 = buyer absorption zone
📊 1hr Quant Entry Levels & Laddered Plan
Zone Type Action
$3,440–3,435 Primary Entry Base long entry zone 🔄
$3,420–3,410 Add-on Entry Optional bid stack 🧱
$3,320 Soft Invalidation Trend continuation if lost 🚫
$3,150 Deep Value Wick Low-prob, high-juice trap 💎
🎯 Targets:
T1: $3,515 → EMA cluster rejection zone
T2: $3,600–3,638 → Range midpoint
T3: $3,800 → Trend reversal if reclaimed
⚖️ Risk/Reward: 1:2.5+ (depends on fill ladder)
We are starting entries here, but be cautious if we break through our support levels and you don't have the appetite for the deep value range it may be wiser to wait for a confirming trend or post.
ETH Gears Up Again
ETH on the 4H is confirming the uptrend
MLR > SMA > BB Center — trend structure is bullish
PSAR has flipped bullish
RSI has plenty of room to run
MACD has turned green
Next resistance: 0.236 Fib and the 50MA.
On the macro side:
• Fed chair replacement talks
• Slower job numbers
• CFTC launching “Crypto Sprint”
Momentum is building. We’ll be here to watch it unfold.
Always take profits and manage risk.
Interaction is welcome.

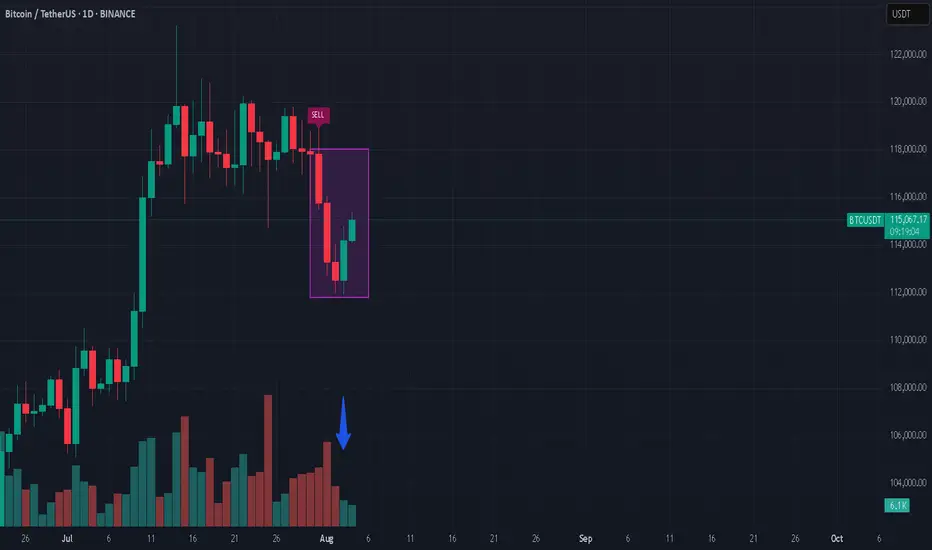
Shorting Bitcoin??Bitcoin had a huge drop, and suddenly shows strength? Well, in my opinion, if you look at the volume, there’s not much strength. I believe it’s going even lower in the short run.
*not investment advice
#bitcoin #crypto #trading
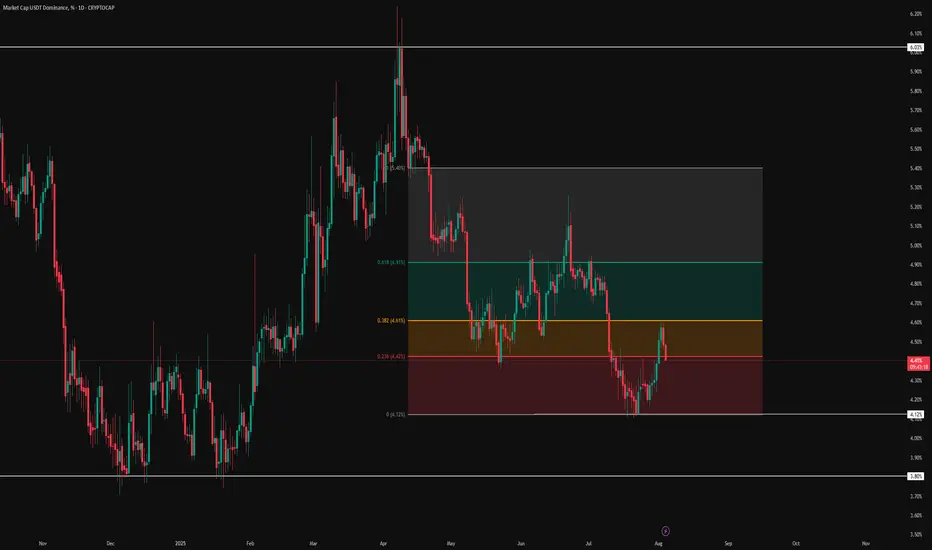
Will a Drop Below 4.12 Push BTC to New Highs ?👋 Hello, and welcome to Satoshi Frame .
📊 USDT Dominance , after a sharp move toward 6% , got rejected strongly from that level with a powerful candle .
🔻 Following that , it lost its key support and entered a deep corrective phase .
🚀 During this period, Bitcoin and altcoins experienced a strong upward trend , and 🟠 Bitcoin even recorded a new all-time high .
📉 The key support level for USDT Dominance is at 4.12% .
⚠️ If this level is broken, Bitcoin could potentially reach a new all-time high again .
📐 I’ve drawn my Fibonacci from the point where the support was lost , the structure broke , and the previous uptrend turned into a corrective or bearish trend .
🔽 The breakdown of that key support pushed USDT Dominance down to 4.12% , where we saw strong buying pressure in Bitcoin and altcoins, leading to a sharp upward movement.
🔄 Price then retraced to the 0.382 Fibonacci level (4.61%) , acting as a corrective pullback within the ongoing downtrend.
❌ However , this area triggered a rejection , and now we are witnessing another decline in USDT Dominance.
💡 Disclaimer : This analysis is for educational purposes only and should not be considered financial advice . Always do your own research and manage your risk before making any trading decisions .
Bitcoin Range for August?Historically August has been a tough month for crypto in the past with mostly flat to negative returns. For that reason, although not a perfect science, I would not be surprised if we see a rangebound environment continuation for BTC.
So what would that look like? Structurally there are three thirds to the range, currently price is looking to break through into the upper third after bouncing off the bottom third bullish orderblock.
Trade setups will naturally present themselves as rotational plays both bullish and bearish at the extremes of each of the thirds but much larger trades from the range top and bottom.
Altcoins are lagging behind BTC structurally so where BTC has been choppy for a few weeks, most large cap alts have hit their highs and are now looking to settle into a range before the next leg up.

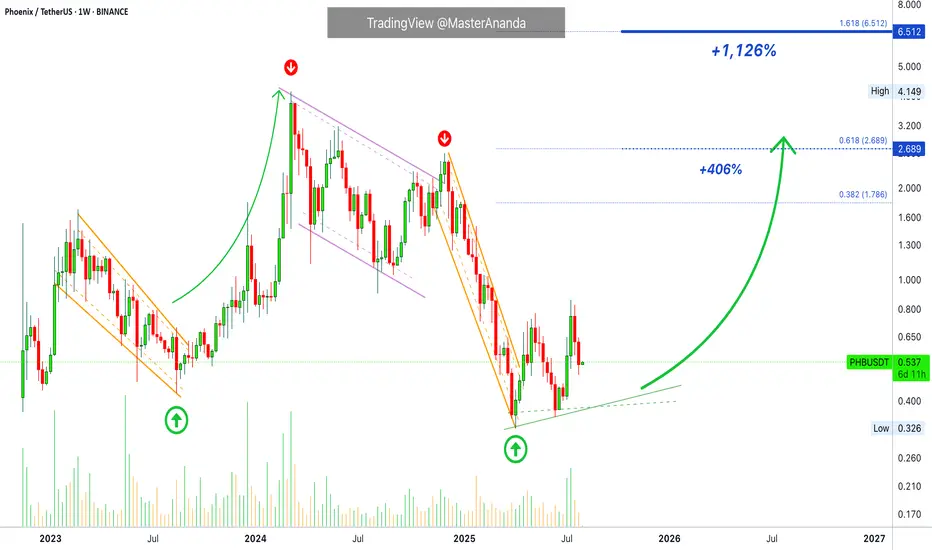
Phoenix Recovers · Easy 1,126% Target @ $6.5 Phoenix is just coming out of a major downtrend. After the main low there was a higher low and rising buy volume. Whenever there is a down wave that ends in strong buying, we know the market is about to turn, we have proof here.
PHBUSDT produced a down move in February 2023. Prices moved lower and a major low happened in August 2023, trading volume started to rise. The rise in volume predicted a change of trend. Then prices also started to rise and we ended up with a bullish wave.
PHBUSDT produced a down move in March 2024, this was a long drawn out correction. The market was moving lower with lower highs, the main one showing up December 2024 and then a major crash. A major low showed up April 2025 and now we are seeing rising volume, the signal that predicted an advance last time. With rising volume and a higher low, we can expect prices to rise next.
And this is it. Phoenix is trading at bottom prices but is slowly starting to recover. Strong bullish action is the next logical step. The market will grow. Crypto will grow. The altcoins are bullish now.
Namaste.
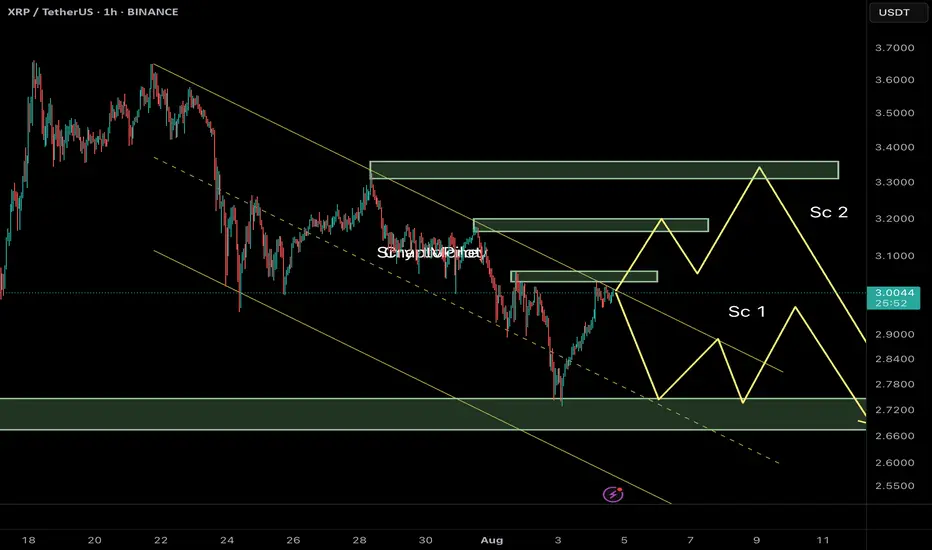
Ripple (XRP/USDT) Technical Analysis – 1H Timeframe🔰 Current Market Context:
After breaking below the ascending channel near $3.50, XRP has entered a corrective phase within a descending channel. Price is now hovering around a mid-range resistance zone, and we can outline two key potential scenarios from here:
⸻
📌 Scenario 1 (Sc1) – Immediate Rejection and Bearish Continuation
In this case:
• Price gets rejected from the current resistance zone ($3.05–$3.10).
• A quick corrective pattern (likely a Zigzag or Flat) plays out.
• XRP moves down to test the next demand zone near $2.70–$2.65, breaking below recent swing lows.
✅ This scenario aligns with the current weak structure and visible sell-side pressure. Liquidity above recent highs has likely been swept, creating a setup for continuation downward.
⸻
📌 Scenario 2 (Sc2) – Extended Correction with a Final Bull Trap
In this case:
• Price pushes higher toward a deeper resistance zone near $3.30–$3.40.
• A liquidity grab above the prior highs triggers a sharper reversal afterward.
• The overall structure could form a Diametric or Complex Correction, suggesting a deeper and more time-consuming wave before resuming the bearish trend.
⛔ This scenario requires strength and acceptance above $3.15, and should be treated as an alternative unless proven by price action.
⸻
🎯 Summary & Trade Strategy:
Scenario 1 is currently more probable unless we see a strong break and close above $3.10. Expectation: XRP may head toward the $2.70–$2.65 demand zone if resistance holds.
⚠️ Avoid entering early. Wait for confirmation via internal BOS (Break of Structure), bearish engulfing near OB zones, or signs of rejection with volume at resistance.
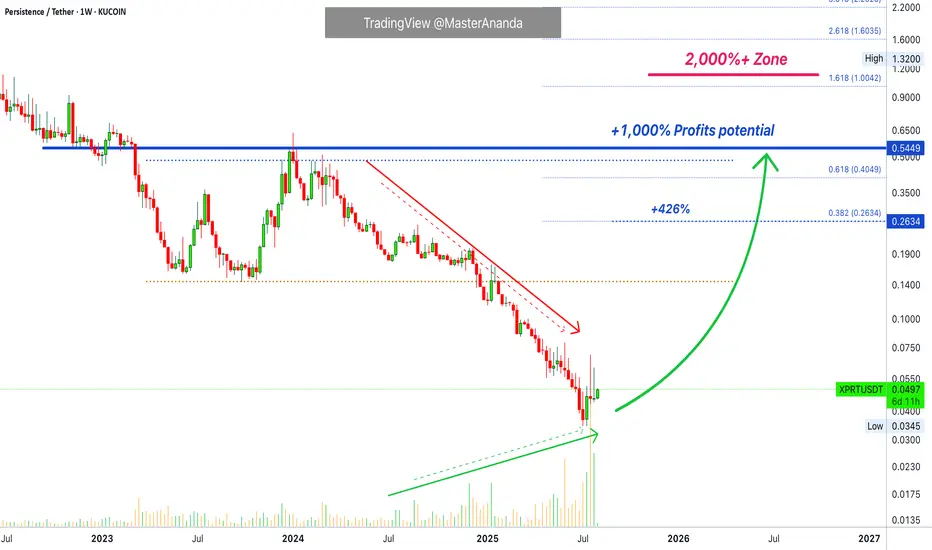
Persistence · Bottom Prices & 2,000% Strong PotentialPersistence. Here we have an interesting chart and trading pair and we start with a volume divergence. What is the divergence? Prices are dropping while volume is rising. XPRTUSDT starts to crash down and as it crashes down volume starts to rise up. And now we have a strong bottom with strong reversal candles. We just witnessed the last market flush. A strong, long and prolonged downtrend will lead to a change of trend.
I like this chart because it has huge potential for growth. Back to baseline prices, which is normally an easy target, in this case strong, give us 1,000% profits potential. As usual, there are low targets for those trading short-term and mid-term and higher targets for those trading long long-term.
The bottom is early but there is still a strong reversal signal because we have a v shaped bottom. A close this week at current prices or higher and we have full technical confirmation. Since we can preempt these movements, we buy before full confirmation because we are bullish on the market and while confirmation is not yet present here other pairs are moving ahead. We know that what one does, the rest follows; When one Crypto recovers, the rest of the market is about to do the same.
We focus on the long-term. We are going up. Short-term, anything goes. Mid- to long-term, watch how prices grow. We are still trading at the bottom, or very close to the bottom and long-term support. This is exactly when the market turns. When everything is down and out for a long while, when long-term holders start to give up, when you are ready to quit, that's when everything changes for the better. Never give up.
Namaste.
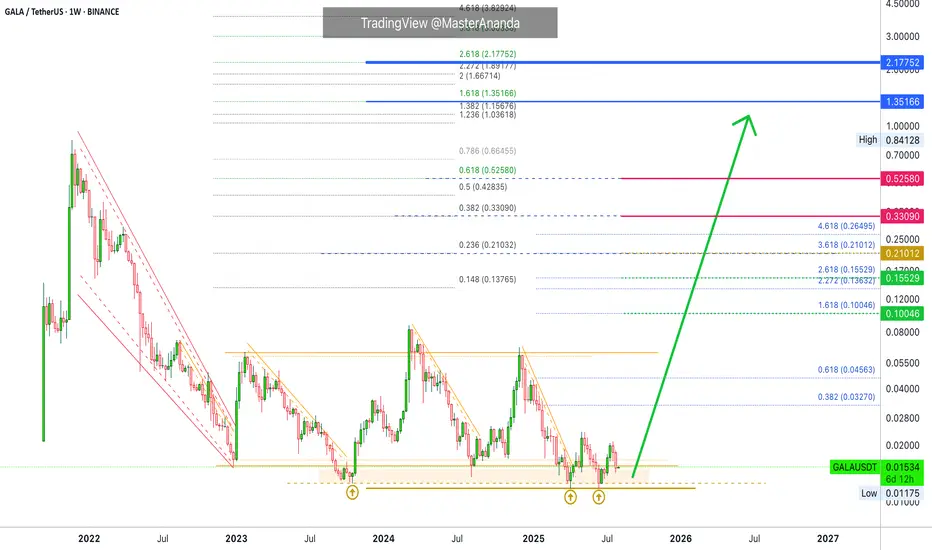
Gala Games Update · Let's Talk Waiting, Patience & TimingThe month is now August 2025. Gala Games closed two weeks red and is now trading back within the "opportunity buy zone." What to expect?
Market conditions have not change. Gala Games (GALAUSDT) is trading at bottom prices. The lowest ever and the lowest possible literally, the opportunity buy zone.
Just a few weeks back, we would look at this zone as a missed opportunity. Now we look at it with disinterest but this is actually the best time possible to buy and hold. This is the best price zone to accumulate in anticipation of what happens next.
The month is now August and we still have five months left in this year. August, September, October, November and December, late 2025. Our predictions, analyses and predictions are all still valid and on-track for a strong bull market in late 2025. There is plenty of time for a bullish cycle to start and develop here. Remember that it can happen that bullish action goes into 2026 and beyond.
Market conditions are great and we are still looking at bottom prices. From the bottom we grow.
Patience is key. This is the best time to accumulate.
Namaste.
04/08/25 Weekly OutlookLast weeks high: $119,809.82
Last weeks low: $111,917.76
Midpoint: $115,863.79
First net outflow for BTC in seven weeks (-$643m) following the FOMC data release and also month end. Yet again no change by the FED but the chances of Septembers FOMC giving us a rate cut has drastically increased, currently at a 78.5% chance of a 25Bps cut.
Month end usually gives us a pullback/sell-off as larger institutions window dress which often includes de-risking somewhat. We saw this last Thursday combined with the weekends typical lower volume has resulted in quite a significant correction for BTC. Altcoins have down the same as many assets reject from HTF resistance areas, the correction has been on the cards and isn't too worrying on the face of it.
What I would say is August seasonality is generally not a bullish month and so expecting price to rebound and extend the rally would go against historical trends. I could see more of a ranging environment taking place for several weeks before any next leg up is possible.
This week I would like to see where altcoins find support and establish a trading range where some rotational setups tend to present themselves.

SUI | Sui Network - Swing Long Idea - Altcoin
📊 Market Sentiment
Market sentiment remains bullish, supported by expectations of a 0.25% rate cut at the upcoming FOMC meeting. The weakening USD and rising risk appetite across global markets are favoring crypto assets in particular.
📈 Technical Analysis
SUI recently gained bullish momentum, largely following Bitcoin's strength.
We’re now seeing a healthy retracement, which is expected after a strong move.
The break of the LTF bullish trendline suggests potential for a deeper pullback toward HTF confluence zones.
📌 Game Plan
I'm eyeing the HTF demand zone around $3.06, which aligns with the 0.5 Fibonacci retracement—a key discount zone.
Just below this, we also have a higher time frame bullish trendline, which could offer dynamic support.
These overlapping levels provide a strong confluence for a swing long idea.
🎯 Setup Trigger
I’ll wait for a 4H bullish break of structure and the formation of an LTF demand zone before entering.
📋 Trade Management
Stoploss: Below 4H demand swing low
Target: Up to $4.44
I’ll trail my stop to lock in profits aggressively along the way.
💬 Like, follow, and comment if this breakdown supports your trading!
More setups and market insights coming soon — stay connected!

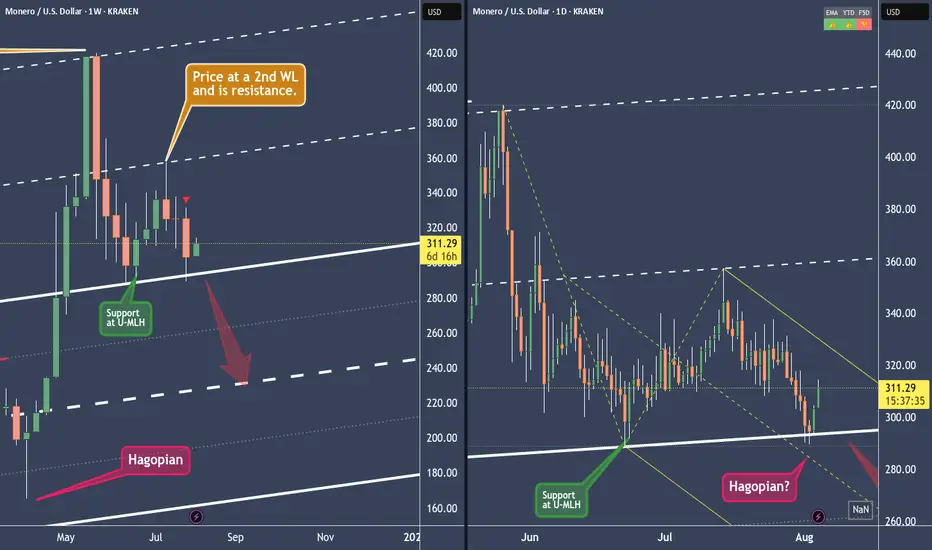
XMRUSD - Monero is strong. But strong enough?Can Monero break the U-MLH of the yellow Fork to stop the down-drift?
In the last post we see that Monero has the potential to reach the white Centerline at around $240. At least this is the view on the weekly Chart.
On the other hand we see support at the U-MLH in the daily Chart.
Until the U-MLH of the yellow Fork isn't breached by a open and close outside, the weekly short projection is in play.
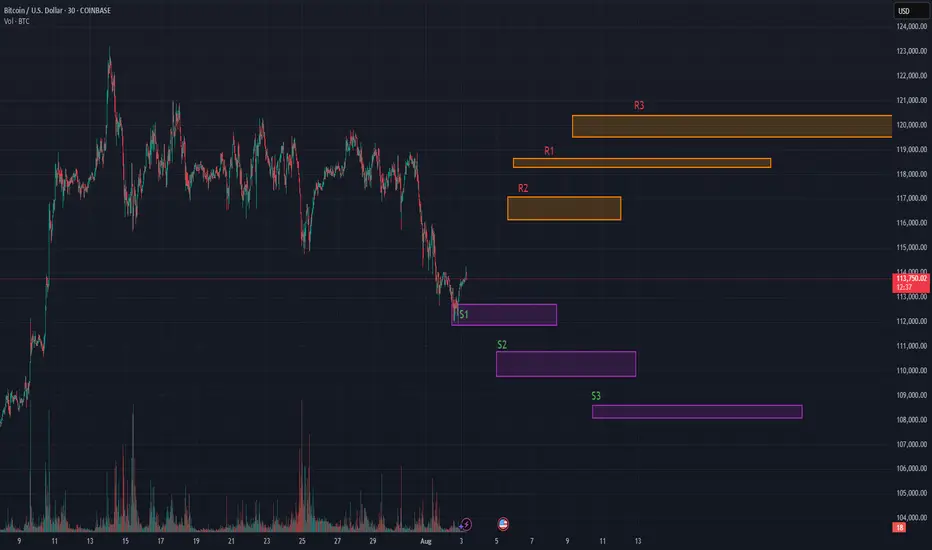
$BTC Breaking Down. Price bleeds, conviction doesn’t.Price bleeds, conviction doesn’t.
This was originally posted previously <24hrs but was hidden due to a link. Here is the pic of the original so you can see S1 bounced perfectly, lets see how much momentum we can get.
OG Thread continued..
Is this the dip worth buying?
BTC is retesting key quant support zones after a high-volume rejection near $116K. Despite the short-term dip, structure remains bullish from a mid-term lens.
• Quant Support Levels
• S1: $112,412
• S2: $110,935
• S3: $108,711
• Resistance Levels:
• R1: $116,113
• R2: $118,337
• R3: $119,814
On chain metrics:
• On-chain data confirms short-term holder capitulation into high-ownership clusters at $112K–$110K.
• Volatility contraction suggests a base-building phase, not a breakdown.
• Cup-and-handle formation remains valid on higher timeframes.
• Institutional Context:
• Accumulation increasing below $115K.
• Analysts projecting breakout potential to $129K–$133K if BTC can reclaim the $116.1K pivot.
Quant traders are eyeing this pullback as a healthy setup — not a breakdown.
I believe these are perfect accumulation levels anywhere in the blue square should be fine for a play to the upside.
Want Quant levels? Let me know!
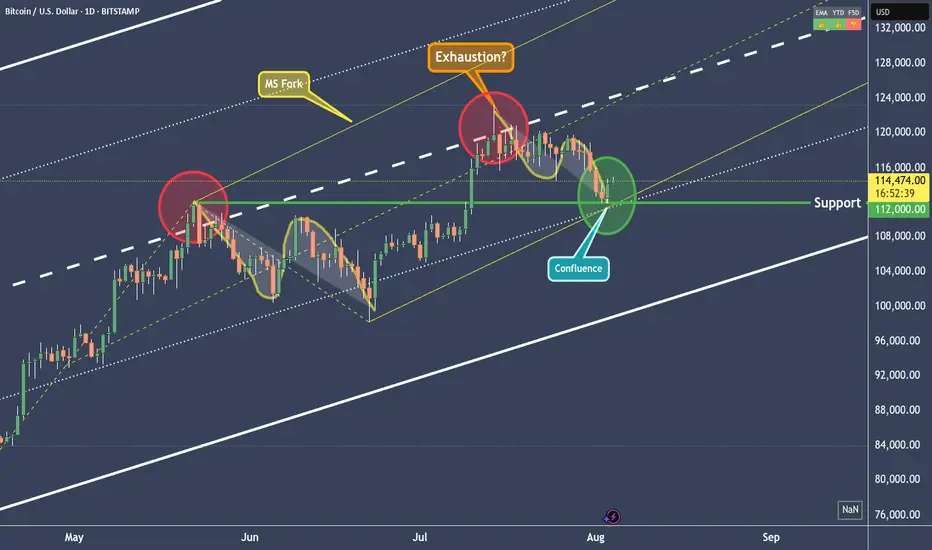
BTCUSD - Right to the point!In the last post (see the Linked Chart), I showed why BTCUSD would fall, and I also pointed out where the first price level for a possible pause might be.
On Friday, that level was reached, and the market seems to be turning *on the dot*. Will we now see higher prices again, or even a new all-time high? Let’s take a closer look:
The “confluence” point is marked by the white fork and the yellow modified Schiff fork. This point lies exactly on the 1/4 line. And this line often indicates temporary levels where at least a pause in the movement can be expected.
When we look at what Bitcoin did at this price level in mid-June, it seems likely that it will rise again. The overall pattern, from the centerline to the 1/4 line, looks extremely similar (see the A-B-C Wave Pattern)!
And yet, I’m not entirely convinced by the picture. Because this was the second time we reached the centerline.
For the brave, this wouldn’t be a bad entry point—or an opportunity to increase the position after this pullback. A possible stop for traders could be placed just below the current low, with targets at the centerline of course.
But why not just lean back, enjoy the profits, and switch into observation mode for now…
I will also make a video that explains the details and connections more clearly.
Happy Monday and stay patient to fight the FOMO! §8-)
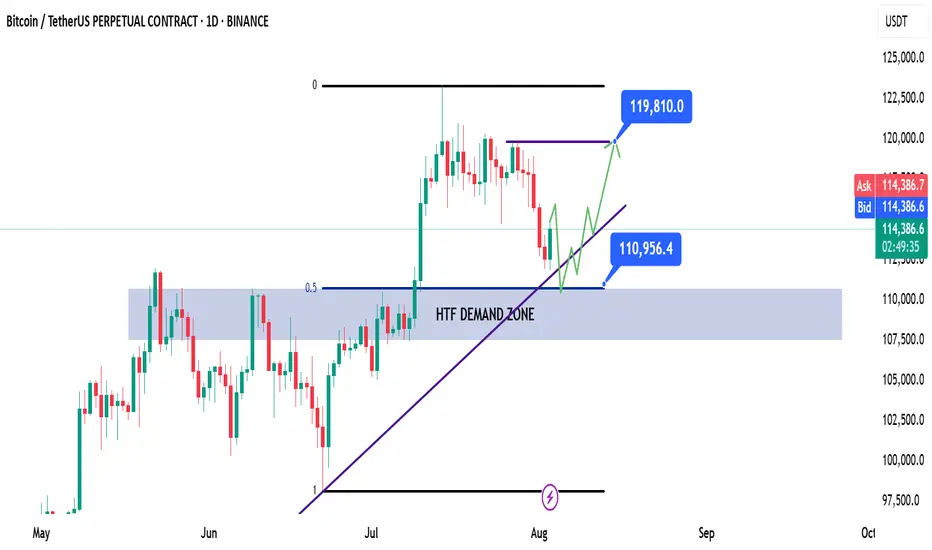
BTC | Bitcoin - Weekly Recap & Gameplan - 03/08/25📈 Market Context:
Traders are currently anticipating a potential 0.25% rate cut at the September FOMC meeting, which continues to support the broader bullish outlook.
While the market pulled back following weaker-than-expected Non-Farm Payroll data, overall sentiment remains optimistic.
Greed has cooled off into a more neutral stance. Historically, August often brings some consolidation or pullbacks — but the structural bias for Bitcoin remains bullish.
🧾 Weekly Recap:
• After printing new all-time highs, BTC began a healthy retracement.
• Price action closely mirrored the Nasdaq's (NQ) pullback during the week.
• We saw a small bounce mid-week, but no strong reversal confirmation yet.
📌 Technical Outlook & Game Plan:
→ I’m watching for price to revisit the long-term bullish trendline.
→ A slight deviation into the HTF demand zone would be ideal for long entries.
→ Bonus confluence: This area also aligns with the 0.5 Fibonacci retracement (Equilibrium level), providing a key discount zone.
🎯 Setup Trigger:
I’ll be watching for a confirmed bullish break of structure (BOS) on the 1H–4H timeframes to signal a reversal.
On confirmation, I’ll look to enter a swing long position.
📋 Trade Management:
• Stoploss: Below the 1H–4H demand swing low
• Take Profit:
→ I’ll trail stops and lock in profits aggressively
→ Main target: $119,820
💬 Like, follow, and comment if this breakdown supports your trading! More setups and market insights coming soon — stay connected!
Bitcoin Dominance & The Fall of AltcoinsBitcoin has sold off sharply in recent session.
Allowing alt coins to capture small percentages of bitcoins liquidity which resulted in epic bullish moves.
Now that Bitcoin is retesting a major moving average (50 MA) we might see BTC recapture some of that crypto dominance.
Other alt coins are well off of their 50 day moving average making them a riskier buy.
When BTC dominance starts to take leadership we often see alt coins and the total market cap sell off.
Bitcoin dominance is hitting a multi year trendline and looks poised to capture some of the alt liquidity.
We still think BTC can sell off and go lower, but on a relative basis it should hold up better than other alt coins & Ethereum.
There are some key nuances that are building and shaping up for a very similar topping formation that occurred in 2021.

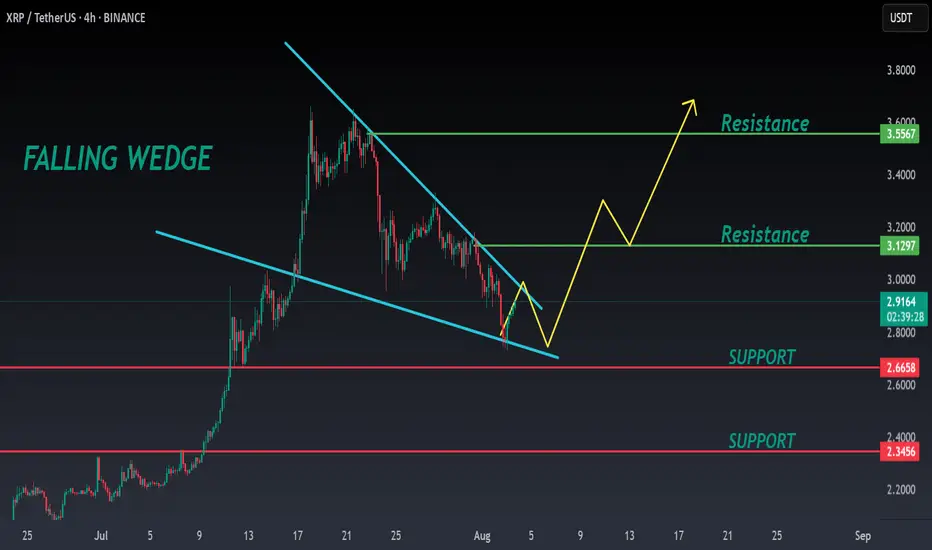
XRP ANALYSIS🔮 #XRP Analysis - Update 🚀🚀
💲 We can see that there is a formation of Falling Wedge Wedge Pattern in #XRP and we can see a bullish movement after a good breakout. Before that we would see a little retest and and then a bullish movement.
💸Current Price -- $2.9130
📈Target Price -- $3.1290
⁉️ What to do?
- We have marked crucial levels in the chart . We can trade according to the chart and make some profits. 🚀💸
#XRP #Cryptocurrency #Breakout #DYOR
Bitcoin Hits $40,000, It Will Recover —Name Your AltcoinSorry, there is a typo there on the title, I meant to say: Bitcoin hits $114,000, soon to recover.
As you can see from our trading range, Bitcoin just went beyond the lower boundary and hit a new low, the lowest since 10-July but there is good news. There isn't room for prices to move much lower, this is part of the consolidation phase.
The first low happened 25-July and notice the high (bear) volume. The second low happens today and we have lower volume compared to 25-July, but Bitcoin hit a lower low. This reveals that the bearish move is already weak and losing force. It also reveals the fact that Bitcoin is about to recover.
Also notice the RSI, 2H. It hit oversold recently and went the lowest in a long while. Reversals tend to happen when the RSI becomes oversold.
Bitcoin is testing the lower boundary of the trading range, when this happens, the action reverses and moves back up. Prepare to see Bitcoin back above $120,000. It is normal and it will happen... But it is wise to give the market a few days. 5-August was bad last year. It gets bad but it also marks the bottom. Once the bottom is hit, growth long-term.
— Name Your Altcoin
Leave a comment with the altcoins you are holding now and I will do an analysis for you. The altcoins will also recover and we are witnessing just a small retrace. Hold strong as this is the most important part. We will have a very strong new bullish wave develop within days.
As Bitcoin moves to test support, it will reverse to test resistance next. Which one is your top altcoins choice?
Thank you for reading.
Namaste.

SAHARA ANALYSIS🔮 #SAHARA Analysis 💰💰
📊 #SAHARA is making perfect and huge rounding bottom pattern in daily time frame, indicating a potential bullish move. If #SAHARA retests little bit and breakout the pattern with high volume then we will get a bullish move📈
🔖 Current Price: $0.1043
⏳ Target Price: $0.1062 and above
⁉️ What to do?
- We have marked crucial levels in the chart . We can trade according to the chart and make some profits. 🚀💸
#SAHARA #Cryptocurrency #Pump #DYOR
