BITCOIN Is the first Bear Cycle RALLY approaching?Bitcoin (BTCUSD) has been on a brutal (but technically anticipated) correction ever since its October 06 All Time High (ATH), registering 6 red candles out of last 7. We have shown in previous analyses why the Bear Cycle has technically started, how the market lost the 1W MA50 (blue trend-line) and is now about to touch the 1W MA100 (green trend-line).
This is the time where we may see a counter-trend rally, the first within this Bear Cycle. First of all, BTC has just completed a total decline of -32.30%, exactly like the January - April 2025 correction and identical to the -33.55% March - August 2024 correction. This is why we project the 86600 - 83600 range as the first technical Support Zone of this Bear Cycle and potential rebound candidate. In the meantime, the 1W RSI is approaching the 30.00 oversold barrier, which further enhances the probabilities for a relief rally.
If materialized, it can technically rise even as high as the 0.618 Fibonacci retracement level, where it may make contact with the 1D MA100 (red trend-line), even above the 1W MA50. The 1D MA200 has been the counter-trend rally rejection trendline and Resistance of the previous two Bear Cycles. Coupled with the 0.618 Fib, it forms a formidable market Resistance Zone.
This rally may coincide with a final stock market rally, what is traditionally called 'the Santa Rally', which is the end-of-year rise on the markets. Technically that can be the perfect Bull Trap that rejects the rebound and resumes the bearish trend towards Lower Lows and eventually the 1W MA200 (orange trend-line).
So do you think we are finally about to see the first rally of this Bear Cycle? Feel free to let us know in the comments section below!
---
** Please LIKE 👍, FOLLOW ✅, SHARE 🙌 and COMMENT ✍ if you enjoy this idea! Also share your ideas and charts in the comments section below! This is best way to keep it relevant, support us, keep the content here free and allow the idea to reach as many people as possible. **
---
💸💸💸💸💸💸
👇 👇 👇 👇 👇 👇
Cryptocurrencies

SOLUSD; Heikin Ashi Trade Idea📈 Hey Traders!
Here’s a fresh outlook from my trading desk. If you’ve been following me for a while, you already know my approach:
🧩 I trade Supply & Demand zones using Heikin Ashi chart on the 4H timeframe.
🧠 I keep it mechanical and clean — no messy charts, no guessing games.
❌ No trendlines, no fixed sessions, no patterns, no indicator overload.
❌ No overanalyzing market structure or imbalances.
❌ No scalping, and no need to be glued to the screen.
✅ I trade exclusively with limit orders, so it’s more of a set-and-forget style.
✅ This means more freedom, less screen time, and a focus on quality setups.
✅ Just a simplified, structured plan and a calm mindset.
💬 Let’s Talk:
💡Do you trade supply & demand too ?
💡What’s your go-to timeframe ?
💡Ever tried Heikin Ashi ?
📩 Got questions about my strategy or setup? Drop them below — ask me anything, I’m here to share.
Let’s grow together and keep it simple. 👊

SUIUSD; Heikin Ashi Trade Idea📈 Hey Traders!
Here’s a fresh outlook from my trading desk. If you’ve been following me for a while, you already know my approach:
🧩 I trade Supply & Demand zones using Heikin Ashi chart on the 4H timeframe.
🧠 I keep it mechanical and clean — no messy charts, no guessing games.
❌ No trendlines, no fixed sessions, no patterns, no indicator overload.
❌ No overanalyzing market structure or imbalances.
❌ No scalping, and no need to be glued to the screen.
✅ I trade exclusively with limit orders, so it’s more of a set-and-forget style.
✅ This means more freedom, less screen time, and a focus on quality setups.
✅ Just a simplified, structured plan and a calm mindset.
💬 Let’s Talk:
💡Do you trade supply & demand too ?
💡What’s your go-to timeframe ?
💡Ever tried Heikin Ashi ?
📩 Got questions about my strategy or setup? Drop them below — ask me anything, I’m here to share.
Let’s grow together and keep it simple. 👊

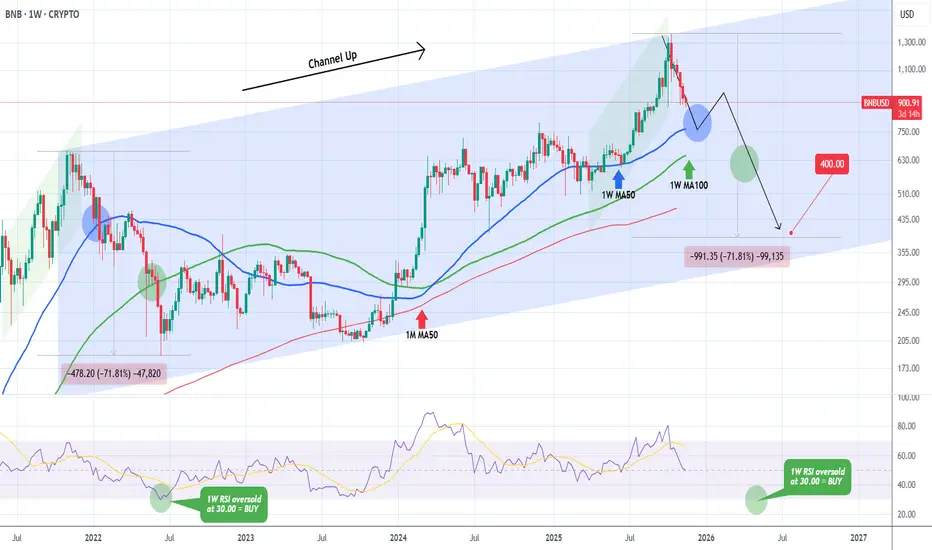
BNBUSD Bear Cycle started and can even crash to $400.Binance Coin (BNBUSD) is currently on its 4th straight red week (and 5 in the last 6), declining aggressively following the October 13 All Time High (ATH). That was also a technical Higher High for the 4-year Channel Up that started following the November 01 2021 Top of the previous Cycle.
As you can see the sequences that led to both Channel Up tops are similar. Technically this implies that the recent 6 week decline is the start of the new Bear Cycle (Bearish Leg for the Channel Up).
The price is now approaching the 1W MA50 (blue trend-line), which is the first Support, with the 1W MA100 (green trend-line), this time right below it.
Technically, we could see this Bear Cycle decline by as much as the previous one, -71.81%, and hit $400 before it bottoms. A solid indicator for when to buy BNB during this correction, is the 1W RSI hitting 30.00 (oversold), as it did on June 13 2022, which market the Cycle's bottom.
---
** Please LIKE 👍, FOLLOW ✅, SHARE 🙌 and COMMENT ✍ if you enjoy this idea! Also share your ideas and charts in the comments section below! This is best way to keep it relevant, support us, keep the content here free and allow the idea to reach as many people as possible. **
---
💸💸💸💸💸💸
👇 👇 👇 👇 👇 👇
BITCOIN Is all hope lost for the Bull Cycle?First of all allow me to begin by saying this: IT IS NEVER FUN to call market tops. Especially on long-term charts, especially on Bitcoin/ crypto. And the reason is that, usually it violently traps most people in. Either for a long time or until they lose all capital. And nobody should take joy in this and as chief analyst here at Tradingshot, I am no exception.
Regardless of that, our thesis here has been pretty simple and for a long time we've been calling for an October exit, as that was when the 4-year Cycle Theory suggested the Bull Cycle would top. I personally hope I am wrong but in all my decades of investing, I learned that 'hope' doesn't get you far here, quite the contrary it teaches you brutal (and often very expensive lessons). The hard facts and historical evidence, point to a new Bear Cycle. And we will keep presenting the charts, the empirical evidence no matter how many followers we lose or how many negative comments we see as they mean nothing to us. Profit making only does.
Now that I got this out of the way, let's see what other key levels Bitcoin (BTCUSD) hit. Yesterday's aggressive decline saw the market making a Low marginally below the Higher Lows trend-line (bottom) of the 3-year Channel Up. Essentially that has been the dominant pattern of the whole Bull Cycle. BTC already closed below its 1W MA50 (blue trend-line) last week, which has historically been a Bear Cycle confirmation, already lost the basic structure of its Bull Cycle rallies by breaking way below the 0.382 Fibonacci retracement level from the previous Higher Low and now faces with the complete breakdown of the pattern - crossing below its bottom.
Needless to say, if BTC closes the week below it, selling could accelerate, with the 1W MA100 (green trend-line), being the market's next long-term Support, where a counter-trend bounce could be possible.
So is this Higher Lows trend-line the last hope of the Bull Cycle? Feel free to let us know in the comments section below!
---
** Please LIKE 👍, FOLLOW ✅, SHARE 🙌 and COMMENT ✍ if you enjoy this idea! Also share your ideas and charts in the comments section below! This is best way to keep it relevant, support us, keep the content here free and allow the idea to reach as many people as possible. **
---
💸💸💸💸💸💸
👇 👇 👇 👇 👇 👇

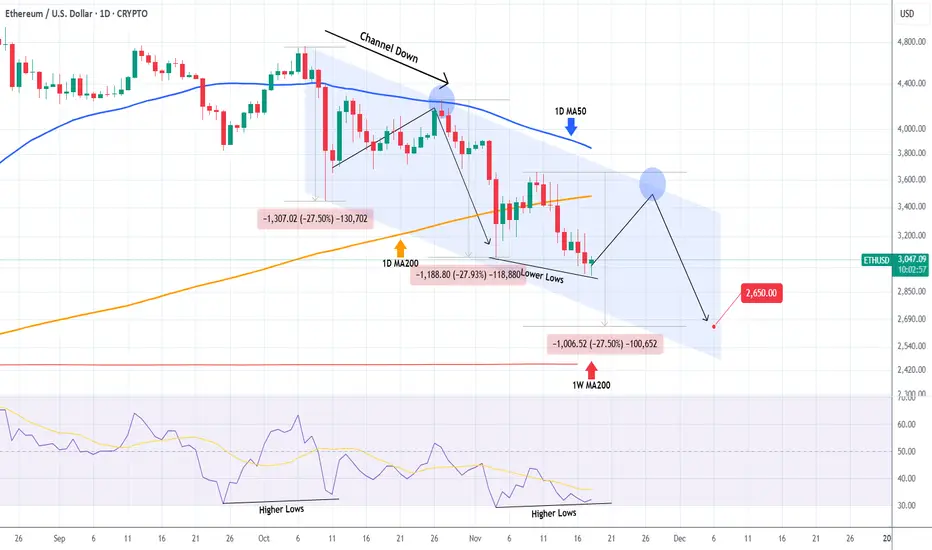
ETHEREUM Dead cat bounce incoming?Ethereum (ETHUSD) has been trading within a Channel Down since the October 07 High with both its Bearish Leg so far declining by -27.50% each.
As the 1D RSI is forming Higher Lows against the price's Lower Lows, i.e. a Bullish Divergence similar to October 11, it is possible to see a short-term bounce to test the 1D MA50 (blue trend-line) again (where the price got rejected on October 27), before it completes the -27.50% Bearish Leg projection.
The medium-term Target remains 2650.
---
** Please LIKE 👍, FOLLOW ✅, SHARE 🙌 and COMMENT ✍ if you enjoy this idea! Also share your ideas and charts in the comments section below! This is best way to keep it relevant, support us, keep the content here free and allow the idea to reach as many people as possible. **
---
💸💸💸💸💸💸
👇 👇 👇 👇 👇 👇
BITCOIN The 1W MA50 Bear confirmation you didnt want, happened..Bitcoin (BTCUSD) just closed last week below its 1W MA50 (blue trend-line) for the first time since March 06 2023. Since that break-out, the 1W MA50 had been tested and held on 3 major occasions within the Bull Cycle, providing the most optimal mid-Cycle entries during those 2.5 years.
What's even more important than this time distance, is the fact that every 1W candle closing below the 1W MA50 has always marked/ confirmed the start of the new Bear Cycle historically. This is something that we've presented to you and discussed numerous times this year, as we were analyzing BTC's 4-year Cycle theory and why October was the most likely Cycle Top candidate time-wise.
This time we are looking at the previous Cycle more specifically, due to the strong similarities so far leading to the current Top. First of all the end-of-Cycle rallies on both started after a clear test and rebound on the 1W MA50. At the same time, the both displayed Higher Highs, against the 1W RSI's Lower Highs, which is a huge Bearish Divergence and the first strong indication that the Cycle Top may be forming.
The Cycle Top on both came when the 1W RSIs were 70.00. Also the 1W MA50 break-out took place around the 0.382 Fibonacci level from the last test/ rebound. As you may realize, there is a high degree of symmetry here both price-wise and in terms of RSI. If that continues, we can expect the Bear Cycle bottom to be at least on the 1.618 Fibonacci extension at $55000.
So do you think that the closing below the 1W MA50 has confirmed the new Bear Cycle? Feel free to let us know in the comments section below!
---
** Please LIKE 👍, FOLLOW ✅, SHARE 🙌 and COMMENT ✍ if you enjoy this idea! Also share your ideas and charts in the comments section below! This is best way to keep it relevant, support us, keep the content here free and allow the idea to reach as many people as possible. **
---
💸💸💸💸💸💸
👇 👇 👇 👇 👇 👇

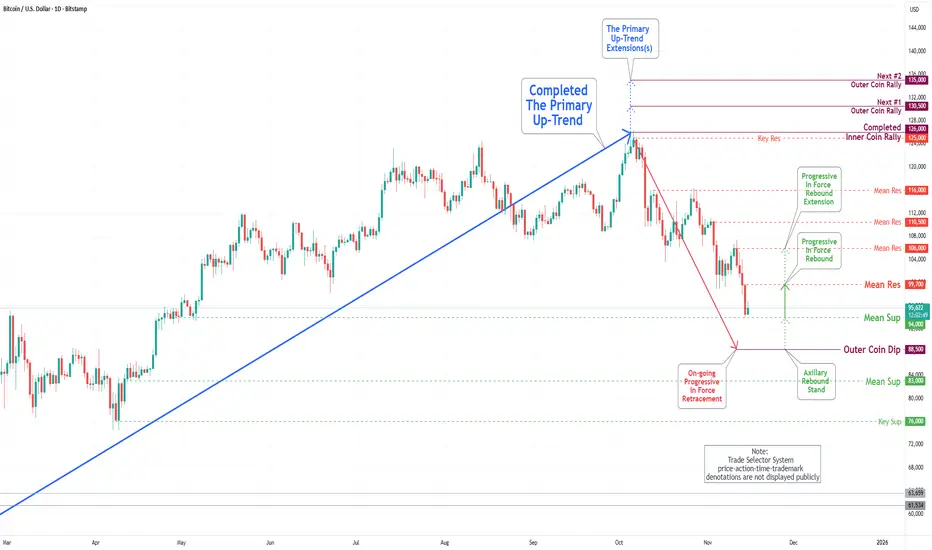
Bitcoin(BTC/USD) Daily Chart Analysis For Week of Nov 14, 2025Technical Analysis and Outlook:
In the most recent trading session, the Bitcoin market has undergone a significant drawdown over the past week, reaching the Mean Support level of 99,000. Additionally, it has completed the Outer Coin Dip at 97,000. Compounding these challenges, the price has also declined to the Key Support level of 94,000, where trading activity is currently concentrated.
At this time, the price is being maintained within a trading range defined by the Mean Resistance at 99,700 and the Mean Support (Former Key Support) at 94,000, with a slight probability of an extension to the Mean Support level at 106,000. Nonetheless, it is crucial to acknowledge the considerable potential for pullbacks at these critical resistance levels.
BITCOIN on a 6-month Low! Bear Cycle starting based on GOLDBTC?Bitcoin (BTCUSD) hit $96000 today for the first time in 6 months (since May 07). For a long time we presented evidence (spearheaded by the 4-year Cycle) of why October was a strong candidate for a market top and so far this continuous correction validates all the data.
Today we circle back to an old favorite of ours, the GOLDBTC ratio. During the previous Bull Cycle, a Double Bottom on that ratio was what confirmed the start of BTC's 2022 Bear Cycle. On the current Cycle, we had this Double Bottom in August and since then, the GOLDBTC ratio has been rising.
Even on previous Cycles, a rise on this ratio always coincided with a BTC Bear Cycle. Based on that evidence too, the next Bitcoin Bear Cycle should be over before 2026 ends.
As a side-note for investors, keep in mind that a rise on the GOLDBTC ratio doesn't necessarily mean that Gold will rise while only Bitcoin falls. Both can fall at the same time, the ratio highlights pace, it just indicates that Gold can also decline in value but less aggressively than Bitcoin.
So are we in a Bitcoin Bear Cycle? Feel free to let us know in the comments section below!
---
** Please LIKE 👍, FOLLOW ✅, SHARE 🙌 and COMMENT ✍ if you enjoy this idea! Also share your ideas and charts in the comments section below! This is best way to keep it relevant, support us, keep the content here free and allow the idea to reach as many people as possible. **
---
💸💸💸💸💸💸
👇 👇 👇 👇 👇 👇

HYPERLIQUID Massive H&S targets $30 and $19 long-term.Hyperliquid (HYPEUSD) has formed a Head and Shoulders (H&S) pattern, a highly symmetrical structure that is has completed its Right Shoulder. At the same time, a Channel Down has emerged that is aiming for a -43.87% decline on the current Bearish Leg, similar to the previous one, targeting $30.00 short-term.
The H&S long-term Target is the 2.0 Fibonacci extension, which as you can see matches the 0.618 Fib from the April 07 bottom. That gives a $19.00 Target.
Notice the huge 1D RSI Bearish Divergence of Lower Highs since May 25, which further strengthens the long-term bearish trend.
---
** Please LIKE 👍, FOLLOW ✅, SHARE 🙌 and COMMENT ✍ if you enjoy this idea! Also share your ideas and charts in the comments section below! This is best way to keep it relevant, support us, keep the content here free and allow the idea to reach as many people as possible. **
---
💸💸💸💸💸💸
👇 👇 👇 👇 👇 👇

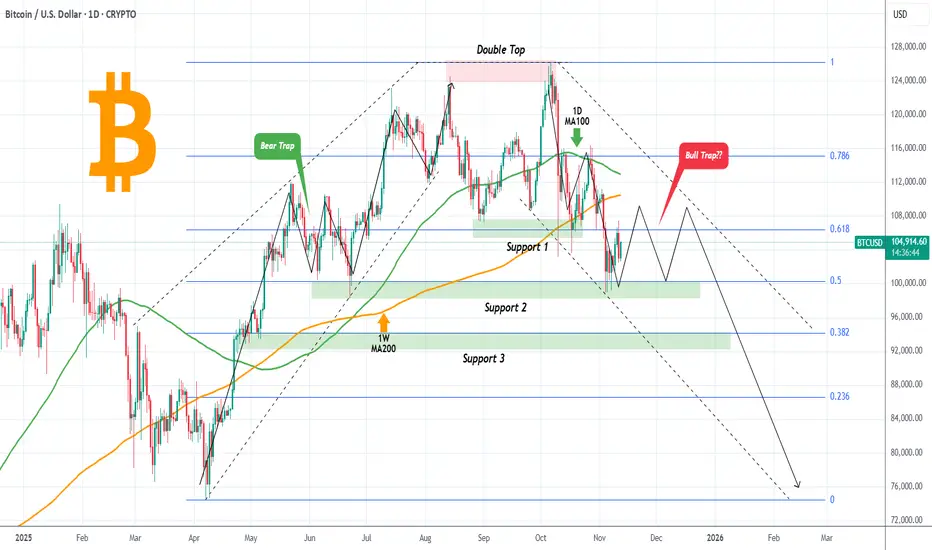
BITCOIN Is it following a symmetric downtrend?Bitcoin (BTCUSD) recently broke below the $100000 level for the first time since June and is currently on a short rebound. It has turned however all major MAs both the 1D MA100 (green trend-line) and 1D MA200 (orange trend-line) into Resistances, so the downtrend remains.
By doing so, we can see a highly symmetric pattern emerging, the inverse of the April - August uptrend. Following the (nearly) October 06 Double Top, the symmetrical downtrend has been testing and respecting all subsequent Support levels (so far Support 1 and 2), filling at the same time all Fibonacci gaps. See how accurately those Fibs formed key demand levels during the uptrend.
As a result, if this symmetry continues to hold, we can expect BTC to trade sideways for another month between Support 2 (Fib 0.5) and $110000 (roughly) before making the next leg down. Such price behavior typically confuses market participants and traps traders who stick to the former trend and haven't adapted yet.
Will it happen this time also and this potential ranged trading trap more buyers? Feel free to let us know in the comments section below!
---
** Please LIKE 👍, FOLLOW ✅, SHARE 🙌 and COMMENT ✍ if you enjoy this idea! Also share your ideas and charts in the comments section below! This is best way to keep it relevant, support us, keep the content here free and allow the idea to reach as many people as possible. **
---
💸💸💸💸💸💸
👇 👇 👇 👇 👇 👇
SOLANA entered into bearish territory, targeting $105.Solana (SOLUSD) closed last week below its 1W MA50 (blue trend-line) for the first time since July 28 2025. This is an extension of the downtrend that started following the September 15 High, which took place right below the Resistance Zone that started back on the November 2021 Cycle Top.
This is a critical Resistance as it rejected the price another 2 times during this Bull Cycle, with the most recent causing the January - April correction to the 1W MA200 (orange trend-line).
Given the huge 1W RSI Bearish Divergence for almost 2 years now (Lower Highs), we expect last week's closing below the 1W MA50 to initiate the bearish extension towards the 1W MA200 (at least) again. Our Target is $105.00.
---
** Please LIKE 👍, FOLLOW ✅, SHARE 🙌 and COMMENT ✍ if you enjoy this idea! Also share your ideas and charts in the comments section below! This is best way to keep it relevant, support us, keep the content here free and allow the idea to reach as many people as possible. **
---
💸💸💸💸💸💸
👇 👇 👇 👇 👇 👇

BITCOIN Did the 1W MA50 just save the day again?Bitcoin (BTCUSD) just closed last week above its 1W MA50 (blue trend-line) even though it broke below it during the day.
Since the March 13 2023 break-out above the 1W MA50, this is the 4th time that BTC breaks below it but manages to close the 1W candle above it. All of those times (including the additional one of September 11 2023), marked market bottoms, Higher Lows for the 3-year Channel Up and initiated the Bull Cycle's strong rallies.
However every rally has been weaker and since the first one topped in March 2024, we have a huger Bearish Divergence on the 1W RSI of Lower Highs against BTC's Higher Highs, showcasing loss of strength for the trend. A natural feat however, as the Bull Cycle tends to be stronger on its start as it rebounds violently from the market bottom and less strong towards the end as it matures and big positions already start to take profits.
But is this the end of the Cycle? The 4-year Cycle Theory, the DXY bottoming, the 1W RSI Bearish Divergence among others, all say 'yes'. But the Bear Cycle can only be technically confirmed when the market closes that 1W candle below its 1W MA50 and so far it hasn't. Is that enough to rely your strategy on from this point onwards?
So has the 1W MA50 just saved the day again for Bitcoin? Feel free to let us know in the comments section below!
-------------------------------------------------------------------------------
** Please LIKE 👍, FOLLOW ✅, SHARE 🙌 and COMMENT ✍ if you enjoy this idea! Also share your ideas and charts in the comments section below! This is best way to keep it relevant, support us, keep the content here free and allow the idea to reach as many people as possible. **
-------------------------------------------------------------------------------
💸💸💸💸💸💸
👇 👇 👇 👇 👇 👇

SOL aint looking that goodYes, the market structure isn't really broken and it hasn't lost any major support
Yes, it can go higher, a lot higher,
and yes it's been one of the best performers of this cycle .
Which makes it rather risky to short it. But it doesn't change the fact that it:
- Failed to beat critical levels
- By being one of the best performers, retail is loving it.
- Everyone is too comfy in longs.
The level i had for SOL back in last year happened to be the exact bottom, so I'm being cautious here.

BTC - What if #1What a move corn, what a move.
Although it's a what if for, becomes an expectation when i see that bear div on rsi.
An impulsive move like this may very well complete as diagonal, and when you see diagonals at the highs with HTF divs, you run away.
If that happens to work, i'd not think for a second to buy that dip as the expection should be new highs, but i'd not be married to that idea - which takes me to the 2nd idea :

XRPUSD Has it started its Bear Cycle already?XRP (XRPUSD) has been trading within a Channel Up ever since the March 09 2020 bottom of the COVID flash crash. Even though the recent Bull Cycle didn't hit the pattern's Top (Higher Highs), signs have emerged that the new Bear Cycle may have started.
The most obvious of those are the break (and closing) below the 1W MA50 (blue trend-line). Last month's flash crash even touched the 1W MA100 (green trend-line) before immediately recovering.
Most importantly, XRP already filled the 2.5 Fibonacci extension level with its July 14 2025 All Time High (ATH), which is exactly where the High of the previous Cycle was priced (April 12 2021). What followed afterwards, especially when it closed a week below the 1W MA50 (November 29 2021) is very similar to what has been taking place in the past 3 months (especially with the 1W MA50 break 30 days ago) and the similarities between the 1W RSI patterns further justify it.
As a result, since the 2022 Bear Cycle bottomed on the 1M MA100 (red trend-line) and just below its 0.618 Fibonacci retracement level, we expect the current to do the same and target $0.9000 (Fib 0.618). An additional indicator that may help at identifying the bottom (hence a good level to start buying again), is when the 1W RSI breaks below its 30.00 oversold barrier.
-------------------------------------------------------------------------------
** Please LIKE 👍, FOLLOW ✅, SHARE 🙌 and COMMENT ✍ if you enjoy this idea! Also share your ideas and charts in the comments section below! This is best way to keep it relevant, support us, keep the content here free and allow the idea to reach as many people as possible. **
-------------------------------------------------------------------------------
💸💸💸💸💸💸
👇 👇 👇 👇 👇 👇

BITCOIN 's Bear Cycle has started according to the Dollar.It is one of the oldest charts around. Bitcoin (BTCUSD) vs U.S. Dollar Index (DXY). And perhaps one of the most accurate or to phrase it better, one of the most informative.
As you can see, every time the DXY (black trend-line) bottoms and rebounds (green Arcs), BTC tops and corrects (red Arcs), initiating its Bear Cycle.
Right now the news are far from favorable for Bitcoin's Bull Cycle case as the Dollar has broken above the previous Lower High and continues to rebound. That's a potential bottom, hence high probabilities for BTC to start a new Bear Cycle.
Would you trust this chart? Feel free to let us know in the comments section below!
-------------------------------------------------------------------------------
** Please LIKE 👍, FOLLOW ✅, SHARE 🙌 and COMMENT ✍ if you enjoy this idea! Also share your ideas and charts in the comments section below! This is best way to keep it relevant, support us, keep the content here free and allow the idea to reach as many people as possible. **
-------------------------------------------------------------------------------
💸💸💸💸💸💸
👇 👇 👇 👇 👇 👇

ETHEREUM hit its 1W MA50. Can this save the Bull market?Ethereum (ETHUSD) just hit its 1W MA50 (blue trend-line) for the first time in 4 months since it broke above it on the week of July 07 2025. This pattern looks very similar to the 1W tests after the March 11 2025 and November 08 2021 Highs (latter as also a Cycle Top).
In both cases the 1W MA50 failed to hold as a Support (did also the same on the Jan 13 2025 test) and the price declined further completing -48% and -52% total drops respectively.
As a result, there are high probabilities currently for ETH to extend its decline by at least -48%, in which case it may reach $2600.
Based on the 1W RSI, the most probably level for a bounce is the 38.50 (RSI) level, which is the Symmetrical Support that initiated the rebounds of September 02 2024 and January 24 2022. The September 18 2023 and November 07 2022 Lows also came very close to it and rebounded.
-------------------------------------------------------------------------------
** Please LIKE 👍, FOLLOW ✅, SHARE 🙌 and COMMENT ✍ if you enjoy this idea! Also share your ideas and charts in the comments section below! This is best way to keep it relevant, support us, keep the content here free and allow the idea to reach as many people as possible. **
-------------------------------------------------------------------------------
💸💸💸💸💸💸
👇 👇 👇 👇 👇 👇

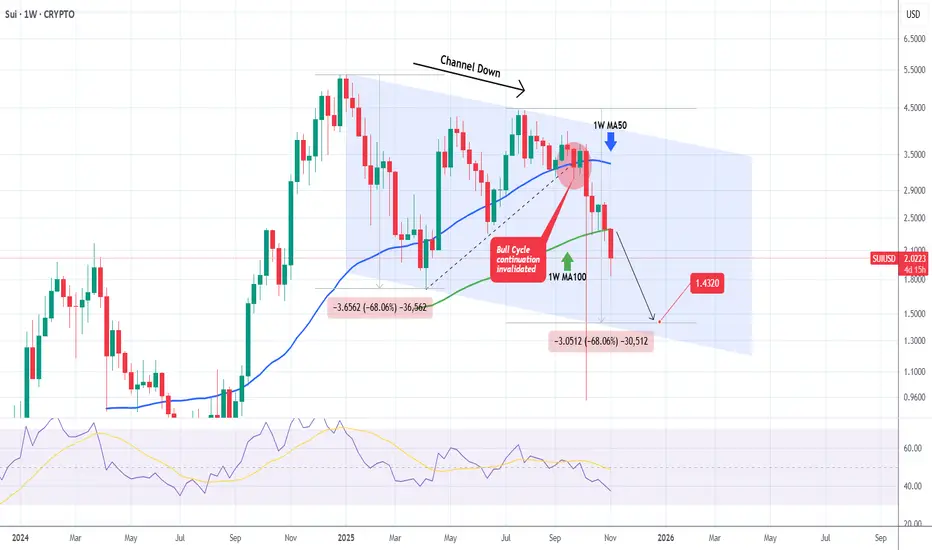
SUIUSD Channel Down to accelerate more selling towards 1.4320.Sui (SUIUSD) has established a Channel Down on the 1W time-frame, trading under Lower Highs since the December 30 2024 High. The Bull Cycle got invalidated on September 22 2025 when the price broke below the inner Higher Lows trend-line (dashed) and this week may confirm the new Bear Cycle as it will most likely close a 1W candle below the 1W MA100 (green trend-line).
We expect the current decline to repeat at least the -68.06% drop of the first Bearish Leg of the pattern and targe 1.4320.
-------------------------------------------------------------------------------
** Please LIKE 👍, FOLLOW ✅, SHARE 🙌 and COMMENT ✍ if you enjoy this idea! Also share your ideas and charts in the comments section below! This is best way to keep it relevant, support us, keep the content here free and allow the idea to reach as many people as possible. **
-------------------------------------------------------------------------------
💸💸💸💸💸💸
👇 👇 👇 👇 👇 👇
BITCOIN and stocks, 2021 vs 2025...Bitcoin (BTCUSD) could be entering a new Bear Cycle and as we've mentioned a few times recently, the 1W MA50 (blue trend-line) will play a big part at deciding that. This is basically the level that BTC is testing right now.
What may seem surprising to some, is that while Bitcoin has been correcting, the stock market (S&P500 illustrated by the black trend-line) has been rising making All Time High (ATH) after All Time High. This is not uncommon towards the end of Bull Cycles and has been particularly relevant during the Top of the previous (2021) Cycle.
As you can see, Bitcoin topped 7 weeks before stocks did, as we witnessed heavy profit taking and rotation of those (extraordinary) crypto gains towards stocks. Even the 1W RSI Lower Highs structure is similar between 2021 and 2025. The 4-year Cycle Theory in full confirmation (so far).
If the pattern plays out the exact same way time-wise as in 2021 (often it doesn't), we should be expecting stocks to top around the week of November 24. As for Bitcoin's trend after, following the 2022 blueprint wouldn't be unreasonable at all, as a 1W candle closing below the 1W MA50 would open the way to a 1W MA100 (green trend-line) test, multiple months of ranged price action between the two and then violent crash towards the 1M MA100 (red trend-line).
So do you think Bitcoin has topped and if yes, are stocks about to follow soon? Feel free to let us know in the comments section below!
-------------------------------------------------------------------------------
** Please LIKE 👍, FOLLOW ✅, SHARE 🙌 and COMMENT ✍ if you enjoy this idea! Also share your ideas and charts in the comments section below! This is best way to keep it relevant, support us, keep the content here free and allow the idea to reach as many people as possible. **
-------------------------------------------------------------------------------
💸💸💸💸💸💸
👇 👇 👇 👇 👇 👇

BITCOIN 's worst Uptober in 11 years. Will selling continue?Bitcoin (BTCUSD) just closed October on a -3.89% loss, marking only the second red October since 2018 (-3.83%) and the worst since 2014 (-12.95%). This comes against the popularized 'Uptober' moniker, which relates to BTC's historically strong gains for this month.
So what's next? Things may get even worse if BTC repeats the Jan - Feb 2025 fractal and breaks below its current Higher Lows trend-line. As you can see, since the August 14 2025 High, the market has been on a similar pattern as December 2024 - February 2025.
Right now we are on the rejection made on the Lower Highs 2 trend-line (blue circle) on the 1D MA50 (blue trend-line) and on the 0.5 Fibonacci retracement level. With the first Lower Highs 2 rejection being similar among the two fractals (around -17%), we can expect an equally symmetrical sell-off if the Higher Lows break.
On February 24 2025, that break-out completed a -32% fall from its All Time High (ATH) just below the 2.0 Fibonacci extension. If the Higher Lows break-out does happen on the current sequence as well, we may see another -32% decline, which this time is exactly on the 2.0 Fib ext. This time we have the 1W MA100 (red trend-line) to be mindful of, where we can expect contact to be made around $87000.
Do you think BTC can dip this low? Feel free to let us know in the comments section below!
-------------------------------------------------------------------------------
** Please LIKE 👍, FOLLOW ✅, SHARE 🙌 and COMMENT ✍ if you enjoy this idea! Also share your ideas and charts in the comments section below! This is best way to keep it relevant, support us, keep the content here free and allow the idea to reach as many people as possible. **
-------------------------------------------------------------------------------
💸💸💸💸💸💸
👇 👇 👇 👇 👇 👇

Bitcoin(BTC/USD) Daily Chart Analysis For Week of Oct 31, 2025Technical Analysis and Outlook:
The trading session from last week was notably eventful. The Bitcoin market experienced significant volatility, fluctuating between the Mean Resistance level of 116,000 and the critical Mean Support level of 106,500. Currently, the price is actively navigating this range.
Current market analysis indicates a likelihood of a retest toward the Mean Support level at 106,500, with a primary focus on the potential for further downward movement towards the Mean Support level of 101,000. This trajectory may ultimately lead to our key objective of reaching the Outer Coin Dip at 97,000. It is, however, essential to acknowledge the robust rebound potential at these pivotal levels.

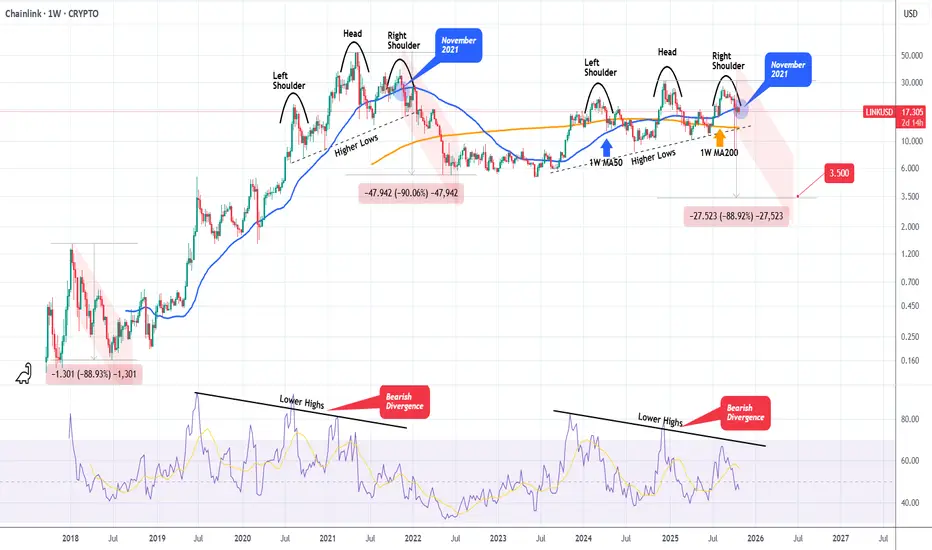
LINKUSD Massive Head and Shoulders starting the new Bear Cycle. Chainlink (LINKUSD) has been steadily rising within a Channel Up during this Bull Cycle but on the recent August 18 2025 High, it failed to make a Higher High and got rejected instead.
The Channel Up seems to have transitioned into a Head and Shoulders (H&S) pattern, while the 1W RSI has been on a Bearish Divergence (Lower Highs trend-line against the price's Higher Highs).
We saw a similar H&S forming at the end of the previous Bull Cycle (2021), which essentially paved the way to the 2022 Bear Cycle. Symmetrically it appears to also work quite well as right now we are on a similar spot (1W MA50, blue trend-line) as November 2021.
The two Bear Cycles of LINK declined by -88.90% and -90.00% respectively. As a result, if history repeats, we are looking at a potential bottom at at least $3.500 (-88.90%).
Do you think that's a realistic expectation?
-------------------------------------------------------------------------------
** Please LIKE 👍, FOLLOW ✅, SHARE 🙌 and COMMENT ✍ if you enjoy this idea! Also share your ideas and charts in the comments section below! This is best way to keep it relevant, support us, keep the content here free and allow the idea to reach as many people as possible. **
-------------------------------------------------------------------------------
💸💸💸💸💸💸
👇 👇 👇 👇 👇 👇