Is Solana about to top?Solana is currently trading just below the target box outlined by the black primary count.
I continue to expect that, over the coming days and weeks, price will eventually reach this zone before any pattern develops that could threaten the red dotted line support areas shown on the below chart.
Cryptolevels

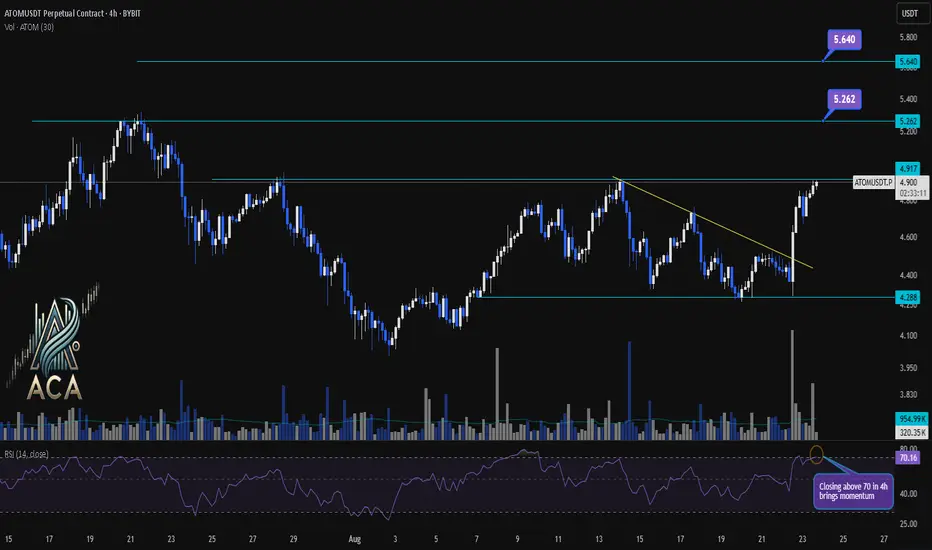
ATOMUSDT 4H Chart Analysis | Momentum Breakout in PlayATOMUSDT 4H Chart Analysis | Momentum Breakout in Play
🔍 Let’s dive into the ATOM/USDT perpetual contract and analyze the latest price action, outlining key bullish setups and momentum signals.
⏳ 4-Hour Overview
The 4-hour chart reveals a strong bullish push, with price surging above the trendline resistance and reclaiming the local $4.917 zone. Volume has notably increased, confirming the move’s strength. Meanwhile, the RSI indicator is closing above 70, marking the overbought territory and highlighting a surge in buyer momentum.
🔺 Long Setup:
On the upside, sustained momentum could ignite a rally toward $5.262 first, with a further target at $5.640 should follow-through buying persist. These levels line up with previous resistance zones and potential trend-based extensions.
📊 Key Highlights:
- 4H breakout confirms bullish bias and momentum shift.
- Volume spike adds conviction to the move.
- RSI closing above 70 signals strong momentum; a continuation could bring further upside.
- Short-term resistance targets are $5.262 and $5.640.
- “Closing above 70 in 4h brings momentum” — if sustained, might hint at a new trend leg.
🚨 Conclusion:
ATOM/USDT is showcasing renewed bullish momentum. Watch for confirmations above resistance and be mindful of short-term exhaustion signals in the overbought zone. If momentum holds, upside targets at $5.262 and $5.640 are in play.
Bitcoin Eyes $100K Re-Entry: Retest, Support Zone,Then Push 130kChart Analysis
1. Price Structure & Trendlines
The chart displays a former upward trendline that has been broken, leading to a corrective pullback.
Following that, price is perched within a “retest zone” (the red-shaded rectangle), which aligns with both historical horizontal resistance—now turning into support—and an area of previous consolidation. This is a classic setup: price often retests key breakout levels before resuming its move.
2. Support Levels
The main support is clearly drawn around the $100K zone, highlighted by a grey bar below the retest zone. This is a psychological and structural area to watch for potential strong buying.
Immediate support appears near $110K–$112K, as noted by the lower edge of the red retest area—this zone has shown to catch corrections before in technical analysis and news reports
AInvest
Mudrex
Barron's
.
3. Resistance & Upside Targets
If the retest holds, the chart charts a potential bounce toward the upper rising trendline and beyond, potentially aiming for the $126K–$130K region, as marked by Fibonacci retracement levels.
This aligns with several external forecasts suggesting resistance or target zones in that range
AInvest
Mudrex
Barron's
.
4. Potential Price Path & Scenarios (Denoted by Red Arrows)
Bearish Scenario: Price may dip down into the retest zone, test support, and—if the breakdown occurs—continue lower toward $100K—a key area of interest.
Bullish Scenario: The support holds, leading to a V-shaped recovery that propels price back above $115K, potentially triggering a rally toward $122K–$130K.
Summary Table
Key Zone / Level Significance & Note
$110K–$112K Critical near-term support; breakdown risks move toward $100K
AInvest
Mudrex
Retest Zone (~$114K–$115K) Area combining horizontal support and trendline; serves as pivot for next move
Mudrex
AInvest
$120K–$123K Major resistance where a breakout could fuel continuation toward $127K–$130K
Mudrex
Barron's
Broader Context & Market Sentiment
Bitcoin is currently consolidating after setting new highs near $124K
MarketWatch
The Economic Times
Barron's
Cointribune
.
Analysts observe that sustaining above the $110K–$112K band is essential to the bullish case; falling below it could invite deeper downside
Barron's
Cointribune
AInvest
.
Conversely, a decisive move above $120K–$123K could validate continuation toward $127K–$130K, and even higher—some forecasts extend to $135K and beyond
Mudrex
Indiatimes
Barron's
CoinCodex
.
Final Thoughts
Your chart beautifully illustrates the classic “retest after breakout” dynamic:
Hold above the retest zone? Look for a rebound toward $120K+, with the potential for a full bullish revival aiming for $130K.
Break below $110K–$112K? Watch for a possible move toward $100K—a critical support level.
Stay alert to macro catalysts too—like Federal Reserve interest rate signals, institutional inflows (ETFs), and regulatory developments—which could steer the next leg substantially

XRPUSDT: Trade 15 minHello, I opened a trade on Ripple, the points where the price is likely to reverse are marked, so in the lower timeframe there is a short-term trend towards gain. Be profitable.

XRP Game PlanXRP Game Plan
📊 Market Sentiment
Market sentiment has slightly shifted as expectations for a 0.25 bps cut in September are no longer strongly priced in. Current probabilities still show around a 60% chance of easing, but overall, the market remains uncertain. This uncertainty has led to risk-off moves and sell-offs across multiple assets, starting with NQ and extending into crypto.
📈 Technical Analysis
Price is retracing towards a higher timeframe (HTF) key support level.
The main liquidity zone sits around $2.73, where I would expect a significant bounce.
📌 Game Plan
I expect price to run into the $2.73 liquidity zone and close back above it. From there, I will look for price to reclaim the HTF key level as confirmation of bullish continuation.
🎯 Setup Trigger
I will monitor the 4H market structure for confirmation before initiating a position.
📋 Trade Management
Stoploss: 4H swing low confirming the BOS
Targets:
TP1: $3.14
TP2: $3.38
💬 Like, follow, and comment if you find this setup valuable!
⚠️ Disclaimer: This content is for informational and educational purposes only and does not constitute financial, investment, or trading advice. Always do your own research before making any financial decisions.

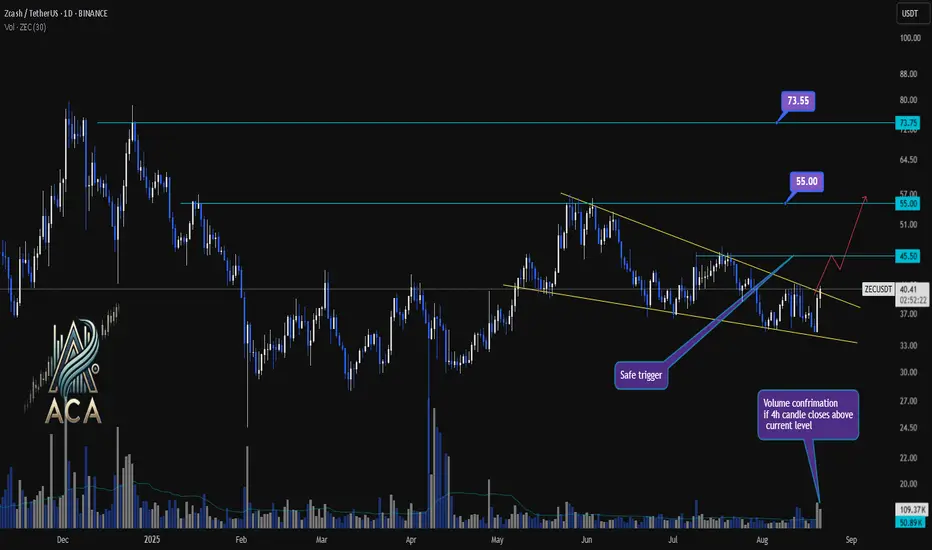
ZECUSDT Daily Chart Analysis | Symmetrical Triangle BO WatchZECUSDT Daily Chart Analysis | Symmetrical Triangle Breakout Watch
🔍 Let’s dissect the ZEC/USDT daily chart, where price action is nearing a pivotal breakout from a symmetrical triangle—often a precursor to major moves when combined with rising volume.
⏳ Daily Chart Overview
Zcash has been consolidating over recent weeks, forming a clear symmetrical triangle pattern bounded by converging trendlines. This pattern, characterized by lower highs and higher lows, signals that volatility is being compressed and a decisive breakout may be imminent.
🔺 Long Setup:
A daily close above the $45.50 resistance, especially with strong volume, will act as a “safe trigger” and confirm breakout validity. If bulls take charge here, the next upside objectives are $55.00 followed by $73.55. Watch for volume confirmation, ideally on a 4H candle close above resistance, to further add confidence to the breakout.
📊 Key Highlights:
- Symmetrical triangle pattern shows growing pressure for a directional move.
- Recent price tested triangle resistance; a close above $45.50 is the bullish trigger.
- Upside targets post-breakout are $55.00 and $73.55, provided volume supports the move.
- Volume spike serves as crucial confirmation—don’t chase without it.
🚨 Conclusion:
ZEC is coiling within a symmetrical triangle, setting the stage for potential breakout action. Bulls are watching $45.50 for a clean breakout trigger, eyeing $55 and $73.55 as next targets. Always wait for strong volume and confirmed closes before acting—symmetrical triangles can break both ways if conviction is lacking.
BTC Game PlanBTC Game Plan
📊 Market Sentiment
Overall sentiment remains bullish, supported by expectations of a 0.25% rate cut in the upcoming FOMC meeting. A weakening USD and increasing global risk appetite are creating favorable conditions for further upside in crypto assets.
📈 Technical Analysis
Price is currently retracing lower after printing new all-time highs.
It is moving toward the 112,000$ level, which contains significant liquidity. Therefore, I expect a strong bounce from that zone.
Additionally, price is approaching the equilibrium level (0.5 Fibonacci), which represents a discount for me.
📌 Game Plan
I expect price to retrace to the 111,316$ level and bounce from there.
🎯 Setup Trigger
I will be watching the 4H market structure for confirmation before initiating a position.
📋 Trade Management
Stoploss: 4H swing low confirming the BOS
Targets:
TP1: 118,446$
TP2: 124,351$
💬 Like, follow, and comment if you find this setup valuable!
⚠️ Disclaimer: This content is for informational and educational purposes only and does not constitute financial, investment, or trading advice. Always do your own research before making any financial decisions.

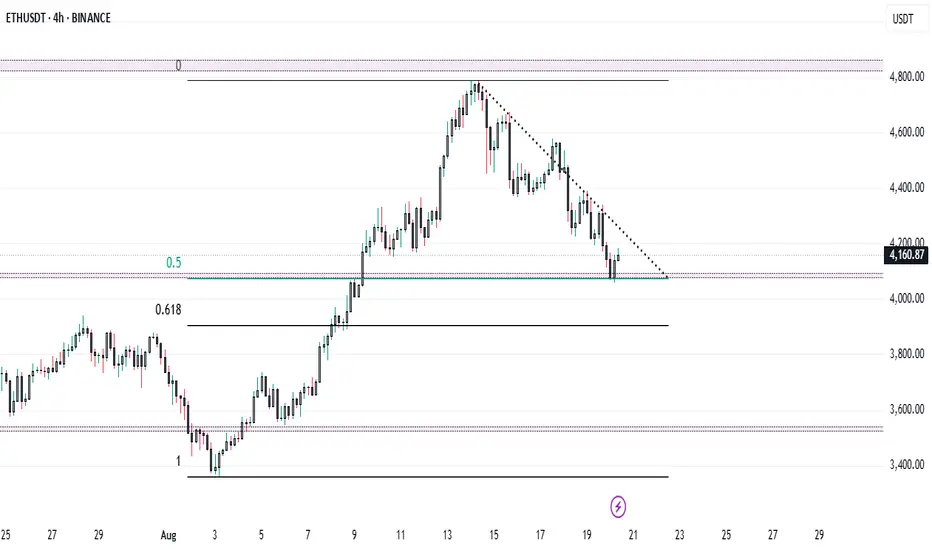
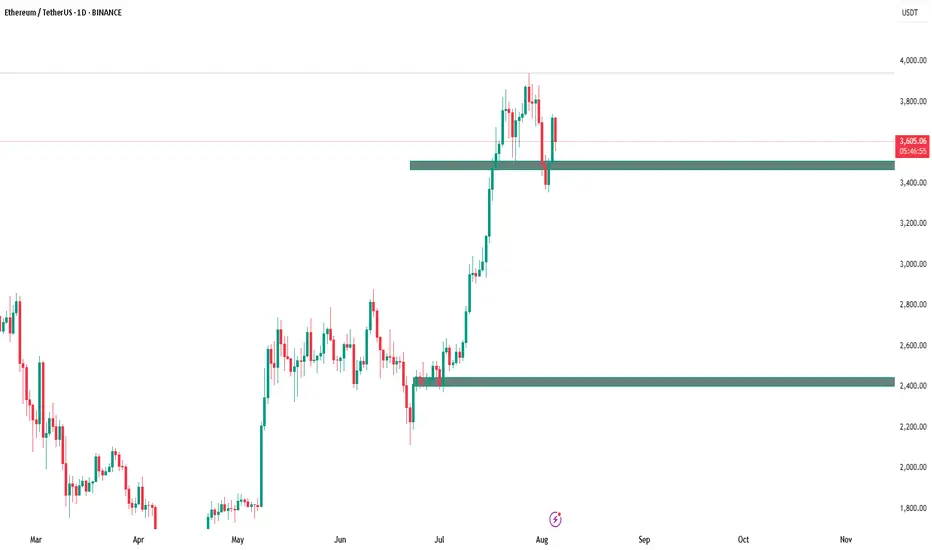
ETH at $4,100 – Can Bulls Defend Key Support Before FOMC..?ETH + FOMC = Volatility Ahead ? 🔥
Ethereum at Make-or-Break Zone: $4,100 Support in Focus!
Ethereum (ETH/USDT) on the 4H timeframe is showing a decisive battle between bulls and bears. After topping near $4,700, ETH has been in a steady downtrend, respecting the descending trendline.
🔑 Key Levels to Watch
* Immediate Support: $4,100 – $4,150 (0.5 Fib retracement)
* Major Support: $3,950 – $4,000 (0.618 Fib retracement)
* Resistance Zone: $4,300 – $4,350 (descending trendline)
* Major Resistance: $4,600 – $4,700 (recent swing high)
📈 Bullish Scenario
✅ A breakout above $4,300 trendline resistance could trigger strong momentum toward $4,500 - $4,600.
✅ Holding $4,100 support will keep buyers in control.
📉 Bearish Scenario
❌ If ETH fails to hold $4,100, expect a deeper retracement toward $4,000 (0.618 Fib).
❌ A break below $3,950 may extend the fall to $3,700 – $3,600.
⚠️ Market Note
📌 Today’s FOMC meeting could heavily impact the crypto market trend.
Expect volatility as Fed commentary on interest rates may guide ETH’s next major move.
⚖️ Conclusion
ETH is at a critical support zone where the next move will define short-term direction.
* Above $4,300 → Bulls regain control.
* Below $4,100 → Bears target $4,000 and lower.
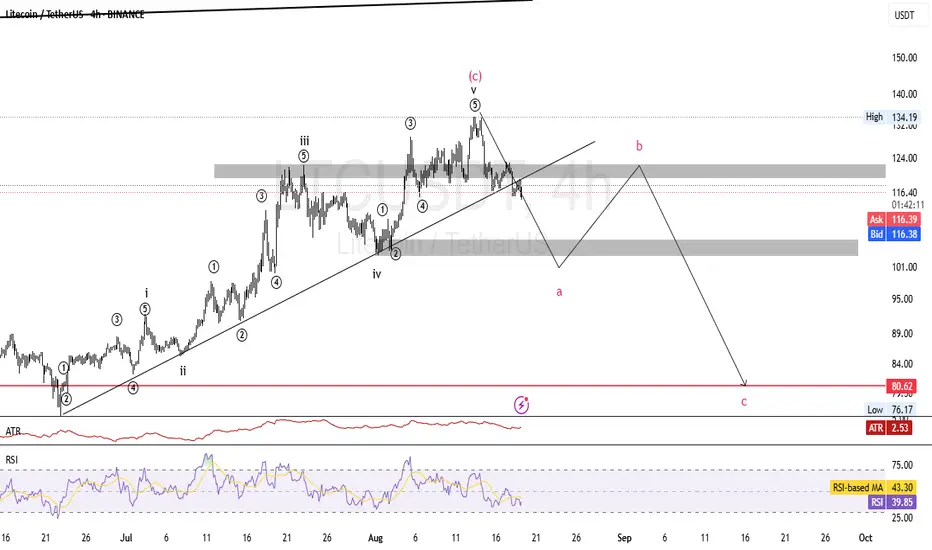
LTCUSDT: Elliot waves AnalysisHello friends, if we examine the Litecoin chart based on Elliott waves, we can see that its five waves have completed and also its medium-term trend line has been broken, so we can expect a deep correction like this. This can only be an analysis and other scenarios should be examined.
EOSUSD H4 | Bullish bounceBased on the H4 chart analysis, the price is falling towards the buy entry, which is a multi swing low support, and could bounce from this level to the take profit.
Buy entry is at 0.4586, which is a multi swing low support.
Stop loss is at 0.4173, which is a swing low support.
Take profit is at 0.5059, which is an overlap resistance.
High Risk Investment Warning
Trading Forex/CFDs on margin carries a high level of risk and may not be suitable for all investors. Leverage can work against you.
Stratos Markets Limited (tradu.com ):
CFDs are complex instruments and come with a high risk of losing money rapidly due to leverage. 65% of retail investor accounts lose money when trading CFDs with this provider. You should consider whether you understand how CFDs work and whether you can afford to take the high risk of losing your money.
Stratos Europe Ltd (tradu.com ):
CFDs are complex instruments and come with a high risk of losing money rapidly due to leverage. 66% of retail investor accounts lose money when trading CFDs with this provider. You should consider whether you understand how CFDs work and whether you can afford to take the high risk of losing your money.
Stratos Global LLC (tradu.com ):
Losses can exceed deposits.
Please be advised that the information presented on TradingView is provided to Tradu (‘Company’, ‘we’) by a third-party provider (‘TFA Global Pte Ltd’). Please be reminded that you are solely responsible for the trading decisions on your account. There is a very high degree of risk involved in trading. Any information and/or content is intended entirely for research, educational and informational purposes only and does not constitute investment or consultation advice or investment strategy. The information is not tailored to the investment needs of any specific person and therefore does not involve a consideration of any of the investment objectives, financial situation or needs of any viewer that may receive it. Kindly also note that past performance is not a reliable indicator of future results. Actual results may differ materially from those anticipated in forward-looking or past performance statements. We assume no liability as to the accuracy or completeness of any of the information and/or content provided herein and the Company cannot be held responsible for any omission, mistake nor for any loss or damage including without limitation to any loss of profit which may arise from reliance on any information supplied by TFA Global Pte Ltd.
The speaker(s) is neither an employee, agent nor representative of Tradu and is therefore acting independently. The opinions given are their own, constitute general market commentary, and do not constitute the opinion or advice of Tradu or any form of personal or investment advice. Tradu neither endorses nor guarantees offerings of third-party speakers, nor is Tradu responsible for the content, veracity or opinions of third-party speakers, presenters or participants.

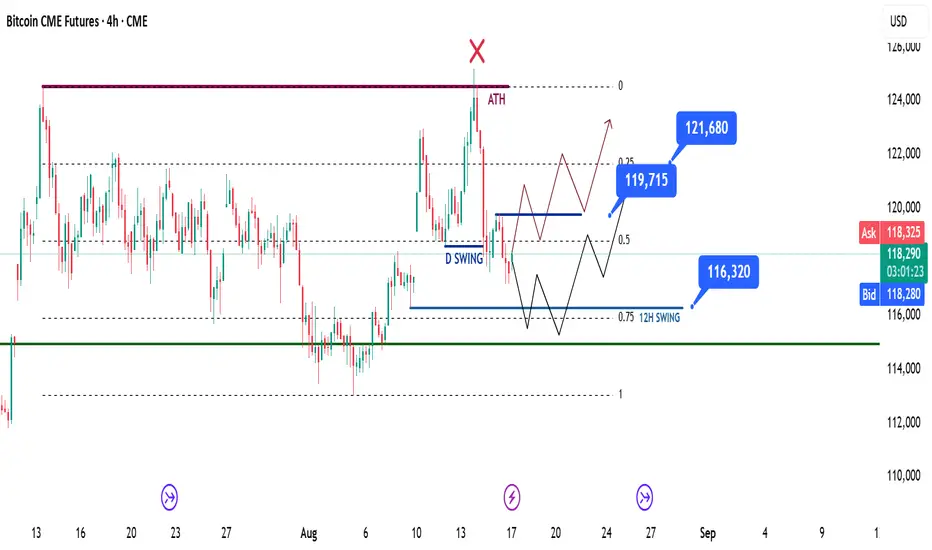
BTC Weekly Recap & Game Plan 17.08.2025BTC Weekly Recap & Game Plan 17.08.2025
📊 Market Sentiment
Overall sentiment remains bullish, supported by expectations of a 0.25% rate cut in the upcoming FOMC meeting. A weakening USD and increasing global risk appetite are creating favorable conditions for further upside in crypto assets.
📈 Technical Analysis
Price ran the daily swing liquidity but couldn’t close above it.
Additionally, price has tapped into the equilibrium level, which makes this a discount zone in my view.
📌 Game Plan
There are two possible scenarios to watch:
First scenario (red):
→ Price closes above 119,725$, then I’ll be looking for entries around 118,750$.
Second scenario (black):
→ Price may retrace further to 116,310$, marked by 12H swing liquidity.
→ This level also aligns with the 0.75 Fibonacci retracement, which is my max discount zone.
🎯 Setup Trigger
I’ll be watching for a 4H–1H break of structure (BOS) to initiate entries.
📋 Trade Management
Stoploss: 4H–1H swing low confirming the BOS
Targets:
TP1: 121,680$
TP2: 124,500$
💬 Like, follow, and comment if you find this setup valuable!
⚠️ Disclaimer: This content is for informational and educational purposes only and does not constitute financial, investment, or trading advice. Always do your own research before making any financial decisions.
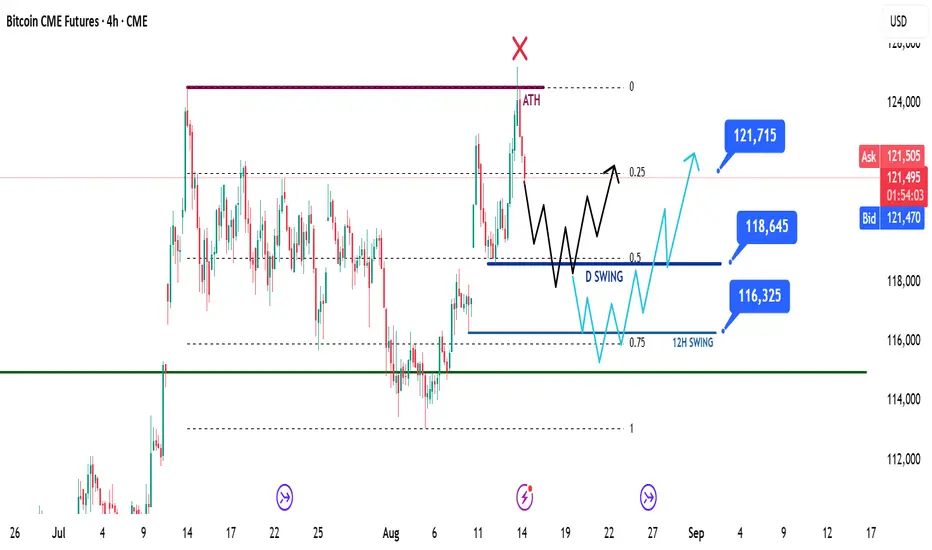
BTC Daily Recap & Game Plan 14.08.2025BTC Daily Recap & Game Plan 14.08.2025
📊 Market Sentiment
Overall sentiment remains bullish, supported by expectations of a 0.25% rate cut in the upcoming FOMC meeting. A weakening USD and increasing global risk appetite are providing favorable conditions for further upside in crypto assets.
📈 Technical Analysis
Price ran to all-time highs and faced rejection there.
The close below the all-time high level indicates that price may now seek opposite-side liquidity (buyers).
Historically, Bitcoin often consolidates within a range after running all-time highs, collecting more liquidity before continuing upward.
📌 Game Plan
I expect two possible scenarios:
1️⃣ Run the daily swing low and hit the equilibrium of the range at $118,645, then bounce and move up towards $121,750.
2️⃣ Run the 12H swing low and hit the 0.75 level of the max discount range at $116,325, then bounce and move up.
🎯 Setup Trigger
I will be watching for a 4H break of structure when either scenario occurs.
📋 Trade Management
Stop-loss: Below the 4H swing low that confirms the break of structure.
Target: TP1 at $121,750 and possible new highs. Targets will be updated depending on structure.
💬 Like, follow, and comment if you find this setup valuable!
Disclaimer: This is not financial advice. The content is for informational and educational purposes only and reflects personal opinions.
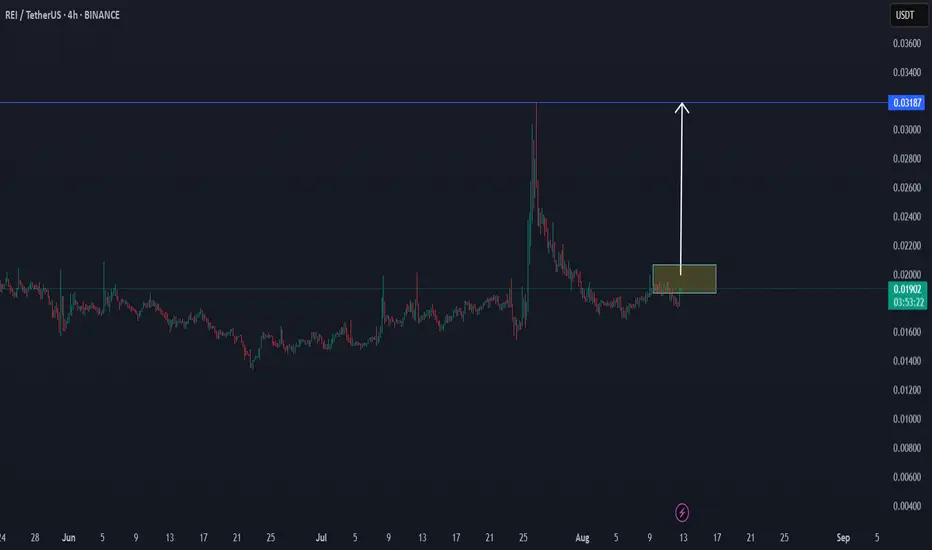
THE RETURN BREAK OF REI TO $0,032There is a good chance we are going to see a new break on REI as we saw before.
We will follow the coin for new volume.
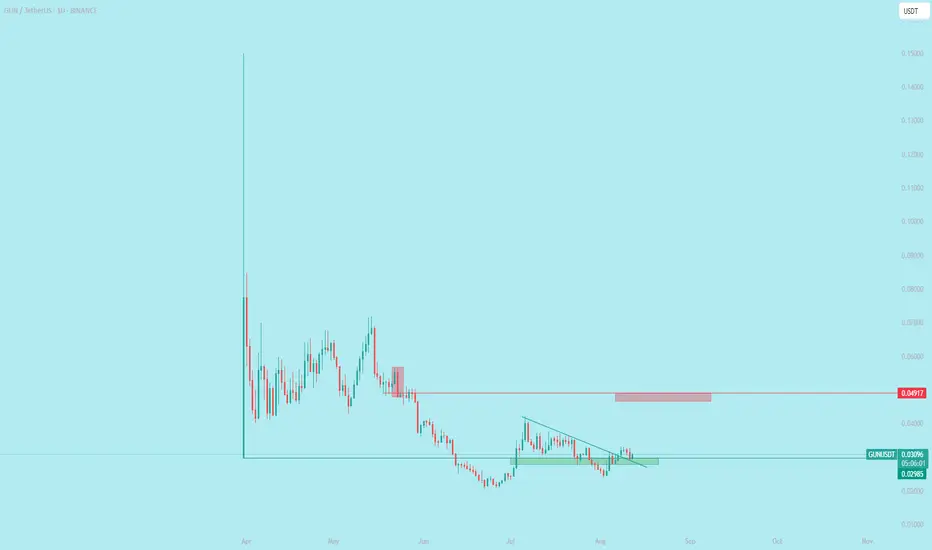
$GUN a huge bag loaded The chart you provided is for GUN/USDT on Binance , showing a significant price drop followed by a period of consolidation. Based on the visible trend, the price has recently approached a support level around 0.024 USD and appears to be testing it. If the support holds, the next move could be an upward bounce, potentially targeting the resistance near 0.0417 USD. However, if the support breaks, the price might decline further .This is a general observation based on the chart's pattern.
$C looking for multi x $C (Chainbase) is currently flying under the radar, attracting minimal attention from the broader market, much like CRYPTOCAP:SOL (Solana) did in its early days when it was first listed, as shown in the second photo you referenced. This comparison suggests that $C is in a similar phase of quiet accumulation or undervaluation, where its potential is not yet recognized by the masses. Just as CRYPTOCAP:SOL lingered in obscurity before its meteoric rise, $C may be poised for significant growth, driven by its underlying technology, use case, or market positioning.I’m not making definitive predictions but rather noting this observation for the record. The parallel to CRYPTOCAP:SOL ’s early trajectory implies that $C could follow a similar path, where early adopters or observant investors benefit as the project gains traction over time. The lack of current hype around $C could be an opportunity, as it’s developing steadily without the noise of speculative frenzy. Time will ultimately reveal whether this assessment is correct or not, and I’m documenting this perspective to track its outcome and reflect on the market’s eventual judgment.

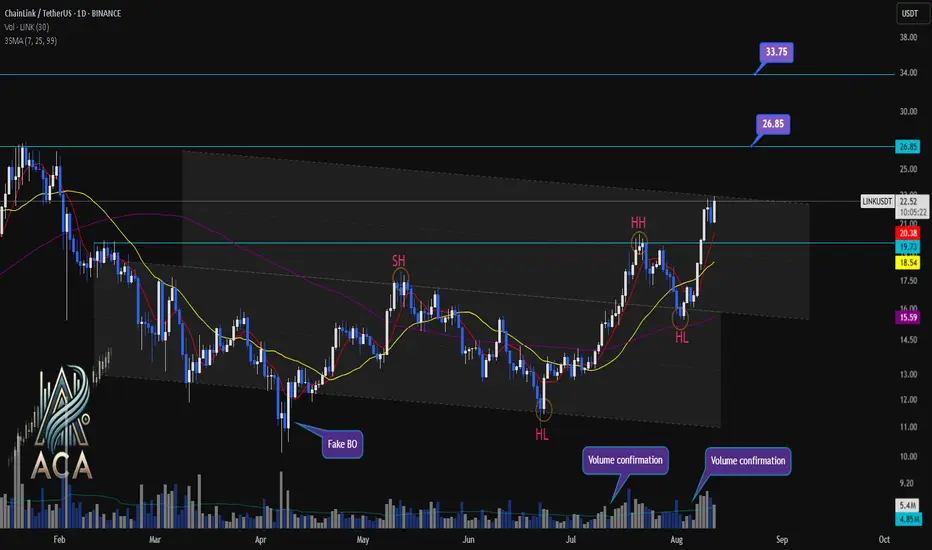
CHAINLINKUSDT Daily Chart Analysis | Channel BreakoutCHAINLINKUSDT Daily Chart Analysis | Channel Breakout & Bullish Momentum
🔍 Let’s dive into the ChainLink/USDT spot chart, analyzing key swings, channel dynamics, and fresh momentum signals for a bullish scenario.
⏳ 1-Day Overview
The daily chart shows LINKUSDT surging toward the RR1 (Risk-Reward 1) of its channel pattern, marked by powerful volume confirmations that help validate the move. Price has decisively broken above prior resistance zones and continues to print higher highs (HH) and higher lows (HL). The chart’s swing structure is clear: a series of ascending pivots signaling a bullish reversal from past lows.
🔺 Channel, Swings & Momentum:
- Price action is respecting the well-defined channel; current breakout and move to RR1 highlights bullish control.
- Swings are established: recent HL and HH confirm upward structure.
- Volume spikes on breakouts further confirm buyer strength, supporting the move out of consolidation.
- 3SMA (7, 25, 99) alignment shows short- and medium-term averages crossing above the long-term trend—often a leading indicator for the start of a strong uptrend.
- Next targeted levels stand at $26.85 and $33.75, while the long-term target remains a fresh All-Time High (ATH), should momentum persist.
- Past “Fake BO” (breakout) risk now superseded by true volume-backed move supported by technical confirmations.
📊 Key Highlights:
- Channel breakout with confirmation at RR1, swing HH/HL structure for bullish momentum.
- Volume surges on upward moves—critical for authenticating breakout strength.
- 3SMA configuration points to the potential beginning of a major trend extension.
- Upside targets: $26.85 for the next level, $33.75 as extension, and new ATH as the bold long-term bull case.
🚨 Conclusion:
ChainLink’s breakout above channel resistance signals bullish intent with strong volume and swing confirmation. Eyes on next targets: $26.85 and $33.75. If volume and trend continue, new ATH is on the horizon.
BTCUSDT - high placed ? What's next ??#BTCUSDT... so far market placed a very reasonable day high that is 122600-700 around.
So if market holds that then drop expected.
Above current day high it will be invalidate.
Gold luck
Trade wisely

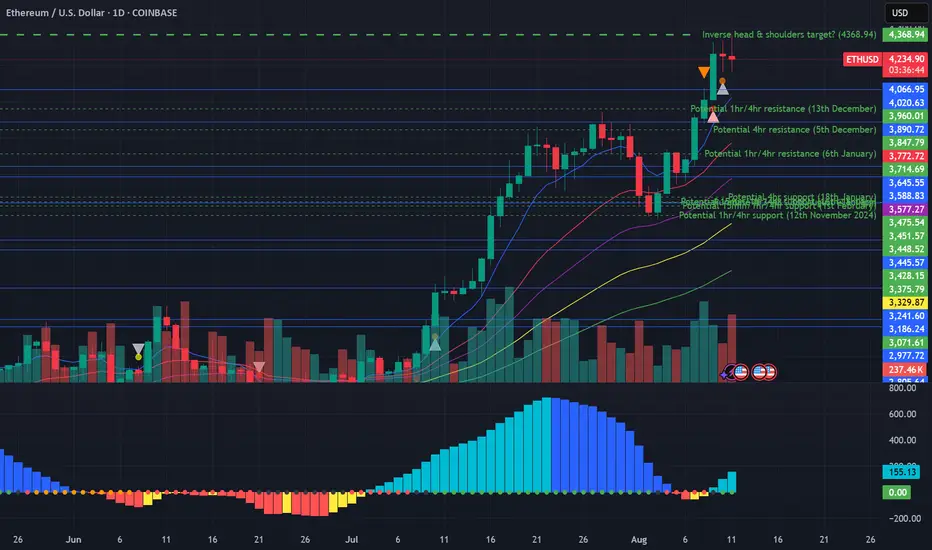
Potential inverse head and shoulders target reached on EthereumWell... nearly reached at this stage anyway. In a similar vein to Dow Theory (in which you would normally expect that the Dow Jones Industrial Average would rise alongside the Dow Jones Transportation Index, the Nasdaq Composite, the SP500 and the Russell 2000 indices), let's suppose you would expect that Ethereum would rise alongside Bitcoin and the other altcoins.
Let's face it, Ethereum has had a great run recently, but what has Bitcoin been doing over the past month in particular? Literally nothing. Zero, zilch, nada... But why am I bringing up caution at this stage whilst everyone is so bullish about Ethereum? Let's scale out. If you look very far out to earlier this year, there was spike down in February for Ethereum (which formed a 'left shoulder' downward), and further retracement in share price downward to the ultimate low in April two months later to form the 'inverted head', followed by upward movement to form the inverted 'right shoulder' in late June.
This allows us to draw a 'neckline' at around about the 2880 level. Extending calculations from this neckline to the inverted head provides a range of approximately 1400, but when utilising exact numbers utilising charting software, and extending this range upwards from the neckline northwards provides a potential target of 4,368.94, which is fairly close to where we've been recently (the high of 4,333.13 about 2 hours ago at the time of writing).
Unless Bitcoin can get itself moving, as well as Ethereum turn around with respect to the one hourly momentum, tread cautiously and consider the possibility that the target may be reached of this head and shoulders target for Ethereum (thus, neutral bias at this stage, with potential to turn bearish).
XRP | Ripple Game Plan - Swing Long Idea📊 Market Sentiment
Overall sentiment remains bullish, supported by expectations of a 0.25% rate cut in the upcoming FOMC meeting. The weakening USD and increased risk appetite across global markets are creating favorable conditions for further upside in crypto assets.
📈 Technical Analysis
Price broke the bearish trendline that had been driving the downtrend since July 18th.
A strong breakout and close above the trendline confirmed the move.
The breakout area also aligns with a significant HTF key level, adding strength to this zone.
📌 Game Plan
Looking for a quick retest of the broken trendline and HTF key level before a rejection.
🎯 Setup Trigger
Confirmation will come from a clear 1H break of structure after the retest.
📋 Trade Management
Stoploss: Below the 1H swing structure that caused the break of structure
Targets: TP1: 3.57 | TP2: 3.66
Will trail stop aggressively to secure profits as the move develops.
💬 Like, follow, and comment if this breakdown supports your trading!
More setups and market insights coming soon — stay connected!

Bitcoins has slipped back under Long Term resistance. CAUTION
It is VERY clear to see and some just do not want to see it
That Blue Arc, Arrowed, is an Arc that has rejected EVERY ATH since Bitcoin began rising from its early Low.
And also understand, that arc is not just a random line, It is Calculated and is part of a Fibonacci Spiral.
ANYWAY, as we can see on the chart. PA is heading to a Squeeze with this Arc and a rising line of support below.
This line of support has NEVER failed since PA crossed over it.
So we have a n arc of Resistance that has Never been broken.
We have a line of support that has Never been Broken.
One of these two line Has to break.
The Apex of this Squeeze us Dec this year and, as we all know, PA always react before the Apex.
So, How accurate is the placement of this Arc ?
Lets see the Daily chart
Here we can see that PA has for most of this year, been trying to break over and, in July, succeeded, only to fall back below a week ago.
To many extents this played along Very well with the monthly Candle Colour patterns I been posting.
But the fact remains, we are once again BELOW a HUGE powerful line of resistance that we MUST break above and stay above.
We do have many lines of Support below, Local and some, longer term.
We can close on the 4 hour just to see where we are in a more local time frame.
Here, we can see that 105K is a very possible line of support initially that we need to watch and see what happens. Hopefully, we range above this level and let RSI cool off.
The RSI is always a great gauge to watch here and the daily offers some hope of remaining in this current PA range
It must be said that RSI could still drop lower, though we have room to rise before PA becomes OverBought on the Daily.
But the weekly shows us a longer term CAUTION flag.
While we have not been OverBought on the weekly for a long time, we ARE up high, leaving the potential for a Drop.
But with the Daily in good shape, this could be postponed. In this cycle, previous times we got overbought, PA ranged while RSI dropped.
This could repeatover and over........But PA needs to rise OVER that line of resistance and turn it into Support.
This is NOT a choice//it is a MUST HAPPEN if Bitcoin is to continue its rise higher.
The current Price line of this Blue Arc is around 116K.
What we realy need to understand about this Arc is that once we pass December 2025, that arc begins to DROP.
And if PA is below it still, PA will get dragged down with it, into an ever decreasing price model.
So, there we have it
Simple as that.

ETHERIUMTHE RESULT
Follow for more Simple And accurate swing analysis on Indices, Currency, Commodities.
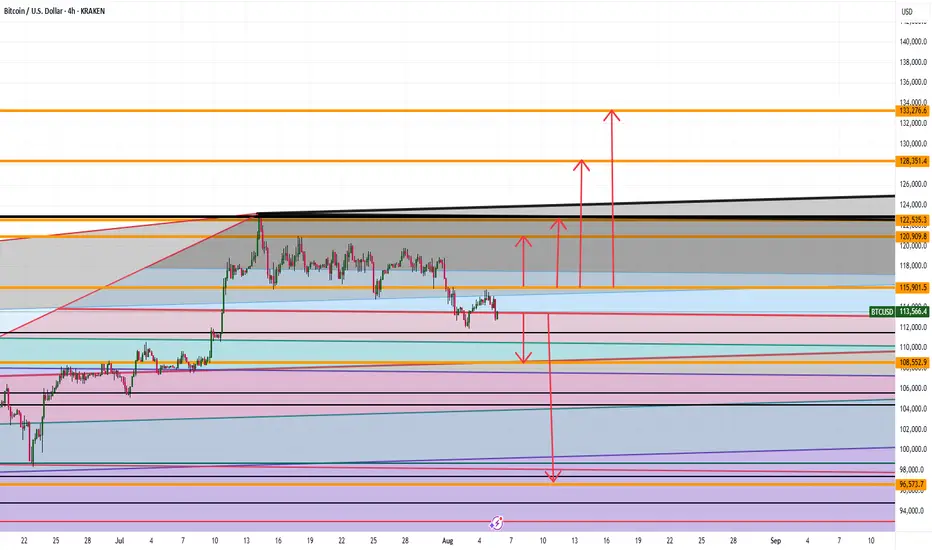
BTC Full Analysis WHERE ARE WE HEADING ???Good afternoon
SO currently with BTC we see the following:
Bullish:
If we can stay and hold above 115,900 then 120K, 122K, 128K and 133K makes sense
BEARISH:
If we close and hold under 113K levels then we can see 108, and 96K levels being hit
What do you think ? Comment Below
Trade Smarter Live Better
Kris
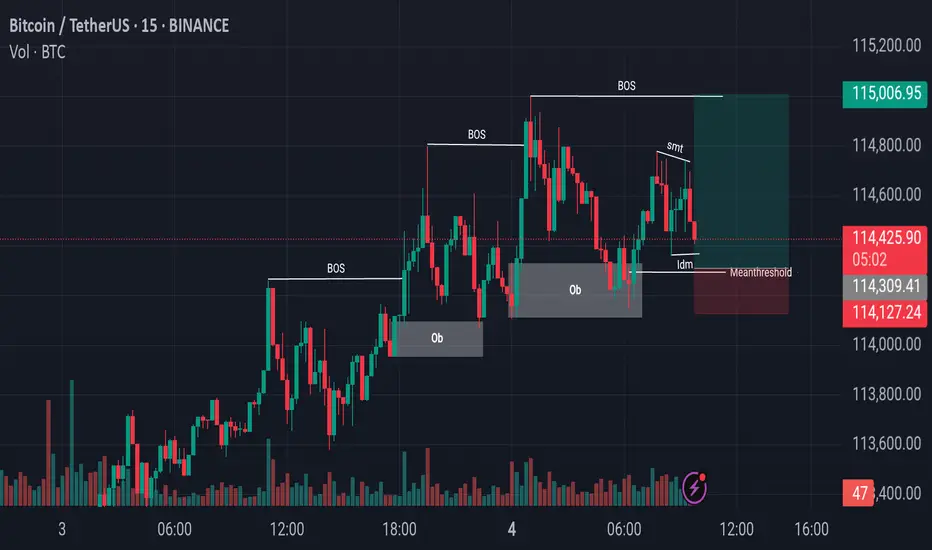
Bitcoin Price Flow From Liquidity Grabs to Structural BreakoutsBitcoin Price Action Analysis:
In recent sessions, Bitcoin has been consistently making Breaks of Structure (BoS) to the upside, indicating a strong bullish trend. Most recently, after forming another BoS, the market retraced downward and precisely tapped into a previously established Bullish Order Block (OB). This reaction led to a temporary upward movement; however, during this process, the market also created a zone of internal liquidity.
Currently, Bitcoin is showing signs of a downward move again, potentially aiming to capture Internal Drawdown Market (IDM) liquidity. Just below this level lies another key Order Block, which could serve as a strong support zone. If the price reacts positively from this region, we might see the market initiate another upward leg, potentially forming the next Break of Structure to continue the bullish narrative.
Note: Always perform your own research (DYOR) before making any trading decisions.