Coinbase"Cathie Wood’s Ark Investment Management, the second-largest holder of Coinbase Global (COIN) stock, doubled down on its investment in the crypto exchange after the U.S. Securities and Exchange Exchange sued the only publicly traded crypto exchange sending share prices tumbling.
ARK bought 419,324 shares of Coinbase, worth around $21.6 million based on Tuesday's closing price of $51.61." -Coindesk
......
Considering that this company's stock price is near it's lows, I can see why Ark Investment Management would make that move.
I believe the shift begins once there's a break of the $67 level. Afterwards, it's next potential hurdle could be the $190 - $230 price range. However, I'll be even more bullish after a break of the $320.
Cryptos

KDA Kadena is about to pump 2XReady for a beautiful entry LONG !!!
KDA just showed a huge sign of strenth on actual levels
You can enter in position actual price or wait at these levels :
1.18
1.12

BITCOIN ANALYZE 1D📍According to Elliott Wave Theory: It has completed a full bullish cycle and is currently undergoing a corrective phase in the form of a 3-wave abc pattern. Currently, Wave a has been established and Wave b is in formation. In my opinion, this could potentially mark the end of Wave b and the beginning of Wave c (Wave c in Elliott Wave Theory can be the sharpest wave). We might anticipate a significant downward movement for Bitcoin.
📍My initial target is $14,000.

Unleash the power of Ethereum in 2024COINBASE:ETHUSD Ethereum stands tall as a beacon of innovation, and its future in 2024 looks brighter than ever!
With a strong foundation built on the groundbreaking achievements of 2022 and the ever-growing support of the crypto community, Ethereum is poised to make a remarkable comeback in the coming year.
One of the key drivers of Ethereum's bullish thesis for 2024 is the upcoming network upgrade, EIP-4844, which promises to bring significant improvements in transaction speeds and costs. This upgrade is expected to take place during the first half of 2024, and it could be the catalyst that propels Ethereum to new heights.
Moreover, the recent shift in market sentiment towards Ethereum, as evidenced by the growing number of institutional investors and the potential for a spot Ethereum ETF, further strengthens its bullish case. As more investors recognize the unique utility of the Ethereum blockchain for dApp developers, NFTs, and DeFi applications, the demand for ETH is likely to surge.
In addition, the deflationary nature of Ethereum, which was first observed in 2023, is expected to continue in 2024. This deflationary pressure, coupled with the growing adoption of DeFi and NFTs on the Ethereum network, will likely result in increased utility and demand for ETH.
Furthermore, the technical analysis of Ethereum's price action in 2024 reveals a bullish pattern, with the formation of an ascending triangle and a triple top. These patterns suggest that a breakout to the upside is imminent, and the price of ETH could reach new all-time highs in the coming year.
#ETH #BTC

BTCUSD (D) Buy nowBINANCE:BTCUSD BTCUSD (D) appears to have a pattern of narrowing the price range.
Currently, the pattern has been broken. So:
Buy current price at 45450
Stop loss at 41345

BTC etf The picture is pretty clear imo. The ETF is near and the market is giving this clear picture. lets see what happens. IT's GG.

Bitcoin Flat( is the ETF gonna be positive or ?)Bitcoin ETF is either gonna bring Positive news to the space or it is gonna bring negative news.
So, if Negative, from the current price we might see a drop as detailed on the Chart, else if the news are positive, as already detailed on the chart, a move from 39k is needed for a Bullish run continuation.

CAKE party !Entry point and stop loss is based on your personal plan and this is my long term analysis on weekly time frame.
I think the chart says it all.
We will celebrate the cake party soon...
Good luck, dear trader.
Mohammad Goodarzi
Wednesday
3 Jan 2024

Classic Break For ALGOIs ALGO finally looking to break to the upside for the first time in 2024? its looking promising! A critical level for ALGO is around $.30 and I think we might be making a slow journey in that direction.
Trading the breakout pull back continuation pattern to confirm direction and volume.

NMR potential 15%-40% long ideaNMR daily chart
NMR will attempt to fill this wick.
Providing 15% first target and full wick fill would be approx. 40%
Not financial advice, just my 2cents

DOTUSD LONG, entry 7.64Daily timeframe, using volume profile shows a drop to 7.6 is likely a 1.7 R:R trade seems reasonable

TFUELUSDT 3M: Wave W Dynamics & Profit Potentials1Y frame:
We observe a sideways movement, indicative of a consolidating market. We've identified that waves A and B have completed, and currently, we are navigating through wave C.
6M Frame:
the current correction wave C will taking the form of a WXY pattern. We are presently in the middle of wave W
3M Frame
in this Idea we will go deeper to analysis the wave W:
wave A is completed and it was in a running flat form.
we are now in wave B which I expected to be a regulaer flat. the current candle form the second leg of this wave B and I expected beging of the next month we will go down to complete the third leg and targeting the yearly support area between 0.03333 and 0.03150, which will be our entry point.
wave C will be an 5 impluse wave which will ened around 0.11500-0.11700 with 250% profit.
failling point:
1M candle closing below the yearly support area, you can say below 0.031-0.030

The Others- So you have BTC.D, ETH.D and you have also " The Others".
- There's plenty of other fish in the ocean.
- This is just a Fibo analysis but a bit advanced chart.
- Make your own diligences and learn about fibonacci trading strategy.
- All Fibos retracements and extensions are annotated in the chart.
To keep it basic like always :
- the most interesting thing to follow right now in this chart is :
- " The Yellow zone making a Triangle ".
- Be confident and Hodl steady.
Happy Tr4Ding !

BTCUSD: Approaching the end of the road.Bitcoin / BTCUSD is trading inside a Channel Up since the start of the year and is approaching its top.
The price action is basically similar to the March-April Higher High formation and it is getting close to the April 14th High once it completes the +89.41% rise.
The 1day RSI is also inside a similar Channel Down pattern, which is a bearish divergence leading to the price's eventual peak.
Technically a correction to the 1day MA50 is justified.
Sell and target 41000 (0.236 Fibonacci level).
Follow us, like the idea and leave a comment below!!

BTC“Bitcoin Price Roared Back to Life with a 5% Rally, but Can Bulls Muscle Through the $43,500 Resistance?”
In the dynamic realm of cryptocurrency, Bitcoin (BTC) recently staged a resolute comeback, surging by over 5% from the $40,500 support zone. This marked a pivotal moment for Bitcoin, as it attempted to shatter a crucial bearish trendline and climb above the formidable $43,500 resistance. In this comprehensive analysis, we’ll delve into the recent price movements, key technical indicators, and the potential scenarios that could shape Bitcoin’s trajectory in the coming days.
ETH, Ethereum, BTC, Bitcoin. Cryptocurrency, s4style
Bitcoin’s Resurgence:
Bitcoin initiated a strong upward climb from the critical $40,500 support zone, showcasing resilience in the face of recent market fluctuations. The price is currently trading above $42,000 and the 100 hourly Simple Moving Average, indicating a positive outlook for further upward movement. A noteworthy development was the break above a major bearish trendline with resistance near $41,850, as observed on the hourly chart of the BTC/USD pair.
Technical Indicators and Rally:
The surge in Bitcoin’s price was accompanied by a steady increase above the $41,200 and $42,000 levels. A significant breakthrough occurred with the rally above the $43,000 resistance zone, underscoring the bullish momentum. However, the key challenge lies ahead, as Bitcoin grapples with the formidable $43,500 resistance. The current consolidation phase is occurring above the 23.6% Fib retracement level of the upward move from the $40,515 swing low to the $43,464 high.
Resistance Levels and Potential Breakout:
As Bitcoin hovers near the $43,500 resistance, immediate resistance is noted at $43,250, with the first major hurdle forming near $43,500. A close above this crucial level could initiate a steady increase, setting the stage for a potential climb toward the $44,200 resistance. A clear move beyond $45,000 might signal a meteoric surge, with the possibility of testing the $46,500 level. Investors are closely monitoring these key levels for signs of a sustained breakout.
Downside Scenarios and Support Levels:
However, the cryptocurrency market is inherently unpredictable, and caution is advised. If Bitcoin fails to rise above the $43,500 resistance zone, a fresh decline could ensue. Immediate support on the downside is anticipated near the $42,750 level. The next major support lies around $42,000 or the 50% Fib retracement level of the recent upward move. A breach below $42,000 poses the risk of further losses, with the price potentially dropping toward the $40,500 support in the near term.
Conclusion:
Bitcoin’s recent rally has injected optimism into the market, signaling a resolute comeback after testing the $40,500 support. The battle at the $43,500 resistance is a pivotal moment that could determine the cryptocurrency’s short-term trajectory. As Bitcoin attempts to muscle through this key level, investors are on the lookout for signs of a sustained breakout or a potential reversal. The interplay between bulls and bears will undoubtedly shape the narrative in the coming days, making it a crucial period for market participants navigating the ever-evolving landscape of Bitcoin’s price movements.

Cryptographic Truth Final Run (Chainlink) (Re-Upload)The fractal continues to play out like the last Chainlink Cycle.
I started to see a bump and run pattern forming, so I went back to 2019 where we are now in the fractal, and we find the same pattern: a textbook bump and run pattern. There is now a very high chance that we will reverse from this point; we just completed the throwback with a double bottom candle pattern.
My position is still open from 14.6 and being added to the long position under 14.
At the moment, LINK is consolidating under the 1/1 Gann Fan, as you can see below.
According to the fractal, we don't get the real break till the 1st of December; it might look something like this.
The condition for this theory on the fractal playing out being invalidated is if Chainlink loses this lower high structure and breaks this red support trendline.

ALGORAND is About to Explode!🚀 ALGO/USDT Potential Breakout Signal:
After a careful analysis of ALGO/USDT price action, it appears that a significant move is on the horizon. ALGO has recently broken out of a Falling Wedge pattern, and all signs point to an imminent bullish surge. The key price levels to watch closely are 0.102 and 0.108.
🎯 Mid-term Price Targets:
Target 1: 0.116
Target 2: 0.137
Target 3: 0.159
Target 4: 0.181
🛡️ Risk Management:
Consider initiating small spot buys as the price action develops. If the price experiences a temporary drop, consider Dollar-Cost Averaging (DCA) to achieve an average buying level. It's advisable to set a stop-loss just below 0.090 to manage risk and protect against potential pullbacks from this support level.
Stay tuned for updates as this promising move unfolds! 📈


ETHBTC: Support Zone holding for 7 weeks straight. Rebound closeETHBTC has completed seven straight weeks of trading at least for some days inside the S1 Zone, a supporting range that holds since May 2021. The 1W timeframe might be bearish (RSI = 35.095) but the 1D technical outlook is neutral (RSI = 46.177, MACD = 0.000, ADX = 25.760) and this reveals accumulation bias inside the S1 Zone. The 1W MACD is close to a Bullish Cross. We are taking this as an early buy signal and target and LH trendline (TP = 0.05900). Once the price closes a 1W candle over the 1W MA50, the upper Fibonacci levels should start getting filled one by one and eventually hit 0.08500 as the new Bull Cycle fully unfolds.
## If you like our free content follow our profile to get more daily ideas. ##
## Comments and likes are greatly appreciated. ##

LINKUSD: Two buy entries for a 28.850 target.Chainlink is bear the 1D MA50, a support level that has been intact since September 18th (almost three months). Despite the strong pullback, the 1D technical outlook is only neutral (RSI = 46.740, MACD = 0.490, ADX = 23.241), suggesting that the trend remains bullish and rightfully so as the pattern since the September lows is a Channel Up. That emerged after the longer than 1 year accumulation phase ended.
There is an interesting symmetry so far with the Channel Down (March-May 2022) that led to that accumulation and if it holds, then we might see the 1D MA50 break and the price entering the Symmetric S1 Zone. That will be our 2nd and final long entry. In both cases, we are targeting the R2 level (TP = 28.8500).
See how our prior idea has worked:
## If you like our free content follow our profile to get more daily ideas. ##
## Comments and likes are greatly appreciated. ##

Bitcoin Steps Into Temproary Corrective PhaseBitcoin is coming higher this year, moving very sharply through 2023, after a period of a consolidation that has been in play since March till Avgust of this year. We can see a nice and strong rise now, with some sharp extensions above daily base channel resistance lines and 40k area, so we assume that more upside can be seen as recovery is acting like an impulse. As such, be aware of further gains within a five-wave cycle for wave (C)/(III) up to around 48k - 50k area.
Looking at the 4-hour chart, we can see some slow down in last few days after Jamie Dimon comments and ahead of US CPI data. But we think it's just a wave 4 correction, where first support can be already at the EW channel support line and 40k area, but price action may stay slow then within a potential sideways bullish triangle pattern. However, ahead of US CPI and interest rate decision this week, be also aware of a deeper correction to 38k - 34k support zone, if the price breaks out of Elliott wave channel.

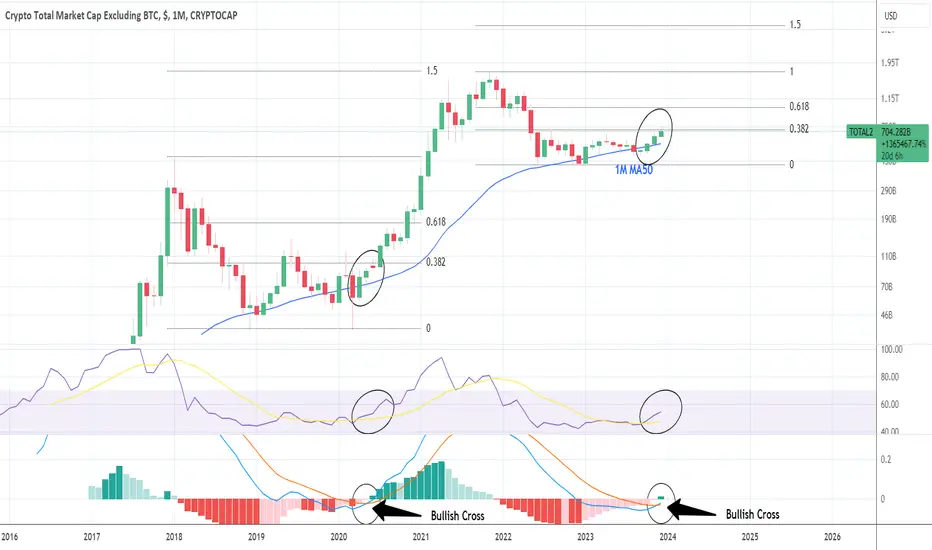
CRYPTO: Brace for a big Alt Season.All critical indicators have been aligned perfectly for a new alt season rally. The price is now over the 1M MA50 and on the 0.382 Fibonacci level from top to bottom. The 1M RSI is at 55.000 while the 1M MACD just made a Bullish Cross. The last time all those took place together was on June 2020. That was at the start of the Cycle's parabolic rally and this was only one in a total of two red months until May 2021 (9 green months in a total of 11). We can't get a stronget buy signal in the crypto market than that, a clear sign that this is probably the last opportunity to invest in the market for extraordinary gains.
## If you like our free content follow our profile to get more daily ideas. ##
## Comments and likes are greatly appreciated. ##
OOKI / USDT - Bullish but maybe have pullback firstShow some strong signs:
1: Fake breakout at 0.002100 level
2: wait VWAP breakout and hold
there are 2 Scenarios
First: if level 0.002100 hold
Target
1. 0.002550 or 200 MA
Second: if 0.002100 break down
Target
1. 0.001785
