$BTC 4hr - The Calm Before Bitcoin’s Next Move💡 In bull markets, triangles break UP more often than down.
But volume + macro + ETF flows > patterns.
Set alerts, manage risk, stay nimble.
#BTC #CryptoAlpha #RiskManagement
🎯 Key Levels Analysis:
✅ Resistance: 106.3K
→ This level matches the upper bound of the symmetrical triangle and is reinforced by multiple recent rejections. Also aligns with previous highs.
✅ Support: 103.7K
→ Mid-range horizontal support. Price reacted here multiple times. It's also near the triangle base.
✅ Support: 99.6K
→ Clean psychological + technical level. A previous consolidation zone. Would likely trigger a strong reaction.
✅ Last Line of Bull Defense: 95.2K
→ Major horizontal support from the April/May breakout structure. Losing this would likely invalidate the bullish structure.
Cryptos

Bitcoin Pushed Crypto Market Into A Higher Degree CorrectionGood morning Crypto traders! Cryptos are coming lower and we can now see a five-wave drop on Bitcoin, which indicates for a deeper, higher degree correction, so Crypto TOTAL market cap chart may stay in consolidation within an ABC correction, which can retest 3.0T – 2.8T support zone before bulls return.
Bitcoin has impulsive characteristics on 4h time frame, and we can clearly see five waves up that can send the price even higher after a pullback. Now that it’s back to all-time highs, we can see it making a higher degree ABC correction, which can take some time, and it can retrace the price back to 97k-93k support zone before a bullish continuation.
However, we may now see a temporary corrective recovery in wave B, where some ALTcoins could still be doing well, if we consider that ALTcoin dominance may start kicking in. Yesterday we shared a chart of the ratio of TOTAL3(ALTcoins) market cap against Bitcoin with ticker TOTAL3ESBTC, which shows that ALTcoins may start outperforming BTC soon. It can be finishing final subwave C of (Y) of a correction in blue wave B which may cause a new strong rally into wave C that can bring the ALTseason similar as in the beginning of 2021.

My BTC Play With a Macro BoostThis isn't about guessing.
This isn’t hype.
This is what happens when structure, liquidity, and macro fundamentals align.
Let me break it down:
Technical Perspective
BTC just pulled a classic trap.
✅ Liquidity Sweep: Price dipped below the 4PDL (Previous Day's Low), sweeping out late longs and triggering emotional shorts.
✅ Break of Structure (BOS): Price broke cleanly broke strucutre, confirming bullish intent.
✅ Fair Value Re-entry Zone: We now have a clean FVG zone if price pulls back.
But that’s not all...
🔼 Retail Pattern Detected :
Look closely, there's a textbook ascending triangle in there. Retail traders often use it to predict bullish breakouts. What they see as a triangle, we see as smart money coiling pressure before the move.
Fundamentals Supporting the Structure
This move isn’t just technical, it’s backed by real market weight:
Public companies are buying Bitcoin by the billions: MicroStrategy, Trump Media, Metaplanet they’re not “speculating,” they’re storing BTC as a treasury asset.
Institutional inflows are accelerating: ETFs, sovereign interest, and large-cap investors are building long positions — and it’s beginning to reflect in the chart.
The U.S. is formalizing a Bitcoin reserve policy.: Call it political, strategic, or monetary — either way, it reinforces that dips like this are being bought by giants.
The candle doesn’t lie but neither does the macro narrative when they both point in the same direction.
Mindset Tip: Ride Logic, Not Emotion
This setup teaches us something important:
You don’t have to catch every move. You just need to understand why it moved — and position accordingly.
If it pulls back, don’t panic. Let the market invite you, not rush you.

BTC/USDT Bullish Reversal Zone AnalysisSupport Zone:
The horizontal purple box (~104,000 USDT area) has acted as a strong support/resistance flip zone multiple times.
Falling Wedge Breakout:
The price action broke out of a falling wedge pattern earlier, confirming bullish momentum.
Flag Formation (Current):
A smaller bullish flag/pennant appears to be forming, and a breakout above could trigger a strong upward move.
Projected Move:
The black arrow indicates a potential bounce from this support zone, with the price targeting the 111,000–112,000 USDT zone (highlighted in the top purple box).
Volume Spike:
Notable volume spike near the bottom supports the idea of accumulation and possible reversal.
📈 Conclusion:
If the support zone holds and price breaks above the minor flag, a bullish continuation is likely toward the 111,000–112,000 resistance area. Traders should watch for confirmation of a breakout and volume increase for validation.

"Bearish Reversal Opportunity Following Supply Zone Rejection"1. Double Top Formation (Resistance Level Identified)
The chart displays a clear double top structure at the 2,760–2,800 USDT level.
This level has acted as a strong supply zone (highlighted in red), where price previously reversed, indicating heavy selling interest.
Current price action has retested this resistance zone and shown signs of rejection.
2. Liquidity Sweeps & False Breakouts
On the left side of the chart, an aggressive downward wick (marked with a blue arrow) suggests a liquidity sweep below a key low before strong bullish momentum returned.
This type of price action indicates smart money involvement, designed to remove weak hands before pushing price higher.
3. Accumulation Phases (Sideways Consolidation)
Multiple accumulation ranges are highlighted with blue rectangles.
These ranges show horizontal consolidation, where price builds up energy before breakout.
The most recent breakout led to a vertical rally toward the resistance zone, signaling an end of the accumulation and a start of distribution.
4. Double Bottom Support Structure
Identified near the 2,480 level, marked by red circles.
This level has historically acted as demand/support, evidenced by multiple bounces from this price zone.
Now highlighted with a grey zone, it is projected to act as the next key support area.
5. Bearish Projection
A large black arrow suggests a forecasted bearish move from the current high (~2,800) back to the support zone (~2,480).
This aligns with the idea of a mean reversion or pullback after a strong bullish impulse.
---
Conclusion & Trade Idea:
🔻 Bias: Bearish (Short-term)
The chart presents a classic reversal pattern with a double top at a well-defined supply zone.
Entry could be considered after confirmation of rejection from this level.
🧠 Trade Plan Suggestion:
Entry: Short near 2,780–2,800 after bearish confirmation (e.g., bearish engulfing candle or break of structure).
Target: 2,480 (support zone).
Stop Loss: Above 2,820 (recent high).
Risk-Reward: Approximately 1:2.5 or better depending on execution.

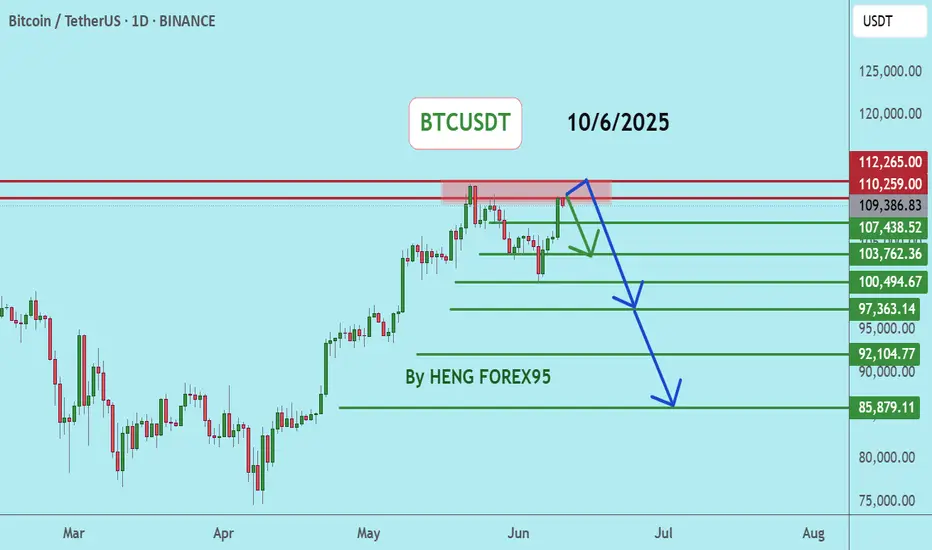
BTCUSDTBTCUSDT price is now near the resistance zone 110259-112265. If the price cannot break through the 112265 level, it is expected that the price will drop. Consider selling the red zone.
🔥Trading futures, forex, CFDs and stocks carries a risk of loss.
Please consider carefully whether such trading is suitable for you.
>>GooD Luck 😊
❤️ Like and subscribe to never miss a new idea!
You can't unsee itThere is something to be said for the simplicity.
The historical price action is clear.
The RSI trend/cycles are just as clear.
There is not much space left for compression.
A BIG MOVE IS COMING.
The only question is, are you ready?

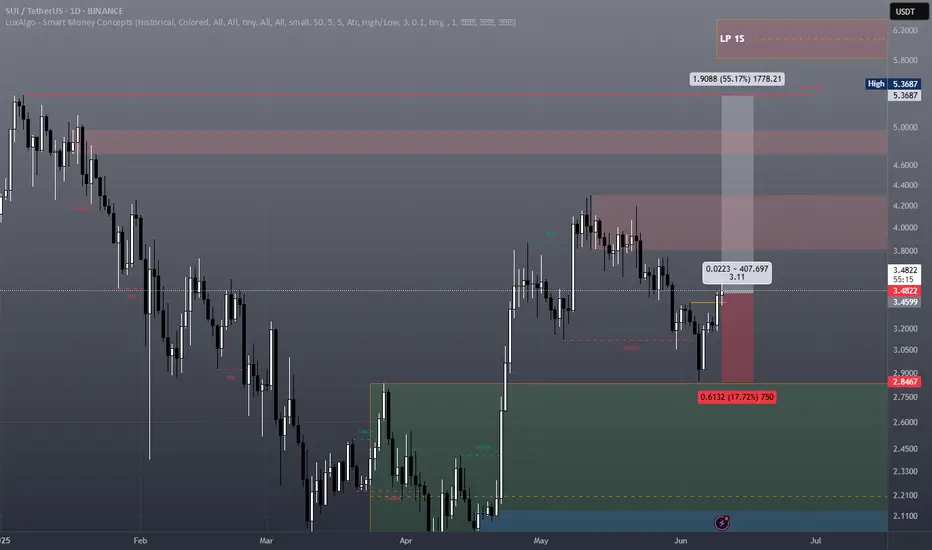
SUI - SWING TRADESUI – Swing towards the ATH and aiming to create a new one, reacting within a weekly Liquidity Pool between 5.83 and 6.35.
LFG!
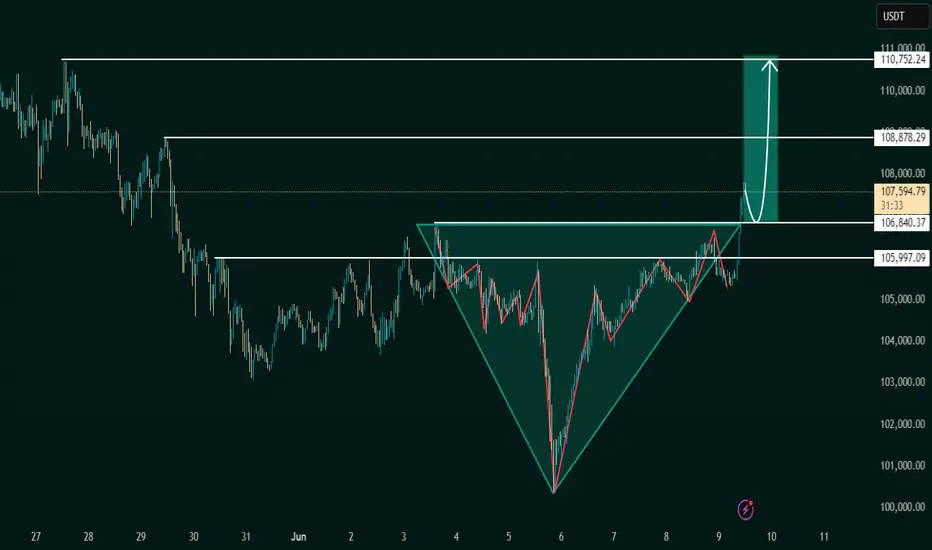
Inverse Head and Shoulders Breakout Signals BullishThe chart under review presents a classic Inverse Head and Shoulders pattern, a reliable and widely recognized bullish reversal formation in technical analysis. This structure typically forms after a downtrend, indicating a potential shift in market sentiment from bearish to bullish.
The pattern is composed of:
Left Shoulder: A modest price decline followed by a temporary upward correction.
Head: A deeper price decline forming the lowest point in the pattern.
Right Shoulder: A higher low that mirrors the left shoulder, followed by another upward movement.
The neckline, which acts as a critical resistance level, is clearly illustrated at approximately 106,840.37 USDT. A confirmed breakout above this neckline suggests the completion of the reversal pattern and validates the potential for a sustained bullish movement.
2. Breakout Confirmation
The current price action confirms a successful breakout above the neckline, with the market currently trading around 107,586.58 USDT. This breakout is a key signal for bullish continuation, provided it is supported by increased volume and follow-through price action.
From a technical standpoint, the breakout is reinforced by:
A clean violation of neckline resistance
Price consolidation near breakout zone before a strong upward thrust
Higher lows preceding the breakout, indicative of growing buying pressure
This confluence of technical signals strengthens the case for an upward price trajectory in the near term.
3. Projected Price Targets
Upon confirmation of the Inverse Head and Shoulders breakout, target levels can be derived using the measured move technique. This involves projecting the vertical distance from the head to the neckline upward from the breakout point.
Target 1 (Initial Resistance):
108,878.29 USDT – This level represents a potential short-term resistance where price may consolidate or retrace slightly before continuing.
Target 2 (Measured Move Completion):
110,752.24 USDT – This is the ultimate price target derived from the height of the head-to-neckline structure. Reaching this level would represent the full realization of the reversal pattern.
4. Key Support and Risk Levels
Risk management is a critical component of any trading strategy. The following support levels should be closely monitored:
106,840.37 USDT (Neckline Support):
Former resistance turned support. Holding above this level post-breakout is essential for sustaining bullish momentum.
105,997.09 USDT:
Acts as a secondary support level and potential stop-loss region for conservative traders.
If price fails to hold above the neckline and falls back below these levels, the breakout could be classified as a false breakout, warranting caution.
5. Strategic Implications for Traders
This setup provides a favorable risk-to-reward ratio for long entries, particularly for traders seeking to capitalize on momentum-based patterns. An optimal trading approach could involve:
Entry: Near the neckline breakout or on a minor retest of 106,840.37 USDT
Stop-Loss: Below 105,997.09 USDT or under the right shoulder to account for volatility
Take-Profit Zones: Partial profits near 108,878.29 USDT, with final target at 110,752.24 USDT
6. Final Remarks
This chart illustrates a textbook example of a bullish reversal pattern in play. While the technical outlook is favorable, traders should remain cautious of potential invalidation scenarios, especially in highly volatile or news-driven markets. Confirmation through volume analysis and supportive macro/fundamental conditions can further enhance confidence in the bullish thesis.
Overall, the current setup indicates a well-structured opportunity for upward price movement, with a clearly defined entry, risk, and reward framework.
Let me know if you'd like this tailored for a trading journal, client report, or automated strategy setup
Bullish continuation?Ethereum (ETH/USD) is falling towards the pivot and could bounce to the 1st resistance.
Pivot: 2,364.01
1st Support: 2,548.35
1st Resistance: 2,788.17
Risk Warning:
Trading Forex and CFDs carries a high level of risk to your capital and you should only trade with money you can afford to lose. Trading Forex and CFDs may not be suitable for all investors, so please ensure that you fully understand the risks involved and seek independent advice if necessary.
Disclaimer:
The above opinions given constitute general market commentary, and do not constitute the opinion or advice of IC Markets or any form of personal or investment advice.
Any opinions, news, research, analyses, prices, other information, or links to third-party sites contained on this website are provided on an "as-is" basis, are intended only to be informative, is not an advice nor a recommendation, nor research, or a record of our trading prices, or an offer of, or solicitation for a transaction in any financial instrument and thus should not be treated as such. The information provided does not involve any specific investment objectives, financial situation and needs of any specific person who may receive it. Please be aware, that past performance is not a reliable indicator of future performance and/or results. Past Performance or Forward-looking scenarios based upon the reasonable beliefs of the third-party provider are not a guarantee of future performance. Actual results may differ materially from those anticipated in forward-looking or past performance statements. IC Markets makes no representation or warranty and assumes no liability as to the accuracy or completeness of the information provided, nor any loss arising from any investment based on a recommendation, forecast or any information supplied by any third-party.

₿ BTC: Upside Potential Remains IntactBTC posted modest gains over the weekend, but more upside is expected in our primary scenario. We continue to track a corrective advance in green wave B, with the potential to extend into the upper blue Target Zone between $117,553 and $130,891. From that top, wave C should initiate a downward move into the lower blue zone between $62,395 and $51,323—completing orange wave a. Subsequently, we anticipate a bounce in wave b, followed by another decline in wave c, which should conclude the larger correction of blue wave (ii). There is still a 30% chance that blue wave alt.(i) could make a new high, extending beyond the Target Zone and delaying the broader corrective sequence.
📈 Over 190 precise analyses, clear entry points, and defined Target Zones - that's what we do.

Bitcoin Breaks below $102,500 Support : Watch For RejectionIf you have been following my research on Bitcoin, you already know I published a prediction of a Double-Top pattern and a potential breakdown in Bitcoin on May 20, 2025.
TradingView selected this video as an Editor's Pick and it received thousands of views.
Thank you for all the great comments and questions from everyone.
Now, after about 3+ Weeks, we are starting to see BTCUSD move below my $102,500 support level (my breakdown level) and this could be the start of a broad downward price phase for BTCUSD and US/Global assets.
If you have followed any of my longer-term research, you'll quickly understand why I believe the US markets will struggle through most of 2025 as the world attempts to adjust to Trump leadership. This uncertainty will likely result in a sideways-consolidation phase in many global markets and a disruption of hard and soft assets.
In this regard, you can read the content of my original post (May 20).
Right now, I want to warn you that an immediate price rejection of the breakdown move is likely - possibly targeting $105k or higher.
This type of rejection is very common before price makes a much bigger move. So, be prepared for BTCUSD to attempt to reject and move back above $105k, then stall and break downward very hard - trying to move below $80k in an initial downward price phase.
It's going to be very interesting to see how this plays out with my broad cycle research. I'm still expecting a July 2025 and October 2025 MAJOR LOW cycle phase to play out.
Buckle up.
Get some
#trading #research #investing #tradingalgos #tradingsignals #cycles #fibonacci #elliotwave #modelingsystems #stocks #bitcoin #btcusd #cryptos #spy #gold #nq #investing #trading #spytrading #spymarket #tradingmarket #stockmarket #silver

ALTseason May Show Up In 2025We found an interesting chart, which is showing us the ratio of TOTAL3(ALTcoins) market cap against Bitcoin with ticker TOTAL3ESBTC. Well, even this chart is showing that ALTcoins may start outperforming BTC soon. It can be finishing final subwave C of (Y) of a correction in blue wave B that can cause a new strong rally into wave C, which can bring the ALTseason similar as in the beginning 2021.

Crypto Market Slows Down For A Correction Within UptrendCrypto market nicely slowed down as expected and Crypto TOTAL market cap chart can now be finishing a projected wave 4 correction right at the former wave "iv" swing low and channel support line, which is ideal textbook technical picture that can now send the Crypto market higher for wave 5, especially if bounces back above 3.3T area and channel resistance line.
However, even if it's going to face deeper and more complex correction within higher degre wave (2) down to 3.0T - 2.8T area, sooner or later we can expect a bullish continuation, as Crypto TOTAL market cap chart is not at the all-time highs yet.

BTC/USDT – Bitcoin 1 hour timeframe 📊 Technical Overview
🟢 Support Zone:
📌 Around $105,700
🛡 Marked by multiple bounces (white arrows), this zone shows strong buyer interest.
🔁 Historically acts as a springboard for upside moves 📈.
🔴 Resistance Zone:
📌 Range: $109,000 – $111,500
🚫 Every approach has triggered a sharp sell-off (black arrows), confirming this zone as significant supply.
🔄 Price Action & Pattern Insights
📉 Bearish Swings from Resistance:
Several high-wick candles followed by strong rejections ⛔
Downward arrows suggest a distribution phase near the top range
📈 Bullish Reversal Signals:
Price sharply rebounds from support 💥
V-shaped recovery setup in motion with a clean reaction from the demand zone ✅
Arrow projection hints at a potential full range recovery 🌈
📦 Box Range Formation:
Market has been consolidating in horizontal zones
Each zone acts as a base for accumulation or distribution 🧭
🎯 Trade Idea & Forecast
📍 Current Price: $105,793.35
📈 Projected Move: Upside rally toward $111,000+
🧠 Rationale:
Bounce from a major support zone
Prior similar price actions led to parabolic rises 🚀
No lower lows made – signs of a bottom forming 🪙
📌 Action Plan
✅ Long Setup:
Entry: Above $106,000
Target: $109,000 – $111,500
Stop Loss: Below $105,000
📉 Risk/Reward: Favorable (~1:3)
🚫 Bearish Alternative:
Breakdown below $105,000 with volume ❗
Target: $103,000 (next liquidity zone)
📎 Conclusion: Ready for a Bullish Comeback?
Bitcoin (BTC/USDT) is showing signs of a textbook bullish reversal 📘 after defending a key demand level 💪. If the current momentum holds, we could see a swift move back to the top of the range. Ideal for short-term buyers looking to ride the intraday wave 🌊.

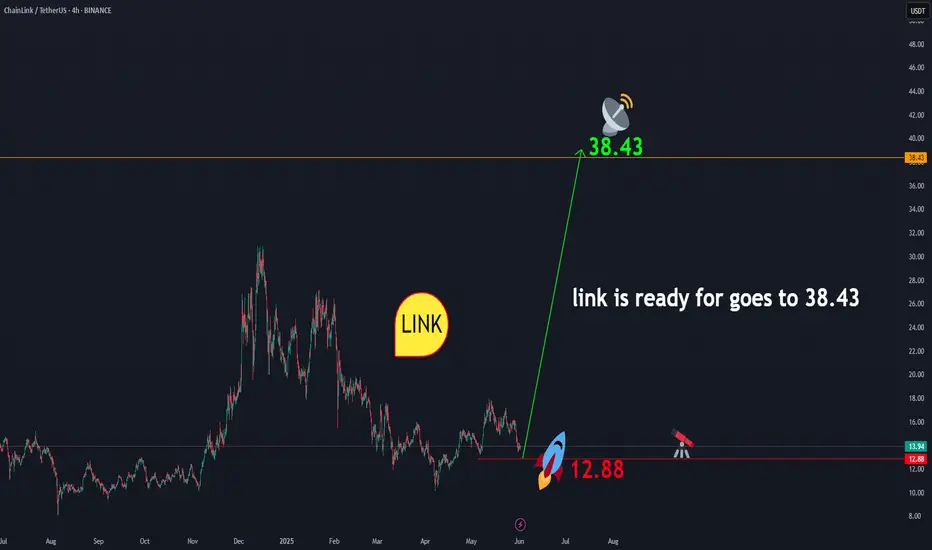
linkusdtLINK is showing readiness to initiate an upward movement towards $38.43. From the current price range of $13.93, a correction down to the $12 area is possible. This zone presents a favorable opportunity for long-term investment . In any case, according to the geometry that has formed in LINK, the price level of $38.43 is expected to be achieved. And this is certain.
BINANCE:LINKUSDT
Breakdown Alert: Crypto Market Cap Tests Major Demand ZoneThe total crypto market cap is testing a key support zone around $3.23T. This area has acted as a demand zone in the past, and now price is hovering right above it.
The current structure suggests a possible breakdown–retest–continuation setup. If price retests this zone from below and fails to reclaim it, further downside toward $3.0T could be likely.
This idea is based on price action and structure only — no indicators used.
❗ This is a personal analysis for educational purposes only. Not financial advice.
Feel free to share your thoughts or technical perspective in the comments

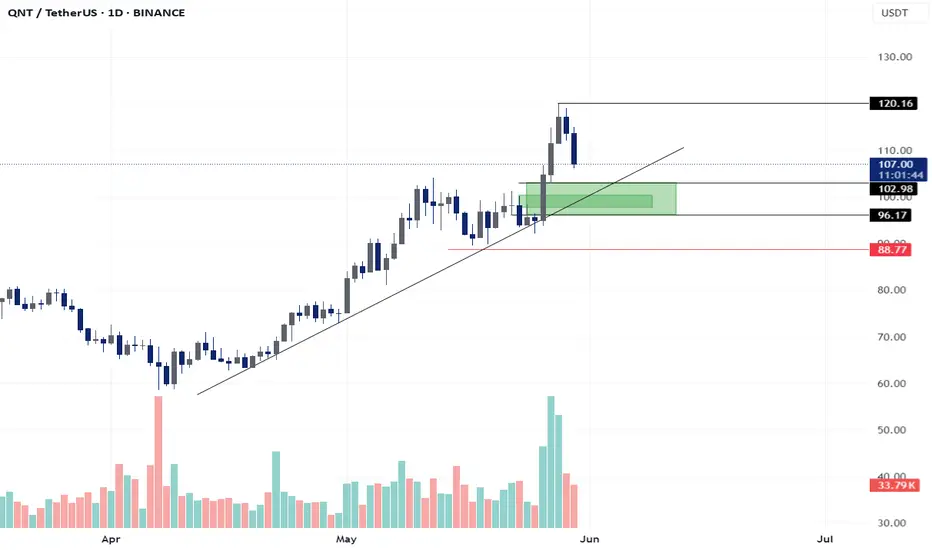
QNT - FVG Long Set-UPBINANCE:QNTUSDT
🔍 𝐊𝐞𝐲 𝐙𝐨𝐧𝐞𝐬:
Support Zone (Demand): $96.17–$102.98 (green box)
Former resistance turned support.
Aligns with ascending trendline – a critical confluence zone.
𝐒𝐭𝐨𝐩-𝐋𝐨𝐬𝐬 𝐋𝐞𝐯𝐞𝐥: $88.77
Below structural low and invalidation of bullish thesis.
Target Zone (Resistance): $120.16
Previous local high and psychological round numbe
#XRP MARKET STRUCTURE | DAILY OUTLOOK | MAY 2025📊 *XRP - Strong Support & Breakout Watch | Daily Timeframe*
XRP is currently holding above a major support zone around the 102B market cap level. Price has shown multiple rejections from this zone, indicating strong buying interest.
🔹 *Key Levels:*
- *Support Zone:* 102B (Strong Demand Area)
- *Resistance Zone:* 147B (Breakout Level)
📈 *Market Structure:*
Price is forming a potential accumulation pattern. If this structure holds, we might see a bullish reversal towards the resistance, followed by a possible breakout.
📌 *Bullish Scenario:*
- Bounce from support
- Retest of previous high
- Breakout above resistance
📌 *Invalidation:*
- If price closes below 102B support zone, setup may fail and a deeper drop could follow.
🧠 *Note:* This is not financial advice. Always do your own analysis before trading.
#XRP #CryptoAnalysis #TechnicalAnalysis #Breakout #SupportResistance

XRUSD Price Market Trend Day TF Long Term BUYXRPUSD is trading at 2.33674, with a strong recommendation to buy for long-term gains. The chart indicates a potential upward trajectory, with price targets set at:
TP1: 2.44200 (Near-term resistance)
TP2: 3.00500 (Mid-term target)
TP3: 3.40000 (Long-term bullish goal)
The mention of 3.40000 at the top of the chart suggests this is a psychological resistance level, reinforcing the optimistic outlook if bullish momentum sustains.

SOLUSD Trend Analysis DAY TF BUY The provided chart and analysis outline a bullish outlook for SOL/USD (Solana against the US Dollar) as of May 26, 2025. The current price is noted at **177.71**,
with a strong recommendation to look for long/buy entries, particularly on dips. The analysis emphasizes long-term holding for optimal results, with three key profit targets: **TP1: 194.00, TP2: 227.00, and TP3: 252.00**.
**Key Observations from the Chart**
1. **Long-Term Bullish Trend**: The analysis highlights that Solana’s long-run trajectory has significant upside potential. The suggested strategy involves accumulating positions gradually, especially during price retracements, to maximize gains over time.
2. **Green Zone as Critical Support**: The chart indicates a "green zone," which acts as a crucial support area. If the price crosses below this zone and closes a candle beneath it, the bullish setup becomes invalid, signaling a potential trend reversal or deeper correction.
3. **Risk Management**: Traders are advised to exercise caution by using smaller quantities on each dip and conducting due diligence before entering trades. This approach minimizes risk while capitalizing on upward momentum.

Pi Network Price Prediction DAY Chart BUY AnalysisThe Pi Network (PI/USDT) is attracting increased attention from crypto traders and long-term investors alike, with growing speculation about its future price potential.
Based on the current technical chart dated May 26, 2025, several critical insights and projections can be drawn for those considering investment in this digital asset.
This analysis reflects personal views and does not constitute financial advice.
At the time of analysis, PI/USDT is trading at **$0.7812**, with visible consolidation just above the key support zone.
The chart displays three major **Take Profit (TP)** targets, reflecting potential bullish momentum in the medium to long term:
TP1: $1.0000
TP2: $1.6700
TP3: $3.0000

₿ Bitcoin Weekly Chart – Is Wave 5 Now in Motion?Bitcoin has found strong support and looks to be powering higher again. Based on Elliott Wave structure, we may now be entering the final leg of this major impulsive wave sequence—Wave 5.
✅ Support Held at a Classic Level
Wave 4 recently pulled back to the 38.2% Fibonacci retracement level of Wave 3—an area that often serves as key support in bullish Elliott Wave trends.
This bounce suggests buying interest remains strong at this level.
📈 Next Target: Wave 5 Projection
If the current structure holds, Wave 5 could aim for the 61.8% Fibonacci extension of Wave 1 + Wave 3, which points to a potential target around $132,669.
This level lines up with the upper boundary of the ascending channel, offering a confluence of resistance.
⚠️ One Caution: The Wave 3 Structure
While the count remains valid, Wave 3 lacks ideal symmetry, and may not exhibit the “right look” that Elliott Wave theory often prefers.
This introduces a slightly lower confidence level, but not enough to invalidate the primary bullish scenario.
🧠 For Beginners:
Elliott Waves are patterns of market behavior. A full trend typically moves in five waves, with Wave 5 often being the final push before a larger correction. Fibonacci levels help us project where waves may end based on the size of prior moves.
📌 Summary:
Wave 4 found strong support at 38.2%.
Wave 5 may now be in progress, targeting $132,669.
Keep an eye on price action near the top of the channel to gauge momentum and potential exhaustion.
If Bitcoin can maintain its trajectory, we may soon test the highs projected by this wave count.
