ETHUSDT – 4H Outlook long IdeaETH is still holding above key support after a market structure shift (MSS).
Price rejected from resistance and is now pulling back into a demand zone.
Bias
As long as support holds, we can see a bounce and continuation higher.
A clean reaction from demand could offer a high RR long setup.
Invalidation
Loss of the demand zone = bullish idea invalid.
Already long from CMP, looking to add at the EP on this setup.
Patience here — let price come to you.
What are you watching next: bounce from support or deeper pullback? 👀📊
Cryptotrading

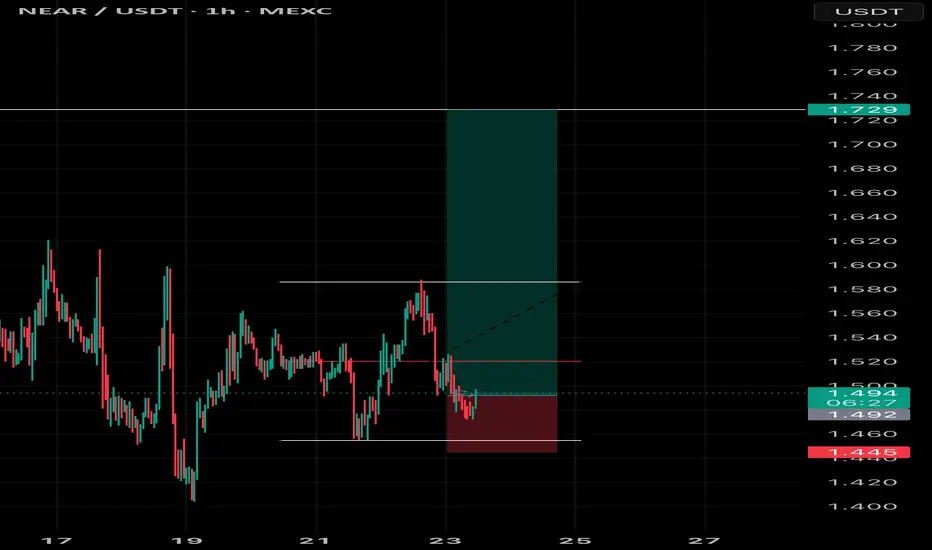
NEAR / USDT – 1HNEAR / USDT – 1H
Bullish context remains intact.
On Total Market Cap we saw a clear 4H MSS close, followed by a clean 50% retrace.
NEAR is showing the same structure and reaction.
Price is currently reacting from the 50% retracement / discount zone, with support holding.
As long as this level holds, bias stays bullish
This looks like a continuation setup in line with HTF market structure.
What do you expect next: a small liquidity sweep below support or direct continuation to the upside? 📈
BNB Approaching Key Support – Potential Bounce SetupBNB is moving toward a major support zone between $800 – $820. This area has historically served as a demand zone, and we're watching for bullish price action or a potential reversal signal around this level. If support holds, there's a strong chance for price rotation back toward the mid-range of the broader structure.
💡 Trade Setup Idea:
Entry Zone: $800 – $820 (Support)
Take Profit Targets: $890 / $976 / $1168
Stop Loss: $742 (below structure)
A bounce from this level could offer a solid risk-reward setup. Always wait for confirmation (e.g. bullish engulfing, volume spike, or momentum shift) before entering. Manage your risk carefully.
#BNB #Crypto #BinanceCoin #TradingView #CryptoTrading #TechnicalAnalysis #SupportAndResistance #PriceAction

SUIUSDT – Trade ideaSUI is trading inside a broader downtrend but is currently reacting from a key demand area with multiple FVGs below.
Price already tapped the upper imbalance and may sweep lower liquidity before continuation.
Positioning
Already in the trade.
Looking to add more on deeper pullbacks into the lower FVG, aiming for a higher time-frame mean reversion move.
Bias
As long as price holds above invalidation, this remains a pullback-to-imbalance long setup.
Patience is key — let price fill the imbalance.
MrC

LINKUSDT – Weekly TimeframePrice is currently reacting at a major support zone that has been respected multiple times in the past.
This area previously acted as both support and resistance, making it a key decision point for the market.
Market structure
Higher timeframe structure is still correcting
Price is testing a previous support area
Momentum has slowed down, showing hesitation
Scenario 1 – Support holds (bullish):
If buyers step in and this support holds, we could see a relief move towards the next resistance zone, where price was previously rejected.
Scenario 2 – Support fails (bearish):
If this support breaks with a strong close, price may continue towards the lower support zone, which acted as a base earlier in the structure.
Conclusion:
Price is at a make-or-break area. Waiting for confirmation is safer than anticipating the move.
Do you expect a bounce from support or a breakdown continuation?
MrC

BTCUSD 1H – Liquidity Above Highs with Bullish Continuation SetuThis chart shows Bitcoin (BTCUSD) on the 1-hour timeframe with a clear focus on market structure, liquidity, and key zones.
Price previously experienced a break of structure (BOS), followed by a strong impulsive move, indicating institutional participation. After the impulse, the market formed equal highs, creating a visible liquidity pool above the resistance zone. This area is likely to attract price for a liquidity grab.
Currently, price is pulling back toward the Last Low, which is acting as a key short-term support level. Below this, a well-defined support zone is marked as a strong demand area where buyers are expected to step in.
As long as price holds above the Last Low and support zone, the overall structure remains bullish. The current pullback is considered corrective, not a trend reversal. A bullish confirmation from support can lead to a continuation move toward the equal high liquidity and resistance zone, and potentially to new highs.
The projected price path highlights a pullback → consolidation → bullish continuation, aligning with smart money and liquidity-based trading concepts.

BTCUSD at Trendline Resistance – Breakout or Rejection?BTCUSD (BTCUSDT Perpetual) – 30-Minute Structure Breakdown & Decision Zone
Technical and Fundamental Analysis
Bitcoin is currently trading in a short-term corrective phase after printing a local high near the 90K region. The recent price action shows a clear shift from impulsive bullish movement into controlled bearish structure, characterized by lower highs and lower lows.
The chart highlights a descending trendline, which is acting as dynamic resistance, consistently rejecting price on each retest.
Trendline S/R Interchange (Key Concept)
One of the most important elements on this chart is the Trendline Support–Resistance Interchange:
Previous bullish support has now flipped into resistance.
Each pullback into the descending trendline attracts sellers.
This behavior confirms trend continuation pressure unless structure breaks.
This is a classic sign of market acceptance below resistance.
Mini Reversal Zone – Demand Reaction
Price recently dipped into a Mini Reversal Zone, marked by:
A previous demand imbalance
Strong reaction candles
Short-term liquidity sweep
The bounce from this area is technical, not impulsive — meaning it is likely a pullback, not a trend reversal yet.
Current Price Location – Decision Point
Bitcoin is now trading exactly at a key decision area, where:
Descending trendline resistance
Minor horizontal level
Short-term bullish pullback
all converge.
This zone determines the next directional move.
➡️ Market is neutral here — no blind entries.
Projected Scenarios
Scenario 1 – Structure Hold (Sell Setup – Higher Probability)
Price rejects from the trendline
Bearish candle confirmation appears
Continuation toward lower support zones
Sellers remain in control
Scenario 2 – Structure Break (Buy Setup – Conditional)
Strong 30m candle closes above the trendline
Follow-through volume confirms acceptance
Retest holds as support
Upside continuation toward higher resistance
As marked on the chart:
“If this structure follows → Buy | If rejection → Sell”
Volume & Momentum Insight
No aggressive bullish volume is present yet
Momentum remains corrective
Buyers must prove strength with structure break + hold
Without confirmation, upside moves are vulnerable to rejection.
Trading Mindset & Risk Management
This is a reaction-based trade environment, not a prediction zone.
Let price confirm direction
Avoid emotional entries at trendline
Wait for either rejection confirmation or clean breakout & retest
Professional traders trade confirmation, not hope.
Conclusion
BTC is at a critical technical junction. The trendline defines control. Until price decisively breaks and holds above it, the bearish bias remains intact. Smart traders will wait for the market to choose a side before committing capital.

Can #SNX Recover From Here or Will it Continue to Fall?Yello, Paradiser! Are you prepared for the moment when #SNXUSDT finally decides whether it will punish late bears or wipe out impatient longs? Let's look at the #Synthetix trade setup:
💎#SNX is currently trading around $0.418 on the 4H timeframe and remains stuck inside a clearly defined descending channel, respecting both the descending resistance and descending support with high precision. This type of structure tells us one thing very clearly: the market is compressing, and a decisive move is getting closer.
💎Price is now sitting just above a key demand zone around $0.38–$0.39, where buyers have already shown interest multiple times. This zone is crucial. As long as #SNXUSD holds above it, bulls still have a chance to regain control. The chart also highlights that a clean breakout above the descending resistance, combined with a reclaim of the 50 EMA as support, would significantly increase the probability of a bullish continuation.
💎If that bullish scenario plays out, the first upside target sits at the moderate resistance near $0.51, followed by a much more important strong resistance around $0.60–$0.61. A move toward those levels would likely happen fast, as many traders are currently positioned defensively and would be forced to react to a breakout.
💎However, this setup comes with a very clear invalidation. If price loses the $0.38 support zone decisively, the bullish idea is off the table. A breakdown below this level would confirm weakness and open the door for a deeper move toward the $0.33 support zone, where the next significant liquidity sits. That scenario would likely come with increased volatility and emotional selling from inexperienced traders.
Trade smart, Paradisers. This setup will reward only the disciplined.
MyCryptoParadise
iFeel the success🌴

TOTAL Market Cap – 4H UpdateIn my previous update I highlighted a key level to watch.
That level has now been cleanly reclaimed with a strong 4H candle close, confirming strength.
Since then, we’ve seen a 50% retracement, which is a healthy pullback after the impulsive move.
With this structure in place, I’m switching my bias to bullish.
Context
Key level successfully reclaimed
Strong 4H close confirms acceptance
50% retracement completed
Multiple long setups already shared align with this higher-timeframe context
Are you positioning with the higher-timeframe bias or still waiting for confirmation? 📊👀
Please share your toughts
MrC

FETUSDT – Trade ideaFET has shown a local market structure shift (MSS) and is currently pulling back into a key demand zone.
This setup aligns with a TOTAL Market Cap MSS on the 4H, supporting a broader bullish continuation scenario.
Bias
As long as price holds above demand, a bounce and continuation higher is favored.
Confluence with TOTAL MC MSS (4H) increases the probability of this move.
Invalidation
Acceptance below demand invalidates the bullish setup.
Are you waiting for reaction at demand or already positioned? 📊👀
MrC

XRPUSDT – Trade ideaXRP has printed a market structure shift (MSS) and is consolidating above key support.
Price is currently pulling back into a local demand zone after a rejection from range highs.
Bias
As long as price holds above demand, a bounce and continuation higher remains likely.
This area offers a clean high RR long opportunity if buyers step in.
Invalidation
Acceptance below demand invalidates the bullish setup.
Let price do the work.

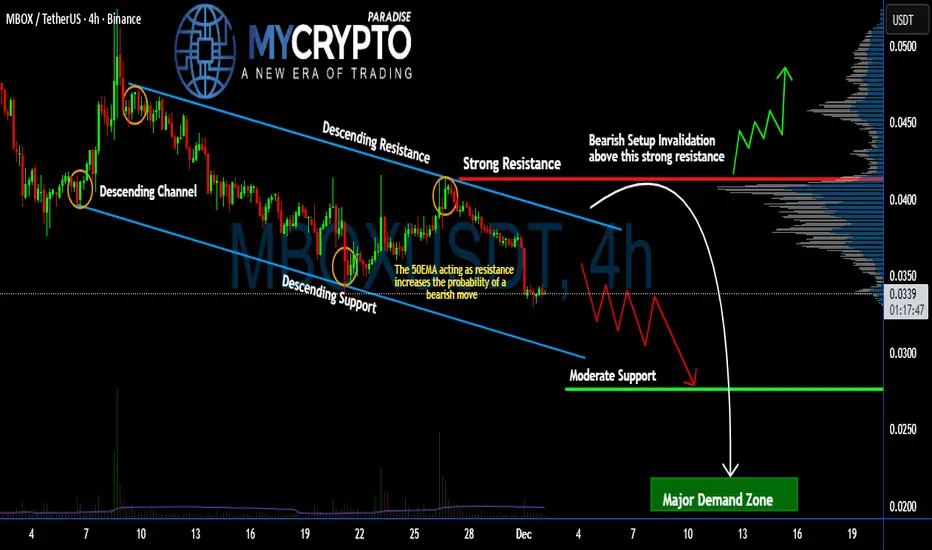
Is #MBOX Ready For Another Leg Down or Not? Bears in ControlYello Paradisers! Is #MBOXUSDT going for another wave of bearish moves, or will it recover from here? Let's break down the #Mobox setup:
💎#MBOX is currently trading within a clean descending channel, showing repeated rejections from the upper resistance line. This bearish structure has held strong, and with the 50 EMA now acting as dynamic resistance, the odds are tilting further in favor of downside continuation.
💎The current price of #MBOXUSD is $0.033, sitting right below both the descending resistance and strong horizontal resistance. As long as price remains under the $0.041 invalidation zone, the bearish setup remains active. A breakdown from here opens the door toward lower support levels.
💎First area to watch is the moderate support zone at $0.027, but the real liquidity and potential buyer interest lie much lower in the major demand zone, just above $0.020. A clean move into this area would likely trap late shorts and offer a powerful reversal opportunity, but only once the selling pressure exhausts.
💎To flip the bias bullish, price must break and hold above $0.041. This level has acted as a clear resistance, and reclaiming it would invalidate the current bearish structure, opening up a strong rally opportunity toward higher value zones.
Trade smart, Paradisers. This setup will reward only the disciplined.
MyCryptoParadise
iFeel the success🌴
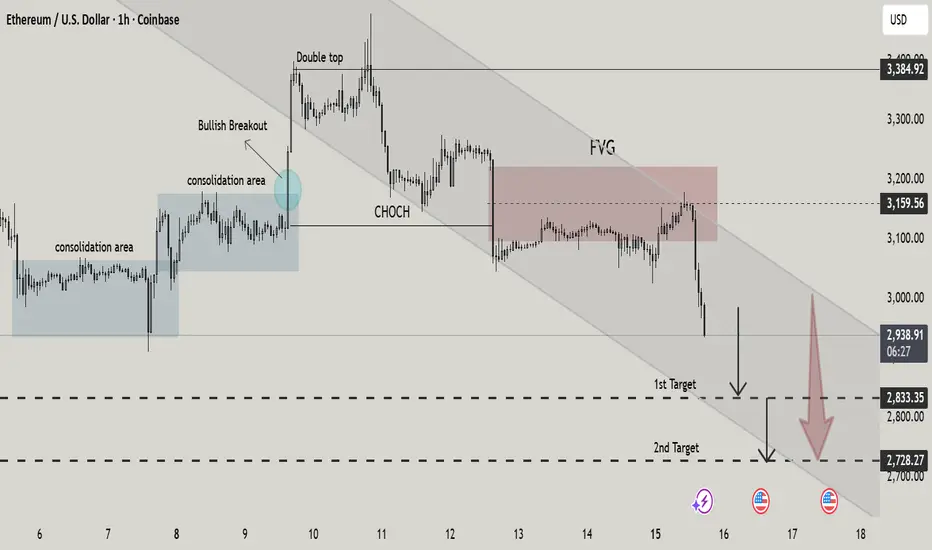
ETH/USD – Bearish Shift After DistributionThis 1H ETH/USD chart highlights a clear transition from consolidation to distribution and then into a bearish trend. Price first ranged in tight consolidation zones before a bullish breakout that ultimately failed, forming a double top near the highs. A confirmed CHoCH (Change of Character) signaled bearish control, followed by rejection from a Fair Value Gap (FVG) within a descending channel.
With downside momentum increasing, price is now targeting lower liquidity levels, with $2,833 as the first target and $2,728 as the second. Overall structure favors continuation to the downside unless price reclaims the channel and invalidates the bearish bias.
BTC BUY TRADE SETUP PREMIUM ANALYSIS.BTCUSD — Trade Setup
📈 Bias: Bullish
🎯 Entry: 87,600 / 87,900
🛑 Stop Loss: 86,500
🎯 Target: 89,000
📊 Technical Reasoning:
BTCUSD is maintaining bullish momentum after holding above a key support zone. The entry area is positioned where buyers are expected to defend price and continue the move higher. The stop loss is placed beyond the invalidation level to manage downside risk, while the target is aligned with a higher liquidity objective and continuation structure.
📌 Execution Plan:
* Buy from the marked entry zone
* Apply disciplined risk management
* Monitor price behavior as it approaches the target
❌ Invalidation:
A clear break and close below 86,500 would invalidate this bullish setup.
💬 Do you expect continuation toward 89,000, or consolidation before the next leg up?

BTCUSDT – A Bullish Scenario Is Gradually Taking ShapeAfter a phase of correction and consolidation , Bitcoin is beginning to show signs of renewed stability to the upside , especially when viewed within the context of current macro news and technical structure.
On the fundamental side, expectations that the Fed will maintain a more dovish stance , along with declining yields, are creating a favorable environment for risk assets. Capital flows are returning to crypto cautiously but selectively, allowing BTC to hold a solid price base after the recent pullback.
From a technical perspective, BTCUSDT is currently:
Holding firmly above the key support at 87,400, aligning with a demand zone and the base of the latest rebound
Gradually breaking free from the descending trendline pressure, signaling that selling pressure is clearly weakening
Ichimoku indicators show price returning to equilibrium, setting the stage for a controlled recovery move
The current structure supports a higher-low formation, which is the foundation for a continuation of the uptrend
Preferred scenario:
As long as BTC holds above 87,400, there is a high probability of a recovery toward the 91,500 zone — an area of concentrated liquidity and near-term resistance. The current minor pullbacks should be viewed as buy-the-dip opportunities within the trend, rather than signals of a trend reversal.

BTCUSD – Downside Pressure Remains in ControlAfter a period of strong volatility, Bitcoin is entering a phase of “catching its breath” as market sentiment shifts toward a defensive stance . Short-term capital has become more cautious, while macro factors and interest-rate expectations remain unclear, failing to trigger a fresh risk-on wave. As a result, BTC is struggling to sustain meaningful rebounds.
From a technical perspective, the outlook is tilted toward a bearish trend . Price has been repeatedly rejected at the descending trendline and is currently trading below the Ichimoku cloud, confirming that sellers remain in control of the primary trend. The 88,300 zone is acting as near-term resistance, where rebounds are likely to face profit-taking and renewed selling pressure.
On the downside, 84,300 stands out as a key support level. Given the current structure, upward moves are more likely to be technical pullbacks rather than genuine reversals. If price fails to break and hold above 88,300, BTC is likely to remain under pressure and retest the 84,300 zone, or even move lower should selling momentum accelerate.
In summary, the short-term bias remains bearish. The more prudent approach is to patiently wait for pullbacks to align with the trend, rather than rushing to catch a falling knife. Bitcoin is at a critical juncture, and price reaction at key resistance levels will determine the market’s next move.

TRX / USDT PERP – 4H Trade IdeaTRX is currently trading below a bearish order block, after a clear market structure break (MSB) to the downside.
🔴 Short bias
Rejection from bearish OB
MSB confirmed
No bullish displacement yet
Short idea
Entry: rejection at current OB zone
Invalidation: clean 4H close above the OB high
Targets:
This setup only remains valid as long as price stays below the OB.
What’s your bias here?
MrC

BITCOIN (BTCUSD): Bullish Outlook Explained
There is a high probability that Bitcoin will rise more,
following a formation of a bullish imbalance candle and change of character.
I think that the price will reach at least 88000 level soon.
❤️Please, support my work with like, thank you!❤️
I am part of Trade Nation's Influencer program and receive a monthly fee for using their TradingView charts in my analysis.

Why Reducing Trading Fees Is The Foundation of Risk ManagementMost traders obsess over entries, exits, indicators, and leverage.
Very few obsess over fees .
That’s odd; because unlike your strategy, your psychology, or the market itself, trading fees are guaranteed . They apply to every trade, in every market condition, whether you win or lose.
If risk management is about controlling what you can, trading fees should be the first place to start.
Trading Fees Are a Permanent Tax on Activity
Maker vs taker fees, VIP tiers, and exchange comparisons are well-known topics.
What’s often missed is the cumulative effect:
High-frequency trading multiplies fees rapidly
Lower timeframes amplify churn
Leverage magnifies fee impact on ROI
You can make correct directional calls and still watch profits evaporate simply due to volume-based costs.
Fees don’t care if your trade was “good”.
Why Traders Mentally Ignore Fees
Fees are usually framed as:
“The cost of doing business”
“Small enough not to matter”
“Something I’ll optimize later”
But later rarely comes.
Most traders optimize strategy first and infrastructure las t, even though infrastructure compounds quietly over time.
This is the same reason many traders focus on win rate instead of expectancy.
Referral Codes Aren’t Just Marketing Gimmicks
Here’s an under-discussed mechanic:
Exchanges pay affiliates a share of the trading fees generated by referred users.
Structurally, nothing forces affiliates to keep that commission.
Some setups return a portion of those fees back to the trader as ongoing rebates , effectively lowering trading costs indefinitely ; not as a one-time bonus, but as a permanent modifier.
That makes referral mechanics less about marketing and more about cost structure.
Fee Reduction Is Risk Management, Not Optimization
Reducing fees:
Improves expectancy without changing strategy
Reduces drawdowns during choppy conditions
Increases survivability during high-volume phases
Compounds positively over time
Unlike indicators, it doesn’t introduce noise.
Unlike leverage, it doesn’t increase risk.
It simply removes friction.
Why This Matters More for Active Traders
If you:
Trade frequently
Use algorithmic or semi-automated strategies
Operate on lower timeframes
Manage multiple positions
…then fee drag is one of the largest silent variables in your system.
Ignoring it is equivalent to ignoring slippage or execution quality.
Making Fee Reduction Part of Your Setup
Some traders handle this by:
Reaching higher VIP tiers
Negotiating institutional rates
Using rebate or cashback mechanisms
The key shift is treating fee reduction as infrastructure , not an afterthought.
If you already track risk, exposure, and performance metrics, fees deserve the same level of attention.
Final Thought
You can’t control the market.
You can’t guarantee execution.
But you can control how much friction you accept per trade.
If risk management is about stacking small, permanent edges, then reducing trading fees isn’t optional; it’s foundational.
For those curious about how traders automate fee rebates and make this part of their infrastructure, educational resources exist that break down the mechanics step by step (for example, how Bybit referral rebates work and how they can be applied even after account creation).
CHZ mid-term TAChiliz can be an outperformer on crypto market in the upcoming weeks or months, as of now the volumes on CHZ have accelerated and there's a positive accumulation on weekly time frame as well, it's yet in the early stage of bullish formation but it's something to keep an eye on.
Recently they have announced a partnership with Assetera and that could be a price pusher.

FETCH – Weekly AnalysisFETCH is currently trading at a key HTF support zone that has acted as
support → resistance → support multiple times in the past.
Price is also compressing against a descending trendline, which increases the probability of a volatility expansion.
Key observations:
Strong historical support around current price
Downtrend structure still intact
Potential trendline breakout if buyers step in
No confirmation yet → patience required
Bullish scenario:
Weekly close above the descending trendline
Support holds as higher low
➡️ Possible trend reversal / expansion
Bearish scenario:
❌ Loss of HTF support
➡️ Continuation of the macro downtrend
Always wait for confirmation. What’s your bias here?

Is #KSM Ready to Recover or will Bears Drag it Further Down? Yello Paradisers! Is #KSM setting up for a nasty flush toward new lows, or are we about to witness a fakeout trap before a bigger move? Here's what the # Kusama chart is showing us:
💎#KSMUSDT is currently trading within a clearly defined symmetrical triangle, with the price consistently being rejected from the descending resistance trendline. This structure has broken down, and as of now, the 50EMA is acting as dynamic resistance, reinforcing the bearish bias.
💎The current price of #KSMUSD is $7.75, sitting right below the strong resistance around the $9.32 zone, where the descending trendline aligns with heavy volume on the visible range. As long as price trades below this $9.32 invalidation level, the bearish setup remains valid. A rejection from this level, combined with a 50EMA retest, would further confirm downside continuation.
💎Next key level to watch is the moderate support zone at $6.65, a potential short-term bounce area. However, the real demand lies lower, with major support at $4.95, where we could see aggressive buyers stepping in. This zone also coincides with the previous swing low and would likely trigger liquidation of late long entries, making it a potential reversal zone if the market reaches there.
💎To flip the structure bullish, #KSM needs to break and hold above $9.32. That would invalidate the descending channel and could spark a rapid move toward the next volume cluster above $10.50. Until then, every retest of resistance remains a potential short opportunity for experienced traders.
Trade smart, Paradisers. This setup will reward only the disciplined.
MyCryptoParadise
iFeel the success🌴

ZEC Breakdown in Play — React or Get Left BehindYello, did you see the textbook rejection right at the supply zone... or are you already late to the move?
💎#ZECUSDT just gave a clear signal, and if you're not paying close attention, this could be the start of a much deeper breakdown that catches most traders off guard.
💎After completing a clean breakdown from the rising wedge pattern, the price returned for a precise retest... and failed. The rejection right at the $400–$420 supply zone confirms it. That level was a critical resistance where bulls had their final shot to reclaim momentum — but they failed to flip the structure.
💎Now, unless ZEC rapidly reclaims the wedge breakout level, the path of least resistance is clearly down. While there’s a minor support forming near $328, it’s weak and unlikely to hold under sustained selling pressure.
💎 A drop toward the stronger support zone between $285 and $272 is where we expect a real reaction. Only a decisive reclaim above $437 would invalidate this bearish setup and suggest the bulls are back in control.
Discipline, patience, and strategy always win.
MyCryptoParadise
iFeel the success🌴
