RAY Breakout Alert! NASDAQ:RAY Breakout Alert! 🚨
NASDAQ:RAY is currently testing the red resistance zone 🔴
If price breaks out, the first target will be the green line level 🎯
A confirmed breakout would signal bullish continuation and could push price higher ✅
Cryptotrading

BONK Approaching Key Support – Potential Long Swing Setup
BONK is pulling back and approaching a major support zone, where buyers previously stepped in. With price action slowing down, this could present a low-risk, high-reward swing trade opportunity.
Trade Setup:
🔹 Entry Zone: $0.0000183 – $0.000016
🔹 Take Profit Targets:
🥇 $0.0000226
🥈 $0.000026
🔹 Stop Loss: Close below $0.0000155
#BONK #CryptoTrading #SwingTrade #Altcoins #TechnicalAnalysis

Ethereum Breaks $4K — Eyes on $5K and BeyondEthereum has been the top-performing asset since the April 7 low, breaking through resistance and solidifying its position as the backbone of the stablecoin ecosystem. The trend remains firmly bullish as long as ETH continues its pattern of higher highs and higher lows.
The breakout above the $4,000–$4,200 zone turned former resistance into new support, giving bulls the upper hand. Momentum now shifts toward retesting the former all-time high region at $4,800–$5,000, with upside potential extending into the next cycle.
📈 Technical Highlights:
✅ Short-term resistance: $4,800–$5,000 (former ATH)
✅ Medium-term target: $7,000 baseline
✅ Extended objective: $8,000 possible
🛡️ Key support: $4,000–$4,200 (new floor)
📣 Takeaway:
Ethereum’s structure remains a textbook bullish setup. As long as it holds above $4,000, the path favors further upside. Breakouts above $5,000 could fuel the next leg higher, while current levels may offer strong opportunities for trend-followers and long-term investors.
#Ethereum #ETH #Crypto #Trading #TechnicalAnalysis #EthereumPrice #Bullish #CryptoTrading #Altcoins #Breakout

Can #BAND Bulls Maintain this Momentum or Will Bears Win? Yello, Paradisers! Is #BANDProtocol breakout from the falling wedge legit—or are bulls walking straight into a trap? Let's dig into the latest setup of #BANDUSDT:
💎After trading for weeks inside a falling wedge, #BAND has finally broken out with solid momentum. The breakout above the resistance trendline at around $0.66 has already occurred, and the price is currently hovering near the $0.72 zone. While this move is promising, it’s now all about whether this breakout can hold or fake out.
💎The structure here is clear: #BANDUSD reclaimed the demand zone between $0.60–$0.66 after bouncing off strong support at $0.504. This zone now becomes the most important area to watch in the short term. A retest of this level would offer a high-probability continuation setup, especially since the 50EMA is now acting as dynamic support beneath the price.
💎If bulls can maintain control, we have a clear path toward the moderate resistance at $0.992. That’s where the next wave of selling pressure is expected. But the real prize is the strong resistance zone near $1.180. That’s the level where major distribution could occur, and it's where we’ll be watching closely for profit-taking signs.
💎However, the bullish thesis breaks down completely if the price drops back below the $0.60–$0.66 demand zone. In that case, our invalidation point sits firmly at $0.504. A close below that support would indicate bears are back in control, and we’d shift to a defensive stance, targeting lower re-entry zones.
Stay patient, Paradisers. Let the breakout confirm, and only then do we strike with conviction.
MyCryptoParadise
iFeel the success🌴

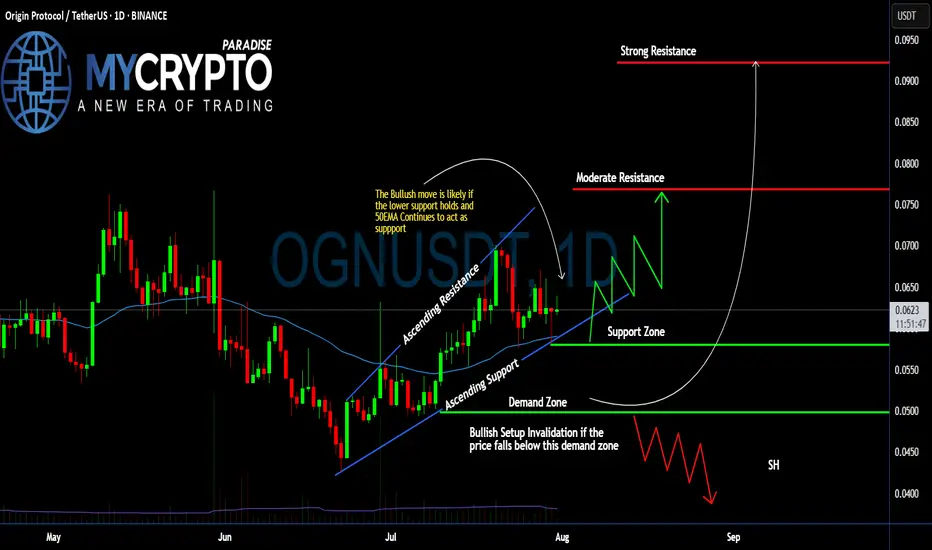
#OGN Ready For a Massive Bullish Move | Must Watch For BullsYello, Paradisers! Is #OriginProtocol about to explode to the upside, or is this a bull trap in disguise waiting to liquidate the impatient? Let’s break down what’s brewing on #OGNUSDT:
💎After forming a clean ascending channel, #OGN has been respecting both the ascending resistance and ascending support levels. Price is currently trading just above the 50 EMA, which has been acting as a dynamic support line since early July. This structure shows clear buyer interest around the $0.058–$0.062 zone—an area that aligns with volume cluster support.
💎The bullish scenario remains valid as long as #OGNUSD holds above the demand zone between $0.0499–$0.0580, and especially if it stays above the 50 EMA. As long as this structure is maintained, we could see a bounce toward the moderate resistance level at $0.076, where previous sellers stepped in and price stalled.
💎If buyers can break through that moderate resistance with strength and rising volume, the next key target lies at $0.092, which aligns with a strong resistance level and high-volume node on the visible range. This area is likely to trigger a reaction, so traders should remain agile.
💎However, if price breaks down below the demand zone, this would invalidate the current bullish setup and open the door for a potential move back toward the $0.045–$0.040 area. A broader shakeout would likely accompany this and could trap many late long entries.
Stay patient, Paradisers. Let the breakout confirm, and only then do we strike with conviction.
MyCryptoParadise
iFeel the success🌴
Bitcoin 4H Chart | Trend is My Best Friend – Smart Money Points Bitcoin 4H Chart | Trend is My Best Friend – Smart Money Points to 119K 🚀🔥”
Market Structure
The price recently rejected the key resistance zone (120,000 – 123,000 USD), which acted as a strong supply area.
After the rejection, BTC experienced a sharp decline forming lower highs and lower lows, indicating short-term bearish momentum.
Multiple Break of Structure (BOS) levels confirm bearish pressure, but the price is now approaching a significant demand zone.
2. Liquidity & Demand Zones
A clear liquidity sweep occurred near the 123,000 zone, where buyers were trapped before the drop.
The Demand Zone and Bullish Order Block (OB) around 112,000 – 114,000 USD serve as the primary area of interest for institutional buying.
This zone overlaps with previous support, strengthening its validity as a high-probability reversal point.
3. Entry & Targets
Entry Zone: Highlighted between 114,000 – 115,500 USD, where demand is expected to absorb sell orders.
First Target: 119,000 USD – this aligns with the chart’s projection and acts as a liquidity grab zone before further moves.
Second Target: If bullish momentum sustains, BTC may retest the 120,000 – 123,000 resistance range.
4. Risk Factors
If BTC breaks below 112,000 USD, the demand zone will be invalidated, potentially opening downside continuation toward 110,000 USD.
Strong rejection at 119,000 USD could also bring sellers back into control.
📌 Conclusion
BTC is currently in a bullish accumulation phase after a heavy correction. Price is sitting at a high-probability demand zone where institutional buying interest is expected. The next impulsive move is projected toward 119,000 USD, with potential continuation toward 120,000 – 123,000 USD, but rejection at resistance remains a risk.

Ethereum Ready to Moon?––Bullish Trade Plan to $5K+
# 🚀 ETHEREUM BULLISH TRADE SETUP 🚀
💎 ETH Long Targeting \$5,090–\$5,800 | Risk-Defined Play 🎯
📊 **TRADE DETAILS**
🎯 Instrument: **ETH**
📈 Direction: **LONG**
💰 Entry Price: **\$4,773.95**
🛑 Stop Loss: **\$4,640.00**
🎯 Take Profit: **\$5,090 → \$5,300 → \$5,800**
📊 Size: **1% Risk**
💪 Confidence: **65%**
⏰ Entry Timing: **Market Open**
⚡ **Rationale:**
✅ Price > Key MAs (20/50/200) → Multi-timeframe bullish structure
✅ RSI/MACD show momentum with room to run
✅ Reward/Risk \~ 2.5:1 toward \$5,090+
⚠️ Risk: Low volume rally + BTC correlation
📌 **Plan:** Scale in near 4,760–4,800 → Target breakout toward \$5,000+
---
\#Ethereum #ETH #Crypto #Altcoins #ETHUSD #CryptoTrading #ETHAnalysis #CryptoSignals #TradingSetup #Breakout

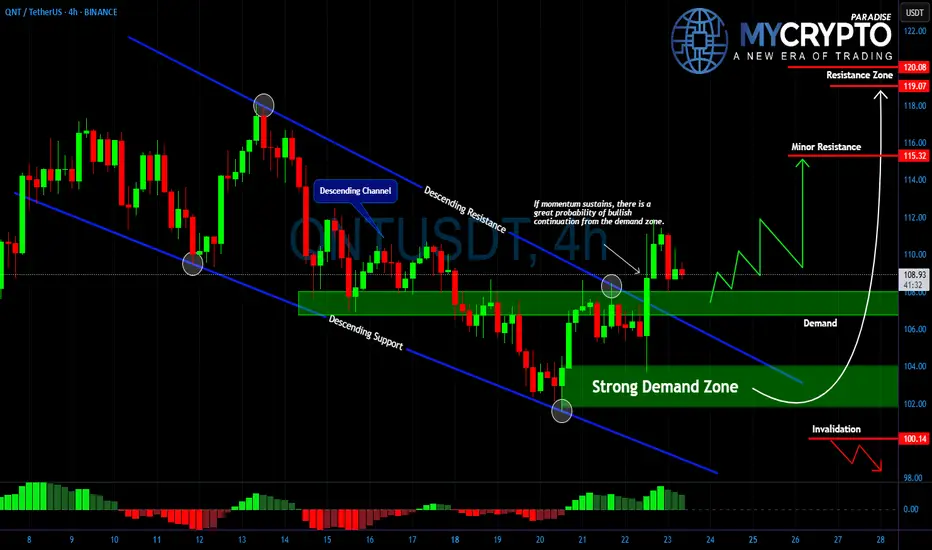
QNT at Demand Zone – Breakout or Breakdown Ahead?Yello traders, #QNTUSDT is now testing a critical demand zone that has repeatedly acted as strong support between 102 and 105. After weeks of moving inside a descending channel, buyers have managed to defend this level, and the market is once again attempting a bullish continuation.
💎Momentum remains fragile, and the immediate test lies ahead at 115, which stands as minor resistance. A clean break and hold above this level could unlock a push toward the stronger resistance zone at 119–120, where sellers are likely to become more aggressive.
💎On the other side, a failure to sustain above the demand zone would quickly shift the structure bearish again. If price breaks below 100, the bullish scenario would be invalidated and deeper downside could follow.
💎This is a decisive moment for #QNT. Patience and discipline are key, as the next move will either confirm a strong breakout or trap late buyers before reversing. Strive for consistency, not quick profits. The market is designed to punish the impatient and reward those who wait for confirmation at key levels.
MyCryptoParadise
iFeel the success🌴
PEPE at the Edge of Disaster or the Start of a Monster Reversal?Yello Paradisers, is PEPE about to break free from its falling wedge or are we staring at another brutal sell-off? After weeks of pressure to the downside, price is now testing the $100–$105 demand zone. This level has been the battleground where bulls and bears repeatedly clash, and the move from here could decide the next big trend.
💎A confirmed breakout above descending resistance would validate the wedge pattern and open the path higher. The first target sits at $1184, with possible continuation into the $1240–$1271 supply zone as momentum builds. This would mark the beginning of a powerful shift in market structure.
💎On the other hand, failure to hold demand and a breakdown below $947 would invalidate the bullish setup completely. In that scenario, selling pressure would accelerate as trapped longs get forced out, driving price into deeper lows.
💎This is a textbook example of why patience is crucial. Jumping in too early means risking a trap, while waiting for confirmation allows you to act only on the highest-probability setups. The market is coiling for a big move, but only those who stay disciplined will come out on the winning side.
Trade smart, Paradisers. Consistency and patience always beat emotions. The winner circle is reserved only for those who know how to wait.
MyCryptoParadise
iFeel the success🌴

BITCOIN (BTCUSD): Bullish Move From Support Confirmed
There is a high chance that BITCOIN will bounce
from a key daily support cluster.
An inverted head and shoulders pattern on an hourly
time frame provides a strong bullish confirmation.
Goal - 113840
❤️Please, support my work with like, thank you!❤️

BTC Short Trade Setup – Bearish Momentum
🎯 **BTC Short Trade Setup – Bearish Momentum**
📌 **Instrument:** BTC
📉 **Direction:** SHORT
💰 **Entry Price:** \$115,200
🛑 **Stop Loss:** \$116,500
🏹 **Take Profit:** \$111,500
📏 **Position Size:** \$5M (1% of \$500M account)
💪 **Confidence:** 65%
⏰ **Timing:** Enter at market open
⚠️ **Key Risks:**
* Market volatility can trigger rapid moves.
* Breakout above \$116,500 invalidates setup.
* Macro correlations may amplify risk.
✅ **Rationale:**
* Lower highs & lower lows = bearish momentum
* Price below key MAs, weakening bullish conviction
* Technical indicators support short entry
🔥 **TradingView / Social Tags:**
\#Bitcoin #BTCShort #CryptoTrading #CryptoAnalysis #FuturesTrading #TechnicalAnalysis #TradingSignals #RiskManagement #MarketAnalysis #CryptoAlerts #HighConvictionTrade #BearishSetup #PriceAction #TradingStrategy #CryptoMarket

ZRX/USD Main trend. Channel. Fractal.Logarithm. Time frame 1 month. Main trend. Idea for long-term trend orientation on a large timeframe.
0x is an infrastructure protocol that allows users to easily trade ERC20 tokens and other assets in the Ethereum blockchain without relying on centralized intermediaries such as traditional cryptocurrency exchanges.
The price has fallen by -93% from the high of pumping. Pump/dump channel. Possible fractal recurrence based on the logic of the previous secondary trend. The potential is quite significant.
Suitable for position trading. Rational to work from the average buy/sell price. The price is approaching the zone of previous lows, but the slippage can be by a significant percentage at the moment of “fear peak”.
Trading volume. Holder Addresses.
Pay attention to the minimum trading volume of the last year (this whole downtrend) compared to the past cycles. To understand why it is so, trace the main mass of large and medium addresses of this coin. Activity, time of creation.
This is what it looks like on a line chart if the “market noise” is removed.

Is #VET Ready for Massive Bullish Rebound or Not? Watch CloselyYello, Paradisers! Is #VET setting up for a breakout play, or are we about to witness another classic bull trap unfold? Let’s dig into what the chart is telling us on #VeChain:
💎After climbing steadily inside an ascending channel, #VETUSDT is now approaching a major resistance zone around $0.02–$0.02. A confirmed breakout above this area would significantly boost the probability of a bullish continuation, especially with the 50EMA providing dynamic support from below.
💎The immediate support zone to watch is between $0.020–$0.022, which aligns with the channel’s lower boundary and a visible demand zone. This is the key level where bulls are expected to step in if #VETUSD pulls back.
💎If buyers defend this zone successfully and price breaks above the current resistance, the next upside target lies at the moderate resistance of $0.031. Beyond that, the strong resistance level at $0.038 will be the real decision point for any sustained move higher.
💎On the flip side, a breakdown below $0.020 would send it to the lower demand zone at $0.016. It would invalidate the bullish setup and open the door for a deeper selloff, potentially forming a new swing low as shown on the chart.
Stay patient, Paradisers. Let the breakout confirm, and only then do we strike with conviction.
MyCryptoParadise
iFeel the success🌴

ADA/USDT : Heavy Pullback Expected Before Major Price Surge📊 Pattern Overview
Cardano is shaping a classic contracting triangle on the daily timeframe, with all legs unfolding as 3-wave zigzags, fully compliant with NeoWave rules.
• Wave A: $1.33 → $0.51 (zigzag decline)
• Wave B: $0.51 → $1.18 (zigzag rally, ~82% retrace of A)
• Wave C: $1.18 → $0.52 (zigzag decline, ~99% retrace of B)
• Wave D: $0.52 → $0.92 (zigzag rally, ~61% retrace of C, currently in progress)
• Wave E: Expected $0.92 → $0.51 (projected zigzag, targeting channel support)
This setup aligns with a contracting triangle, with converging trendlines projecting an apex around November 2025.
⸻
📉 Near-Term Expectation
• Wave E is anticipated to pull ADA back toward $0.51 (long-term channel support).
• This would complete the triangle and set the stage for a powerful bullish thrust.
⸻
🚀 Post-Triangle Outlook
• A bullish breakout from the triangle could target:
• $1.5 (TP1)
• $1.8 (TP2)
• This aligns with NeoWave projections of a 75–125% thrust of the channel width.
• Break of $0.92 (BOS) will be the confirmation trigger for the rally.
⸻
🎯 Trading Plan
• Entry: Wait for pullback to ~$0.51 (Wave E completion) and BOS confirmation.
• Targets: $1.5 – $1.8
• Stop Loss: Below $0.45
• Risk Management: 1–2% capital per trade, trail stops above $1.0 once thrust begins.
⸻
⚠️ Key Levels
• Support: $0.51 (channel bottom)
• Resistance: $1.0, then $1.5–$1.8
• Invalidation: Break below $0.45
⸻
✅ Summary: Patience is key. A final pullback toward $0.51 could be the last shakeout before a major bullish breakout.

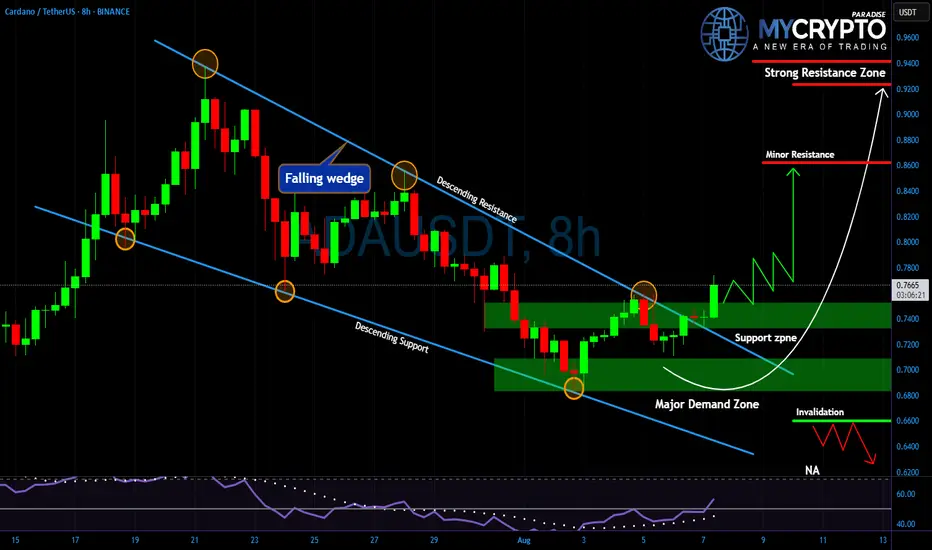
ADA Just Broke Out... But Will It Hold or Collapse From Here?Yello Paradisers, are you ready for what Cardano is about to do next? After weeks of being trapped in a falling wedge, #ADA has finally broken out and this move could either be the start of something big or just another fakeout to trap late buyers.
💎Price has now closed above the descending resistance, confirming the breakout of the falling wedge structure. The 0.7300–0.7450 zone is currently acting as the first area of support. This level needs to hold in order to maintain bullish momentum, or the entire setup could be invalidated. Below that, the major demand zone between 0.6700 and 0.7100 remains critical if #Cardano slips into that range, we’ll be watching for either a bounce or signs of a deeper breakdown.
💎On the upside, the first short-term target sits at 0.8600 where minor resistance is expected, but the real battle will take place between 0.9300 and 0.9500 a strong resistance zone where many traders will be looking to take profits or re-enter shorts. Momentum indicators are showing early strength, with RSI recovering and confirming renewed buyer interest.
💎If bulls can maintain control above the breakout zone, #ADA could enter a healthy consolidation phase before launching into the next leg up. However, a drop below 0.6600 would completely invalidate the current structure and shift the bias back to the downside so risk management remains essential here.
🎖Strive for consistency, not quick profits. Treat the market as a businessman, not as a gambler.
MyCryptoParadise
iFeel the success🌴
Is #XTZ Ready For a Major Breakout or Another Trap Ahead?Yello Paradisers! Are you prepared for what might be one of the sneakiest reversals brewing quietly on #XTZUSDT? Let's see the current setup of #Tezos:
💎#XTZ is trying to break out of a descending broadening wedge formation, a setup that typically signals the end of a corrective structure and the potential beginning of a major impulsive move. We’re likely witnessing the very first wave of this new impulse, and what happens next will depend entirely on how the price reacts to the overhead dynamic resistance.
💎The 1st impulsive wave appears to be nearing completion, and based on structure and current momentum, a minor pullback is both expected and healthy. This retracement will likely serve as a reset before the next leg higher begins, offering a potential entry for those who missed the breakout. However, we do not expect this correction to break below the origin of the first wave — doing so would undermine the integrity of the new trend.
💎Currently, the #XTZUSD is facing strong resistance from the EMA, which it must convincingly break and reclaim. This EMA level has repeatedly acted as a lid on price action, and until it’s cleared, any upside move remains tentative. However, if buyers step in with real volume, we could see a rapid acceleration toward the mid-term resistance at $0.916. That level has historically marked a shift in market control. And beyond it, the next major resistance lies at $1.134, a key supply zone that could trigger heavy distribution.
💎On the downside, the structure remains clean. The $0.491 – $0.516 zone is now our major support, and it must hold. If the price falls below this support and closes with weakness, it will invalidate the current bullish thesis and likely lead to a deeper correction.
Play it safe, respect the structure, and let the market come to you!
MyCryptoParadise
iFeel the success🌴

#ONDO Ready to Make a Bullish Move | Must Watch For BullsYello, Paradisers! Is #ONDO getting ready for a powerful breakout, or are we about to witness yet another bull trap? Let’s break down the real picture on #ONDOUSDT:
💎After steadily climbing inside an ascending wedge, #ONDOUSD is now pressing against a key resistance area around $1.05–$1.07. A breakout above this zone would significantly boost the probability of a bullish continuation, especially with the 50EMA providing underlying support.
💎The immediate support zone to watch is between $0.84–$0.85, aligning with the lower boundary of the channel and overlapping with a visible demand area. This is where we expect buyers to defend the trend if any pullback occurs.
💎If bulls manage to hold this zone and break through the current resistance, our next upside target is the moderate resistance level at $1.34. From there, the strong resistance sits at $1.72, which will be the key decision point for any further upside momentum.
💎On the flip side, a breakdown below $0.72, our bullish invalidation level, would nullify this setup entirely and open the door for a deeper drop, where sellers are likely to step in aggressively.
Stay patient, Paradisers. Let the breakout confirm, and only then do we strike with conviction.
MyCryptoParadise
iFeel the success🌴

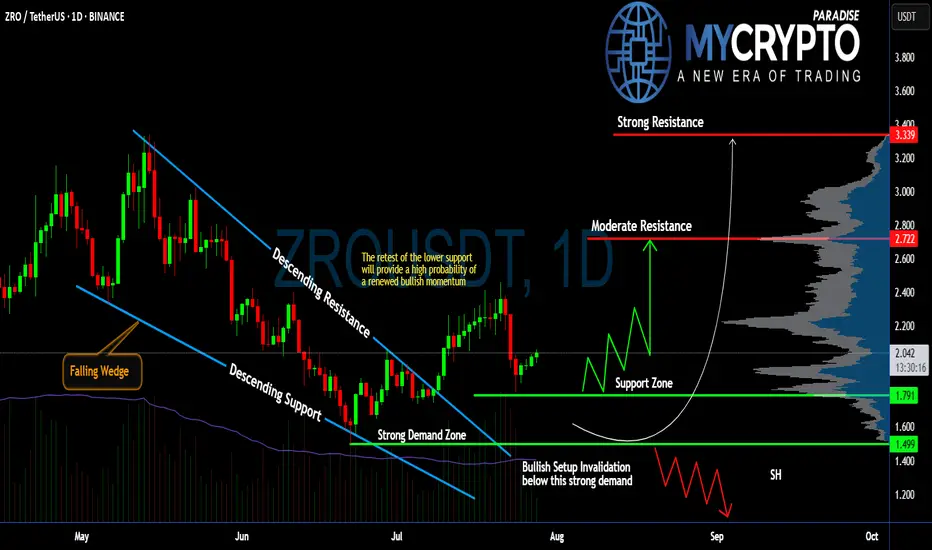
Will #ZRO Continue to Climb or Not? Must Watch For BullsYello, Paradisers! Are we witnessing the beginning of a powerful bullish reversal on #ZROUSDT, or is this just a fakeout setup? Let’s dissect this setup of #LayerZero:
💎After weeks of consistent bleeding, #ZRO has printed a classic falling wedge pattern, often a precursor to bullish reversals. This wedge has now been broken to the upside, with price currently trading around $2.037, suggesting renewed buyer interest following the breakout from descending resistance.
💎What’s crucial here is the retest of the wedge’s descending support, which aligns perfectly with a strong demand zone between $1.499 and $1.791. As long as #ZROUSD respects this zone, the probability of a bullish continuation remains high. This zone also serves as a clear invalidator for the setup—if price closes below $1.499, the bullish thesis will be off the table.
💎From here, if bulls can maintain control, we’re eyeing a potential move toward the moderate resistance at $2.722. That’s the first real hurdle where profit-taking or short interest could spike. A clean break above that level would open the path to the strong resistance around $3.339, where a heavy supply zone is likely to cap further upside.
💎Until then, we expect a series of zigzag corrections above the support zone before any sustained push higher. However, be cautious, losing the $1.499 support turns the structure bearish and could drag the price toward the $1.20 region, or lower.
Stay patient, Paradisers. Let the breakout confirm, and only then do we strike with conviction.
MyCryptoParadise
iFeel the success🌴
ETHEREUM (ETHUSD): Road to ATH
Breakout of a key weekly resistance cluster on Ethereum clearly
indicates a dominance of the buyers.
I do believe that the market will reach the All-Time High soon.
Get ready for a growth to 4700 after a pullback.
❤️Please, support my work with like, thank you!❤️

ETH Eyeing $4,300 Breakout — Long-Term Target $7K+After dominating the market since the April 9 low, ETH is holding firm, even as it faces minor short-term headwinds. This consolidation above key support levels is building a strong base for the next upward move.
Bulls are focused on the higher-low formation, which keeps the trend intact and momentum in their favor. As long as ETH holds above $3,100–$3,200, the bullish structure remains unbroken.
📈 Technical Highlights:
✅ Short-term resistance: $4,000–$4,300 (break and run)
✅ Medium-term target: $4,800–$5,000
✅ Long-term potential: $7,000+ this cycle
🛡️ Key support: $3,100–$3,200
📣 Takeaway:
Ethereum’s chart remains a textbook bullish setup. A breakout over $4,300 could trigger another powerful rally, while current pullbacks may offer attractive opportunities for both swing traders and long-term investors.
#Ethereum #ETHUSD #Crypto #Trading #TechnicalAnalysis #CryptoTrading #EthereumPrice #Altcoins #Bullish #Breakout

BTCUSDT 111k first then UPHi fellow traders,
Here’s my current BTCUSDT view on the 4H chart, based on Elliott Wave principles.
After a corrective structure, we’ve seen a strong bounce, and price is now approaching a key area of interest. I’ve marked the zones I’m watching for potential buys and sells:
🟨 Lower box: Potential buy zone if price pulls back with a corrective structure.
🟨 Upper box: Area of interest for taking partials or looking for potential short setups, depending on how price reacts.
If momentum continues, we could see BTC pushing into the 125K region, which aligns with fib extensions from previous swings.
As always, I’m waiting for confirmation before making any entries.
Let me know what you see on your end!

BTCUSD – Bearish Retracement Towards Key Liquidity Zone📊 BTCUSD – Bearish Retracement Towards Key Liquidity Zone
BTCUSD is currently trading near 116,425, showing signs of a potential bearish retracement after testing the previous resistance zone around 117,000–119,000. The chart structure highlights multiple Break of Structure (BOS) points, confirming shifts in market sentiment.
Technical Breakdown
Previous Resistance Rejection
Price failed to hold above the 117,000 mark, indicating strong selling pressure from the prior supply zone.
The rejection aligns with a liquidity grab above the recent highs, suggesting smart money distribution.
Liquidity & Fair Value Gaps
There’s a visible Liquidity/Fair Value Gap from the late July rally, which may now act as a magnet for price.
The market tends to fill these inefficiencies before deciding the next major trend move.
Target & Support Zone
The next key support and liquidity pool rests between 113,500 – 114,000, highlighted as the target zone.
This area has confluence with previous accumulation phases, making it a probable point for a bullish reaction if tested.
Volume Profile Context
Volume nodes indicate heavier trading activity below current levels, suggesting that a drop towards 114,000 could be met with increased buyer interest.
Market Outlook
Primary Bias: Short-term bearish retracement.
Immediate Target: 114,000 liquidity zone.
Invalidation: A daily close above 117,500 may shift sentiment back to bullish, opening the path toward 119,000–121,000.
Trading Insight:
Aggressive traders may look for short setups below 116,500, targeting 114,000. Conservative traders may wait for price to tap into the support/target zone for potential long opportunities with tight risk management.

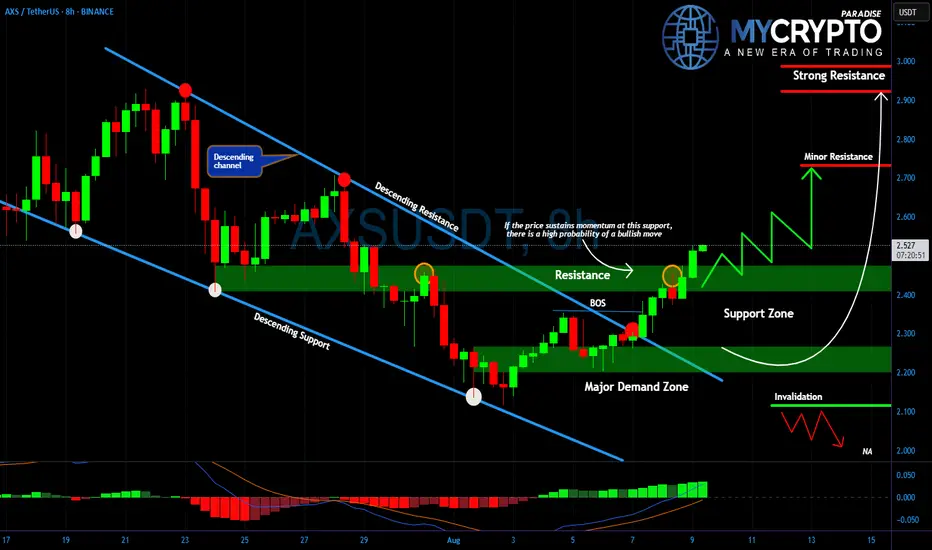
AXS :Breakout to Glory or Just Another Painful Bull Trap Ahead?Yello could this #AXSUSDT breakout be the start of something big, or is it the perfect setup to liquidate the impatient before the real move? After weeks of being trapped inside a grinding descending channel, price has finally punched through resistance… but the market is never that generous without a catch.
💎For nearly a month, #AXS kept bouncing between descending resistance and support, with every bullish attempt slapped back down. That pattern ended when price broke cleanly above $2.40, flipping a stubborn resistance level into fresh support. This is a textbook Break of Structure (BOS) and a sign that buyers are finally stepping in with force.
💎The $2.10 to $2.20 demand zone remains the ultimate foundation for bulls. As long as it holds, market sentiment stays in their favor. The newly reclaimed $2.40 to $2.45 area now acts as immediate support, and losing it could invite a quick reversal back into the previous bearish structure. On the upside, $2.70 stands as the first key level where sellers might reappear, while a decisive breakout above $2.90 could trigger a rapid rally. If price closes below $2.10, the bullish case collapses entirely and the downtrend resumes.
💎The MACD has just printed a bullish cross with rising histogram bars, reinforcing the breakout momentum. Still, experienced traders know that such breakouts often retrace sharply before continuing higher, shaking out weak hands along the way.
🎖Strive for consistency, not quick profits. Treat the market as a businessman, not as a gambler.
MyCryptoParadise
iFeel the success🌴