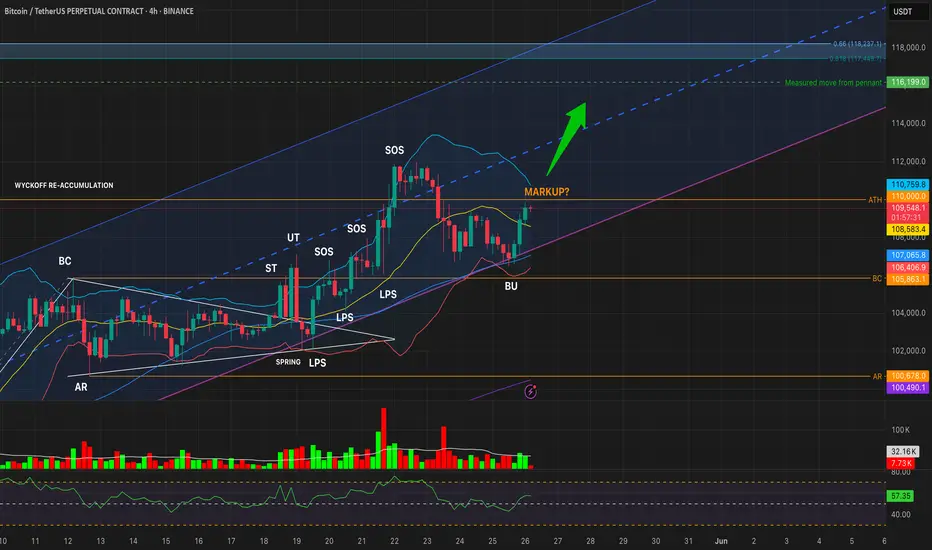
BTCUSDT – Reaccumulation Breakout or Bearish S/R Flip?Timeframes: 1W • 1D • 4H
Structure: Wyckoff Reaccumulation nearing Phase E — but ATH is acting as resistance
🔹 WEEKLY OUTLOOK: Macro Structure Points to Markup
Last weekly candle closed above the reaccumulation Buying Climax (BC), showing bullish intent
Weekly upper Bollinger Band is rising toward 113k
RSI at 67, strong but not overbought
Structure suggests we’re entering Wyckoff Phase E
Weekly Targets:
🟢 TP1: 113,049 (Upper BB)
🟢 TP2: 116,199 (measured move)
🟢 TP3: 118,237 (Fib 0.66 extension)
🔹 DAILY OUTLOOK: Still Holding Above Reaccumulation Range
Multiple daily closes above the BU (backup) zone, but all below 110k ATH
RSI is strong (~66), and price is tracking near the upper BB, but volume is not convincing
Until a daily close above 110,000, breakout remains unconfirmed
🔹 4H OUTLOOK: Structure Valid, Momentum Rising
BU zone held; price made two lower lows followed by a higher high
RSI has reclaimed 57+, and volume is picking up modestly
4H structure looks like an early Phase E breakout attempt, but...
⚠️ Caution: Is This a Bearish S/R Flip?
While the broader Wyckoff structure suggests a transition into markup, we must also consider the bearish scenario:
BTC may be failing a support/resistance flip at 110k
All timeframes have rejected at or below 110k, despite multiple attempts
If we see a lower high under 109k + 1D close below 105,863 with red volume and RSI < 45 → this becomes a confirmed bull trap
📊 TL;DR:
BTC is structurally bullish — but we are at the final test zone.
🔓 Breakout confirmed: Daily close above 110k
🔒 Failure confirmed: Close below 105,863 + red volume + RSI breakdown
Stay nimble. This is either the last shakeout before markup… or the top of the range before reversal.
#Bitcoin #BTCUSDT #Wyckoff #CryptoTrading #TechnicalAnalysis #Reaccumulation #Breakout #SupportResistance
Cryptotrading
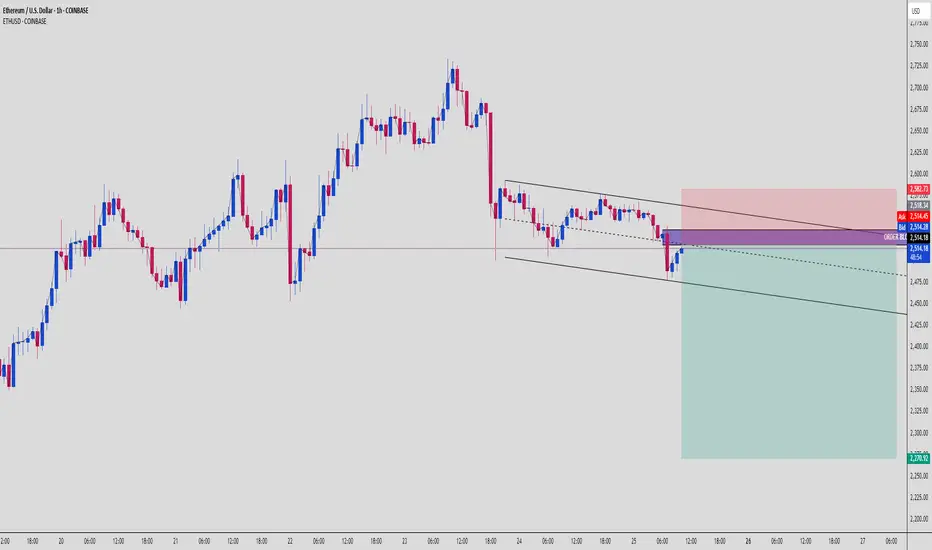
ETH Trap & Drop Setup – OB Rejection + Bearish Channel📉 Ethereum (ETHUSD) | 1H SMC Breakdown | Bearish Setup Explained
Another clean setup for the SMC gang. ETH just gave us a beautiful opportunity, respecting market structure, reacting to Order Block supply, and aiming to clean up sell-side liquidity. Let’s dive in 👇
🧱 1. Structure: Bearish Channel Formation
ETH has been moving in a tight bearish channel, producing:
Lower highs (confirmed supply zones)
Lower lows (liquidity grabs + structure breaks)
This shows consistent bearish pressure.
🧊 2. Premium OB Tap + Rejection Zone
Price just retraced into a Bearish Order Block sitting in the Premium zone, right around $2,514.
💥 OB zone is aligned with:
Upper channel resistance
Supply rejection
Clean inefficiency fill
Price wicked inside and immediately rejected = Smart Money active.
🧠 3. Retail Psychology Trap
Retail likely:
Longing support bounce
Placing stops under structure lows
Not respecting OB/imbalance narrative
Meanwhile, Smart Money:
Enters short from OB
Targets imbalanced zones
Eyes the $2,270 weak low
🎯 4. Liquidity Pool & Final Target
🔻 Target Zone: $2,270
This level is:
A weak low (high chance of being swept)
Sits at lower channel boundary
Acts as a liquidity magnet
Expect price to accelerate as it approaches this zone.
⚔️ 5. Trade Plan (Short Setup)
📍 Entry: $2,514 OB Zone
🔐 Stop Loss: Above $2,582 (structure break + OB invalidation)
🎯 Targets:
TP1: $2,460
TP2: $2,400
TP3: $2,270
⚖️ RRR: ~1:4+ – high precision trade
🧠 Key Concepts in Play:
Order Block Rejection
Premium Pricing Sell Setup
Bearish Channel Continuation
Liquidity Sweep Targeting
📌 Chart Summary:
"Don’t chase candles – follow the narrative. OB tells the story, liquidity gives the profit."
📚 Study the OB zone reaction. These setups repeat every week across assets if you know what to look for.
💬 Drop “ETH OB SNIPER” in the comments if this is your kind of entry.
📈 Tag a trader who needs to stop fading Smart Money moves!
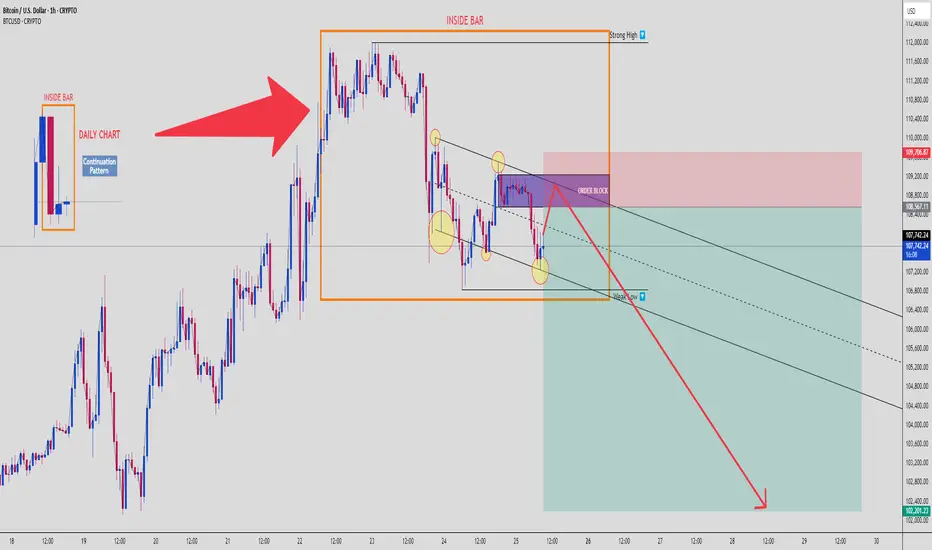
BTCUSD: Inside Bar Trap + Order Block Rejection Targeting $102K📉 Bitcoin | SMC Breakdown | 1H Chart
Welcome to a clean Smart Money setup, where retail gets baited and Smart Money gets paid. Let’s break down what’s happening on BTCUSD, 1H chart, using multi-timeframe confluence and Smart Money Concepts. 👇
🗓️ 1. Daily Chart Confluence
We start with a Daily Inside Bar Pattern – a classic continuation setup, often used by institutions to trap traders before expansion. BTC ranged tightly, then broke to the upside to grab liquidity, not start a rally.
🟥 Daily High = Liquidity Pool
🟧 Inside Bar Range = Manipulation Zone
This is the trap zone.
🧱 2. Order Block Rejection (1H)
Price tapped a clearly defined Bearish Order Block in premium pricing, just above the mid-range of the Inside Bar.
💥 Reaction confirmed:
Rejection candles from OB
Structure respecting downside bias
Fakeout = Fuel for downside expansion
📉 3. Bearish Continuation Structure
Price is moving within a descending channel, respecting internal supply zones. Each lower high is met with supply pressure, and internal lows are swept before moving lower.
You’re looking at a high-probability continuation move toward the weak low marked near $102,200.
🧊 4. Weak Low as Final Target
This level is a classic liquidity magnet – weak lows = retail stop clusters = Smart Money target.
We expect BTC to:
Tap OB
Reject with minor pullback
Break structure
Fill imbalance and target weak low
It’s a beautiful setup if managed correctly.
🧠 5. Psychology & Trap Narrative
Retail is:
Buying the breakout of Inside Bar
Placing stops under weak lows
Ignoring the OB rejection
Smart Money is:
Selling from OB
Riding the imbalance
Grabbing liquidity from below
This is where you flip from reaction-based trading to narrative-based execution.
🧮 6. Trade Setup Summary
📍 Entry Zone: $108,500–$109,700 (OB zone)
🔐 Stop Loss: Above $109,800 (invalidate OB)
🎯 Target:
TP1: $106,500
TP2: $104,000
TP3: $102,200 (Sell-side Liquidity Sweep)
⚖️ RRR: Approx. 1:4 to 1:5 depending on entry
⚠️ Risk Management:
Do not overleverage.
This setup rewards patience and narrative confirmation, not emotional entries. Wait for OB confirmation and rejection.
📈 If this hits, it’s a chart you screenshot and study again and again.
💬 Comment “INSIDE BAR MASTERCLASS” if you’re watching this play out live. Share with your trading circle.
Is BTC Poised for a Pullback or Continuation? Key Levels on 3D We’ve got a strong resistance level formed by the double top from Dec 14, 2024, and Jan 19, 2025.
✅ Price is above the 200MA, 50MA, and Bollinger Bands.
✅ MLR > SMA confirms the bullish momentum.
I don’t see any immediate reasons to panic. A pullback to the Bollinger Bands or even the 50MA could be in play, but the price action will depend heavily on macro conditions. 🌎
⚠️ If you're highly leveraged, consider risk management. Keep an eye on price action and stay cautious.
📈 Keep close, follow me for more insights, and thank you for reading! Stay safe. 🙏

ETH Update: Pressed Between Key Levels on the Daily
ETH is currently pressed between the 200MA and the 50% Fibonacci level—two major areas of interest.
On May 14th, we saw a clear rejection at the 200MA, followed by solid support at the 50% Fib on May 18th-19th. 📉
MLR < SMA < BB Center isn't ideal, so we need to play it safe and let price do its thing. If we close above the BB Center and macro conditions support the move, we could see upside. 🌱
⚠️ Keep safe, follow for unbiased TA, and always manage risk! 📊

OTHERS 200MA – Next Attempt: If and When?
On the Others daily chart, there’s a formed inverse head and shoulders. The base of the formation acted as support during the last drop after rejection from the 200MA.
Now, price is attempting to push through the BB center, with SMA and MLR helping from underneath. Additionally, there’s a clear ascending trendline that continues to act as dynamic support.
Only price action will confirm the next move toward the 200MA.
Posts come from time to time—interactions help with visibility.
Manage risk—it’s the only constant

PENGU 12H – System Entry Triggered
PENGU just gave a system entry on the 12H time frame.
📌 The black line represents entry points from the 3D and 1W time frames. It has acted as a key level in the past and has now been flipped into support again.
📈 Price is currently pushing into the pink box, which may act as short-term resistance. Keep an eye on how long it takes to break through this zone—if it lingers too long, we might see a temporary rejection.
🟢 OBV is rising
🟢 MACD is turning bullish
🟢 Fundamentals look very strong
I believe PENGU still has upside potential from here.
✅ Stick to the system—no guessing tops. Let price action guide the decisions.

LINK 3D – Watching the 50MA Reclaim
After a clear rejection at the 200MA on April 25, LINK is now trading above the 200MA, but has faced rejection at the 50MA.
The green zone represents a key support area that started forming on Feb 3.
✅ MLR > SMA > BB Center, confirming that the bullish structure remains intact.
🔍 Note how the BB center and SMA are now aligned. The last time this happened (see orange zone) was also after a drop, and the recovery only started after price reclaimed the 50MA.(see green circle)
Unless macro headwinds (e.g. tariff war escalation) drag the market down, the key level to watch is the 50MA. A close above it could mark the next leg up. 📈
Thanks for reading!
If you found this useful, give it a like or drop a comment.
Manage risk, take profits.

PEPE Daily – Testing Key Fib Support
After getting rejected at the 0.5 Fibonacci level on May 14, PEPE is now retesting it as support.
On the way down, price found support at the 200MA, even after briefly closing below it on the daily chart.
You could argue MLR > SMA, but both are still above the BB center and the 200MA, which maintains the overall bullish structure.
⚠️ Watch for a daily close below the 0.5 Fib—that would weaken the structure and could lead to further downside.
Look closer at smaller time frames.
Thanks for reading—if you found this engaging, react or comment.
Always manage risk and take profits. 📊

BTCUSD Set to Reclaim This Weak High,Watch This Smart Money Zone📊 BTCUSD 30-Min Smart Money Concept Setup
Let’s dissect this high-probability Smart Money setup on BTCUSD, which just tapped into a premium-to-discount range retracement and looks ready to reverse from demand.
🔻 1. Market Context
We saw a strong impulsive move up earlier today, followed by a corrective move pulling back into the 61.8–79% fib zone, lining up with internal liquidity and support zones.
Price just respected that 61.8% level with multiple bullish rejection wicks, indicating a potential bounce.
🧱 2. Key Zones Identified
Strong Low: 102,757.05 — protected for now
Entry Zone: 103,646 – 103,758
Weak High Target: 104,800+
Final TP: 105,788.51 (aligned with -27% fib extension)
The confluence of internal trendline support and fib levels supports the bullish narrative.
📈 3. Trade Setup + RRR
✅ Entry: Around 103,750
❌ Stop Loss: Below 102,800 (beneath strong low)
🎯 Take Profit: 105,780
📊 RRR: ~4:1+
This setup offers a clean low-risk, high-reward opportunity with minimal drawdown.
🔥 4. Why This Is Smart Money Approved
✅ Deep retracement into discount zone
✅ Strong bullish structure + weak high liquidity above
✅ Trendline support confluence
✅ Smart Money targeting liquidity
✅ Higher timeframe bullish bias still intact
💬 Type “⚡️BTC Weak High Raid Loading” if you’re riding this wave too!
🚀 Follow @ChartNinjas88 for more precision Smart Money plays like this.

ENAUSD: Strong bullish wave startingEthena is neutral on its 1D technical outlook (RSI = 52.271, MACD = 0.053, ADX = 32.166) as it's trading between the 1D MA200 and 1D MA50. The last time a rebound was supported by the 1D MA50, was in October 2024 and was the start of a Channel Up to the top of the Rectangle. Go long and TP = 1.3000.
## If you like our free content follow our profile to get more daily ideas. ##
## Comments and likes are greatly appreciated. ##

BTCUSD: 1D Golden Cross signals more upside to 155k.Bitcoin dropped below the overbought barrier on its 1D technical outlook (RSI = 69.592, MACD = 4447.700, ADX = 32.855) following today's Trump led pullback. On the long term though, this is nothing but a technical reaction to fundamentals and not enough to invalidate the bullish trend as not only did we make new ATH this week but also just completed a 1D Golden Cross. This is the first such pattern since October 27th 2024, which validated the previous bullish wave that peaked on the 2.0 Fibonacci extension. According to that, Bitcoin should extend the current uptrend with TP = 155,000.
## If you like our free content follow our profile to get more daily ideas. ##
## Comments and likes are greatly appreciated. ##

BTCUSD (Bitcoin) Setting Up for a Trap and Crash📊 BTCUSD Smart Money Breakdown – May 23, 2025
This is a textbook liquidity trap setup — and the roadmap is crystal clear. The market already induced buyers at the top, is now tapping into an Order Block (OB) + 79% zone, and is preparing to nuke.
🔍 Market Narrative:
Strong high established – retail likely placing longs above that.
Clean retracement into Order Block zone (110,322 – 110,850) – where Smart Money is selling into demand.
PA is projected to fake a bullish breakout, reverse, and go for a deeper Fair Value Gap fill near 107,786, eventually targeting the Sell-Side Liquidity zone at 106,188.31.
📍 Key Confluences:
✅ OB + 79% Fibonacci = strong SMC reversal zone
✅ Clear FVG waiting to be filled = imbalance = magnet
✅ Weak low at 107,786.83 = perfect inducement for Smart Money run
✅ Final stop = Sell Side Liquidity sweep below 106,200
📉 Price Path Forecast:
Reject Order Block + Premium zone (110,496 – 110,850)
Retrace → FVG fill (between 108,900 – 107,800 zone)
Minor pullback or fake rally
Final move: liquidity raid under 106,188
Smart Money buys low again, setting up next bullish leg (later)
🎯 Trade Plan (Short Idea):
Entry Zone: Between 110,322 – 110,850 (OB)
SL: Above 111,000 (above inducement)
TP1: 107,786 (Weak Low)
TP2: 106,188 (Sell-Side Liquidity Pool)
RRR: Approx. 1:4 to 1:5 🔥
🧠 Institutional Logic:
Retail sees sideways structure = buys top resistance
SM sees that = sells into premium zone
This is accumulation → manipulation → distribution at its finest.
💬 Think BTC’s about to drop hard? Type “DUMP” or 🔻 in the comments! Let’s see who’s trading with the big boys.

BITCOIN 5 lines and 3 indicators to watch now we in new ground
I will be presenting a number of charts here and each has a different story to tell right now.
The 5 lines are All valid trend lines.
The Vertical lines are January year markers
The white line at the bottom is th e long term support line from 2013
The Dotted line is a threshold line
The Blue Arc is a line that has rejected EVERY ATH since 2013
The orange line is a marker that, once crossed has Always led to a New cycle ATH
The upper dashed line is the line of rejection of all ATH since 2017
The Weekly Bitcoin PA chart
Here we can clearly see how that Blue Arc has rejected PA previously. We can see how PA has reached a point of intersection and once it crosses that blue Arc, there is a line of rejection just above.
This Blue line needs to be crossed and held as support.
The Daily version of this chart shows ua how we have just crossed that blue Arc.
It also shows us how FRAGILE this is right now. PA is currently testing that Blue line as support
This needs to Hold. If we manage to hold this line and bounce, Stiff resistance is found around 120K
The following charts are showing the following indicators
The 3 indicators used are
RSI - Relative Strength Index. used to measure the speed and change of price movements
TSI - True Strength Index, used to indicate trend direction and overbought/oversold conditions.
ADX - The Average Directional Index (ADX) is used to measure the strength of a trend, not its direction
The 4 hour chart - short term expectations for the weekend
Bitcoin PA the Yellow line at the Top, the indicators are in the order listed above,
First thing to see here is how BTC PA is retesting that Blue Arc - this really needs to hold
RSI (blue) - OVER BOUGHT, It has fallen below its own MA ( average) and could easily drop further today. Looking back along this, we can see how the 4 hour RSI likes to range along the Neutral line, so we may see it drop back to that level today, tomorrow
TSI is also OVER BOUGHT. We can see when TSI is up here, PA ranges while it cools off. But there is room for one little push here if required
ADX ( yellow ) is high showing trend could be getting near exhausted, The orange line is the DI+. This shows positive prince direction, the Red one is DI- and shows that negative price direction is climbing slightly.
In the short term, we need to see PA hold above the Blue line but the likelihood is to possibly back below. There is support below.
The WEEKLY shows us that PA has the ability to continue for a while longer but we are getting near a point where PA needs to recover
Here we can see how the RSI and TSI are both up high, on the edge of OVER BOUGHT but with the ability to rise further.
What is VERY important to take note of here is that ADX.
It is Low, this is indicating that the weekly Trend has lost strength now. It could continue lower.
Remember, ADX DOES NOT SHOW TREND DIRECTION, JUST STRENGTH
So, the thing to see here is that we are in an area where we could see a New Trend begin. This trend could be either Bullish or bearish
On a weekly chart, this change can take a long time to appear in PA
And for the Longer Term, The Monthly Chart gives us hope for a fuhrer push higher for the rest of the year but one little warning bell
WE See Both RSI and TSI up high again, where they have been since 2024. But neither of them are up in OVER BOUGHT as much as they have been in previous cucle Tops.... So we can assume room to move higher.
But what does ring a bell is that ADX again. It is once again, in a place of Change and on this chart, showing that the current trend can start becoming weaker. However, DI+ has plenty of room to move higher
So, in conclusion, we see that BITCOIN has the ability to continue higher but in the short term, we may see a pause and possinle Volatility
Trends are about to change, This could take Weeks and PA can continue higher while a trend weakens.
For me. we are in the last few months of this cycle and at a point of Decision.
PA MUST get over that Blue Arc that has rejected Every ATH since 2013.
If PA fails this, we go back to sub 90K but this is unlikely,
There are numerous projections that see BTC PA in price discovery reaching the 120K before serious resistance.
On this chart, if PA follows pattern and trends, we could see 378K by year end
Getting over that irange line is KEY
Stay safe everyone.

WIF/USDT About to Explode or Collapse?Yello Paradisers, have you prepared yourself for what’s about to unfold on SEED_WANDERIN_JIMZIP900:WIF ? Because this setup is screaming opportunity but only for those who are ready to act with precision and patience.The current price structure is forming a classic descending wedge, a pattern that historically resolves with explosive moves. But here’s where it gets really interesting.
💎#WIFUSDT is now grinding toward a key demand zone between 0.82 and 0.87, where there is a high probability of a strong rebound. This zone aligns perfectly with the 50 EMA, further reinforcing the potential for a bullish reversal.
💎If the demand holds, we could easily see price break out from this compression pattern and push toward the moderate resistance near 1.22. Above that, the major resistance zone around 1.42 to 1.45 remains the next magnet a zone where large players are likely to take profit or even reverse positions.
💎However, we’re not ignoring the bear case either. If this demand fails to hold, and the price we are expecting for a bullish rebound from the lower demand at $0.719 closes below 0.642, the setup becomes invalidated, and the door opens for a deeper correction—possibly driving price toward or even below the 0.50 level. That would flush out overleveraged positions and trap breakout traders on the wrong side once again.
Patience and precision will be your edge in this volatility. Be a pro. Trade smart. Stay disciplined.
MyCryptoParadise
iFeel the success🌴

BTCUSD Double Tap Into OB Before Massive Sell-Off! 2,000+ PipsHere’s why this could be one of the cleanest bearish setups of the week based on institutional flow and price action:
🚨 Step 1: Liquidity Engineering in Full Effect
We’ve got multiple areas where price was engineered to grab liquidity — clearly visible with those highlighted zones. Bitcoin pumped into a Strong High, tagging liquidity above a key trendline while respecting an internal parallel channel.
This move was not random. It was a textbook liquidity sweep.
🔁 Step 2: Order Block + 70.5% Fib Confluence
After the sweep, price retraced precisely into a bearish Order Block that overlaps perfectly with the 70.5% Fibonacci level — a hidden gem Smart Money loves to use for optimal entries. It’s the sniper zone.
This is where the first rejection came in, marking the start of bearish intent.
⚠️ Step 3: Break of Structure + Weak Low Exposed
As price dropped, it broke back under a weak low, confirming shift in market structure. This is your Change of Character (ChoCh) — the moment sellers regain control.
We’re now seeing retracement candles struggling to push above the OB/Fib zone. Rejection here confirms the setup.
🎯 Target Zones Breakdown:
✅ TP1 - Weak low around 110,200
✅ TP2 - -27% Extension (~109,500)
✅ TP3 - -62% Fib extension (109,268)
🚀 Extended Target - Possible sweep of Sell Side Liquidity all the way to 108,000–107,500
This is a potential 2000+ pip move if the full extension plays out.
🧠 Market Psychology in Play:
Institutions love to trap traders long after major breakouts. That last pump into the high? It wasn’t retail demand — it was liquidity generation. Now that they’ve swept the highs, they're driving price down to rebalance and mitigate.
Every highlighted zone on this chart? It’s a Smart Money footprint.
📌 Entry Game Plan:
Watch how price behaves around the current OB zone (111,250–111,618).
If price rejects and flips back under the midpoint (111,116), that’s your trigger.
Enter with tight SL above 111,750 and aim for TP1, TP2, and trail the rest to TP3 or lower.
📈 Risk Management Reminder:
Set your SL above structure.
Don’t overleverage — this is a clean setup, but patience is 🔑.
Let price come to you, not the other way around.
✍️ Final Thoughts:
This BTCUSD setup screams Smart Money — we’ve got:
Liquidity grabs ✅
Clean OB + Fib confluence ✅
ChoCh + structural rejection ✅
Strong R:R with multiple targets ✅
This might be the move to catch before the weekend liquidity sweep.
💬 Comment "BTC MOVE" if you’re watching this with me!
🔁 Tag your trading fam who needs to see this breakdown!

DOGEUSD: Hasn't said its last word. $3 within reach.DOGE is bullish on its 1D technical outlook (RSI = 64.264, MACD = 0.014, ADX = 32.304) fueling a larger move on the 1M candle which last month rebounded exactly on the 1M MA50. This suggests that long term, Doge is on the very same spot as it was on both prior Cycles in February 2021 and September 2017. Both were the last lows before the end Cycle rally, which was on average +2600%. If it's repeated, Dogecoin can very well reach $3.00 by the end of the year.
See how our prior idea has worked out:
## If you like our free content follow our profile to get more daily ideas. ##
## Comments and likes are greatly appreciated. ##

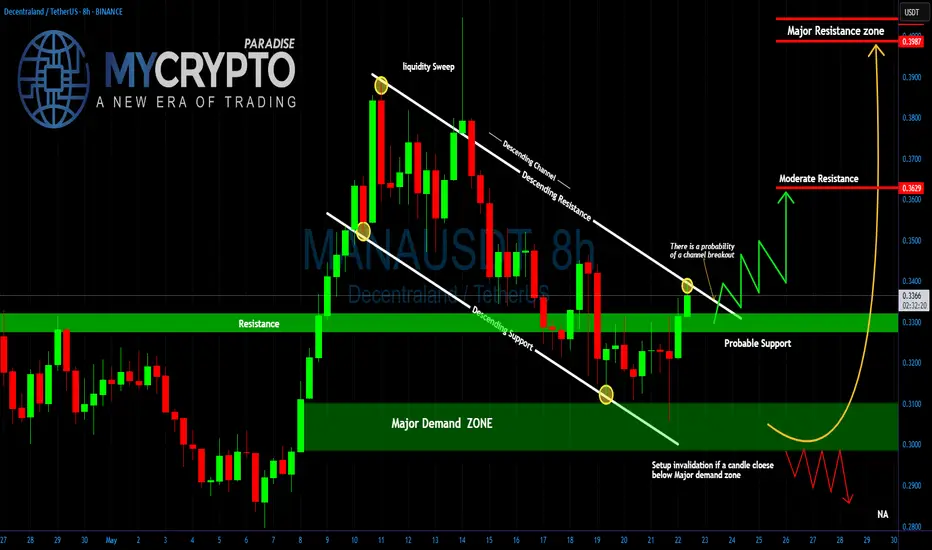
Is MANA About to Break Out?Are You Ready for It?Yello Paradisers, can you feel the calm before the storm? MANAUSDT is quietly setting up for what could become a major breakout move and most traders won’t see it coming until it’s already too late. That’s exactly the kind of opportunity we love to prepare for in advance.
💎#MANAUSDT has been consolidating inside a clearly defined descending channel, marked by consistent lower highs and lower lows since its liquidity sweep above $0.39. This cooling-off phase has allowed the market to reset after that aggressive move, but now, the structure is starting to shift.
💎What’s important here is the price action around the horizontal resistance-turned-support level near $0.33. Price is currently hovering just above this zone, and early signs of a breakout are beginning to show. A clean candle close above the descending resistance of the channel will be the confirmation signal that many smart traders are waiting for and it could set off a wave of FOMO driven momentum.
💎Below the structure, we see a well-defined major demand zone between $0.2950 and $0.3100. This is where buyers stepped in aggressively after the channel lows were tested. As long as price stays above this zone, the bullish setup remains valid. However, if we get a confirmed candle close below that demand zone, the entire structure becomes invalidated, and further downside becomes likely.
It’s not about catching every move it’s about catching the right ones with proper validation and risk control. Trade smart, Paradisers.
MyCryptoParadise
iFeel the success🌴
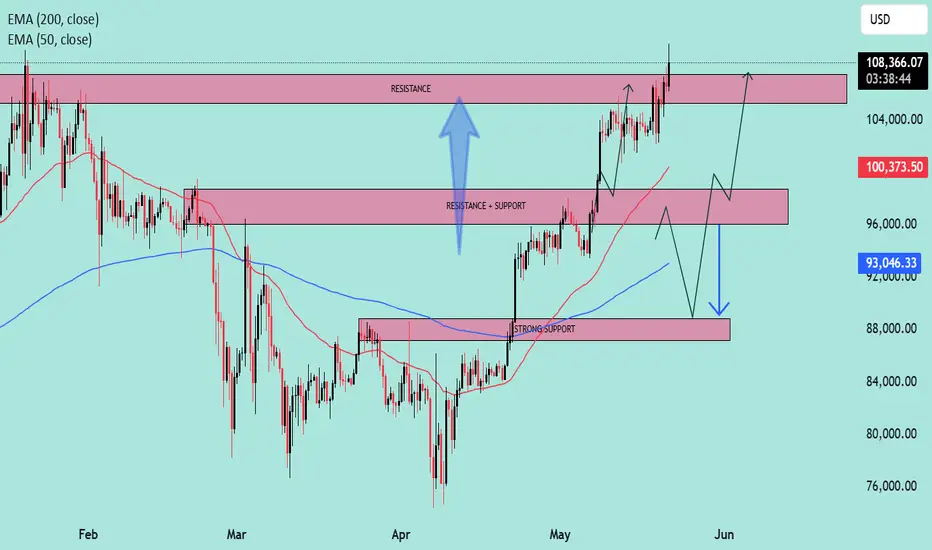
Technical Levels Respected – BTC Reaches $108K Target what next?📍 BTC Target Hit with Precision!
✅ As predicted in the previous analysis, Bitcoin has successfully tapped the $108K resistance zone — clean and technical execution!
📊 My chart spoke in advance... and the market listened.
🎯 Why miss out on these accurate forecasts?
📉 My strategies are not just random lines — they’re built on solid market structure, EMAs, and key price action zones.
📢 Let’s stay connected!
🧠 I’m committed to sharing educational content and professional trading insights to help you grow as a trader.
💡 Whether you're a beginner or seasoned trader, there’s always something new to learn with me.
📚 Join the journey — learn, trade, and win!
📩 DM or follow to get consistent updates and chart breakdowns.
🚀 Let’s trade smart, not hard!
BTCUSD: Made new ATH on Genius Bill vote. 1D Golden Cross formedBitcoin just made new ATH today pas 109,500 as the U.S. Senate officially advanced the GENIUS BILL for consideration. This has turned the 1D technical outlook overbought (RSI = 75.442, MACD = 4135.600, ADX = 30.728) but as mentioned before, Bitcoin tends to thrive on such a state. On top of the very bullish fundamental news, the market just formed a 1D Golden Cross the first since the U.S. elections one (October 27th 2024). That signaled the extension of the bullish trend to +122.18%. If we apply that on the current bullish wave along with the Fibonacci retracement level, we can see that the price is insde the 0.382 - 0.5 Fib range, exactly where it was on the 2024 Golden Cross. If this plays out exactly this way, expect $165k by late July.
## If you like our free content follow our profile to get more daily ideas. ##
## Comments and likes are greatly appreciated. ##

BTCUSD Buy CallBuy BTC on current price it can retest it all time high,
Risk reward is also mentioned act accordingly.

ETHUSD: Consolidation before the Megaphone targets 4,100Ethereum is on a strong bullish 1D technical outlook (RSI = 63.675, MACD = 190.470, ADX = 31.885) despite the current technical pullback which is happening due to the rejection on the 1D MA200. Once crossed, we expect a test of the Megaphone's top (TP = 4,100).
## If you like our free content follow our profile to get more daily ideas. ##
## Comments and likes are greatly appreciated. ##

BTCUSD: Going for the decisive breakout that opens path to 155,0Bitcoin is almost overbought on its 1D technical outlook (RSI = 69.391, MACD = 3884.400, ADX = 20.801), which during rallies is the starting condition that fuels bullish breakouts and continuations. Such a breakout is about to take place right now as the price is on the LH trendline coming from the ATH. As this chart shows, once Bitcoin breaks over a LH trendline on this Cycle, it has always delivered (much) more upside. Assuming we are currently on the 0.5 Fibonacci level of that breakout, the pattern gives a TP = 155,000.
## If you like our free content follow our profile to get more daily ideas. ##
## Comments and likes are greatly appreciated. ##
