ZEC Breakdown in Play — React or Get Left BehindYello, did you see the textbook rejection right at the supply zone... or are you already late to the move?
💎#ZECUSDT just gave a clear signal, and if you're not paying close attention, this could be the start of a much deeper breakdown that catches most traders off guard.
💎After completing a clean breakdown from the rising wedge pattern, the price returned for a precise retest... and failed. The rejection right at the $400–$420 supply zone confirms it. That level was a critical resistance where bulls had their final shot to reclaim momentum — but they failed to flip the structure.
💎Now, unless ZEC rapidly reclaims the wedge breakout level, the path of least resistance is clearly down. While there’s a minor support forming near $328, it’s weak and unlikely to hold under sustained selling pressure.
💎 A drop toward the stronger support zone between $285 and $272 is where we expect a real reaction. Only a decisive reclaim above $437 would invalidate this bearish setup and suggest the bulls are back in control.
Discipline, patience, and strategy always win.
MyCryptoParadise
iFeel the success🌴
Cryptotrading

ETUSD MORE DROP OR TRAP (READ CAPTION)Hi trader's. what do you think about ETHUSD
Hi
Price Action | Smart Money Concepts
Gold, BTC & Indices Specialist
Market Structure, Liquidity & Supply–Demand Based Trading
Sharing Clean Setups, Journals & Real-Time Market Bias
Risk Management First – Consistency Over Hype"
Hi
Hotel pe ao?
?
Hi
Gold is maintaining a bullish structure and is expected to continue higher as long as the price holds above the key support zone.
🔹 Support Zone (4275 – 4260):
This is a strong demand area where buyers are likely to enter the market. Price reactions from this zone can provide buying opportunities in line with the bullish trend.
🔹 Resistance Level (4317):
This is the immediate resistance. A successful breakout and close above 4317 can confirm bullish continuation and open the door for higher levels.
🔹 Supply Zone (4350):
This is a major supply area where selling pressure may appear. If price reaches this zone, profit booking or a temporary pullback is possible unless a strong breakout occurs.
🔹 Overall Bias:
As long as Gold remains above the 4260 supp…
ETHUSD is showing a bullish trade structure, indicating potential upside continuation as long as price respects the key support level.
🔹 Support Level (2723):
This is a strong support area where buyers are expected to step in. Holding above 2723 keeps the bullish trend intact and offers possible buy-on-dip opportunities.
🔹 Resistance Level (3023):
This is the immediate resistance. A confirmed breakout and sustained move above 3023 can trigger further bullish momentum toward higher zones.
🔹 Supply Zone (3199):
This zone represents a major supply area where sellers may become active. Price may face rejection or consolidation here unless strong buying pressure leads to a breakout.
🔹 Overall Bias:
The bullish outlook remains valid while ETHUSD trades above the 2723 support. Pullbacks are considered corrective within the broader uptrend.
please like comment and follow

BTC DAILY: 84K OR 100K – WHICH HITS FIRST?Here’s how this BTC move is mapped out.
-If Bitcoin falls below 84,000 and stays under it, it can drop toward 78,500 and, if selling keeps up, even down into the 73,000–71,500 area.
-If Bitcoin pushes up and breaks above the 93,800 zone, then the next big target on the chart is 100,000, which has been a major level before.
If you’re feeling lost with levels or risk in this range and want a second pair of eyes, just drop a comment or message and can walk through your plan together
Trade What You See/ Mindbloome Exchange
Kris

THE PSYCHOLOGY OF TRADING: WHY MOST TRADERS LOSE?You have probably heard that most people who attempt trading end up losing money. There’s a
good reason for this, and the reason is primarily that most people think about trading in the
wrong light.
Most people come into the markets with unrealistic expectations, such as thinking they are
going to quit their jobs after a month of trading or thinking they are going to turn $1,000 into
$100,000 in a few months. These unrealistic expectations work to foster an account-destroying
trading mindset because traders feel too much pressure or “need” to make money.
When you begin trading with this pressure, you inevitably end up trading emotionally—which is
the fastest way to lose your money.
To be specific, let’s break down the 4 Main Emotional Factors that destroy portfolios: FOMO,
Fear, Revenge, and Greed.
__________________________________________________________________________________
1. FOMO (Fear of Missing Out)
FOMO is an emotional state experienced by almost everyone. For traders, it is accelerated by
feelings of jealousy, envy, and impatience. The depth of these emotions is intensified by the
fast-acting environment of the Crypto and Forex markets.
How to Avoid FOMO:
● Develop a Routine: Trading is often a singular, lonesome pursuit. Eliminate distractions
and focus on identifying key market spots to tune out external chatter. Avoid social
media outlets and ungrateful attitudes.
● Be Present Minded, Future Thinking: Just because a trade is lost does not mean the
following transactions will follow suit. There are always more trading opportunities. Stay
present-minded yet have your scope set upon the future goals of your trading.
● Employ a Trading Plan: No plan is perfect, but a well-developed plan covers most
eventualities, helping you invest with lower risk exposure and more consistency.
Establish short-term, medium, and long-term trading goals.
● Take Joy from Trading: FOMO stems from insecurity and greed. Once a trader grasps
this truth, they can cast out this reckless state and trade with maximum potential.
__________________________________________________________________________________
2. GREED (The Account Destroyer)
There’s an old saying regarding markets: “Bulls make money, bears make money, and pigs
get slaughtered.”
This means if you are a "greedy pig" in the markets, you are almost certainly going to lose.
Greed acts as a trader’s kryptonite. When the desire for wealth clouds logic, traders make fatal
mistakes such as:
● Not taking profits because they think a trade will go on forever.
● Adding to a position simply because the market moved slightly in their favor (without
logical price action reasons).
● Using excessive leverage to maximize potential gains.
● Doubling down on losing trades (The Martingale Strategy).
Advice for Avoiding Greed:
Think of greed as the counterpart to discipline. Traders who are well-poised and consistent are
less likely to fall victim to greed. It is critical that every trader consistently follow trading plans;
otherwise, the likelihood of slipping into destructive habits is far greater.
__________________________________________________________________________________
3. FEAR
Fear often arises after a trader hits a series of losing trades or suffers a loss larger than what
they are emotionally capable of absorbing.
When fear takes over, you hesitate. You might see a perfect setup that aligns with your strategy, but you freeze because you are afraid of losing again. Or, you might cut a winning trade too early because you are terrified the market will turn against you. Fear paralyzes your ability to execute your edge.
__________________________________________________________________________________
4. REVENGE TRADING
Revenge trading is a natural emotional response when a trader suffers a significant loss. The
idea is to recover the money immediately. The thinking is: "If I put on another trade right now, I can win it back."
Usually, this "expected" winning trade turns into a losing trade—often bigger than the first one.
5 Effective Ways to Fight Revenge Trading:
1. Step Back Temporarily: Take a day or two off. If you must be in the markets, trade
incredibly small, but the best course is to walk away.
2. Make a Self-Assessment: Once you are emotion-free, analyze what led to the loss.
Was it a bad strategy, or bad execution?
3. Assess Market Conditions: Is the market too volatile? Are there no solid trends?
Sometimes the best trade is no trade.
4. Assess Your Strategy: Check your entry and exit criteria. Did you actually see a setup,
or did you force a trade out of anger?
5. Make Necessary Adjustments: Note the feedback, learn the lesson, and mentally
"throw" the bad trade away. Affirm to yourself: "That is how I will do it next time."
__________________________________________________________________________________
SUMMARY
Trading is simple, but it is not easy. The charts are the easy part; managing your own mind is
where the real work begins. Identify these four emotions— FOMO, Fear, Greed, and
Revenge —and suppress them the moment they arise.
Are you controlling your emotions, or are they controlling your portfolio? Let me know in
the comments below.
__________________________________________________________________________________
Disclaimer: This content is for educational purposes only. Trading involves significant risk.

INJ | Testing Key Support | Oversold Swing SetupInjective (INJ) is currently holding a crucial support zone between $4.75 and $5.20 — a level that has previously acted as a strong base. On the higher time frames, the asset is deeply oversold, suggesting that a potential bounce or short-term reversal could be forming.
💡 Trade Idea (Swing Long):
Entry Zone: $4.75 – $5.20
Take Profit 1: $7.00 – $8.00
Take Profit 2: $10.00 – $12.00
Stop Loss: Just below $4.50

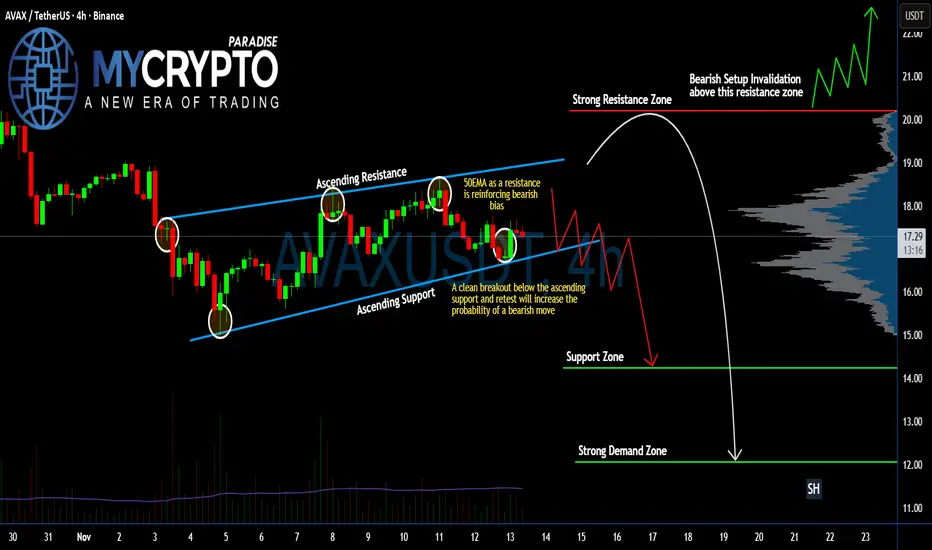
Is #AVAX Ready For a Massive Bearish Move or Not? Must Watch Yello Paradisers! Have you been keeping an eye on what’s happening with #AVAXUSDT? If not, you might be walking straight into a bearish trap. Let's break down the #Avalanche setup:
💎#AVAX has been trading inside an ascending channel, clearly respecting both the ascending support and resistance. We’ve now seen multiple strong rejections from the upper boundary, and most importantly, the 50 EMA is now acting as resistance, reinforcing a growing bearish bias across the board.
💎Current price of #AVAXUSD is $17.26, and we’re hovering just above the key ascending support. A clean breakdown below this support, followed by a bearish retest, would flip the structure and significantly increase the probability of a sharp bearish continuation.
💎If this bearish scenario plays out, we’re targeting the next Support Zone around $14.24. But that’s not where the real pain ends. The real liquidity is parked in the Strong Demand Zone around $12.07, where we could see aggressive buyer activity re-enter—if the market doesn’t capitulate first.
💎This entire bearish setup becomes invalid only if #AVAX manages to reclaim the $20.19 resistance zone. A breakout above that would invalidate the breakdown scenario and likely open the gates for a fast rally into the $22+ region.
Trade smart, Paradisers. This setup will reward only the disciplined.
MyCryptoParadise
iFeel the success🌴
SEI – Swing Trade Setup Near Major SupportSEI is currently testing a crucial support zone around $0.11–$0.115, which has historically acted as a strong demand area. We're watching closely for signs of a potential bounce, with momentum indicators showing early signs of reversal. This could offer a low-risk, high-reward swing trade opportunity if the support holds.
🔹 Entry Zone: $0.110 – $0.115
🔹 Targets: $0.15 / $0.20 / $0.25
🔹 Stop Loss: $0.08

BTCUSDT Under Seller Control — Rallies Are for SELLBTCUSDT is entering a clear corrective phas e, with sellers firmly in control . In a market environment that remains risk-averse, recent news shows that risk capital is not yet ready to return to crypto , while macro pressure and defensive sentiment continue to dominate. As a result, Bitcoin lacks bullish momentum and is vulnerable to selling pressure at resistance levels.
On the H4 timeframe, the technical structure confirms that a bearish trend is forming and strengthening . Price has been rejected multiple times at overhead resistance and has broken below the Ichimoku cloud, signaling a clear loss of momentum. The descending trendline remains heavy above price, causing each bounce to be purely technical and quickly sold into.
In the short term, 86,500 acts as a key resistance zone. As long as BTCUSDT remains below this level, the preferred scenario is a continuation lower toward 82,000, where stronger support may trigger a reaction. Any upside pullbacks during this phase should be viewed as SELL opportunities within the trend , rather than early signs of a reversal.

Bitcoin Pauses, Bears Take the LeadIn a week packed with major economic data releases, Bitcoin is clearly shifting into a defensive mode . A cautious tone dominates the market as investors limit new positions, waiting for clearer signals from inflation data, U.S. labor reports, and central bank policy guidance . BTC slipping below the 90,000 USD mark reflects this hesitation rather than a panic-driven sell-off.
From a technical perspective, the price structure is leaning toward a short-term bearish bias . BTC has been repeatedly rejected at the descending trendline and has failed to sustain higher highs. Price is currently trading below the Ichimoku cloud, signaling that bullish momentum has weakened significantly; recent rebounds are largely technical in nature and quickly sold into, typical behavior of a market that is waiting for confirmation.
The 90,700 USD area now acts as a near-term resistance. As long as price remains capped below this level, the more probable scenario is a continuation lower toward the 86,500 USD zone—an area of key technical support where a short-term reaction may occur. In this environment, the preferred approach is to prioritize selling on pullbacks and avoid chasing long positions while the market lacks a strong catalyst.
Thank you for taking the time to consider my perspective, and I wish you successful and disciplined trading ahead.

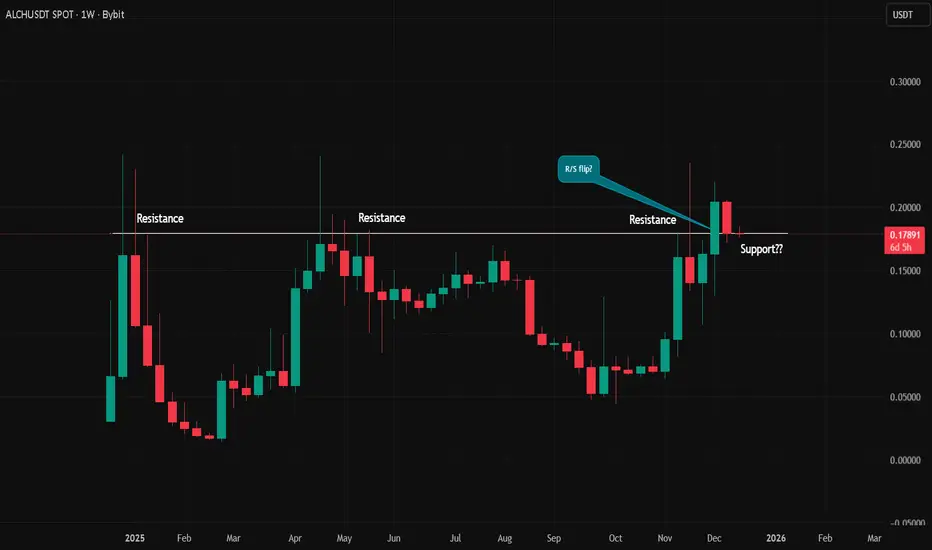
ALCH Weekly Analysis
Price is currently trading at a key HTF resistance zone, where multiple prior rejections have occurred.
Structure
Price has impulsed back into a long-standing resistance level
No weekly close above resistance so far
Current candles show hesitation → possible R/S flip attempt
HTF structure remains range-bound until acceptance is confirmed
Key levels
Resistance: current HTF range high
Support: previous range support below (range low)
Mid-range remains a low-probability area
Scenarios
Bullish: Weekly close and acceptance above resistance → continuation toward higher HTF liquidity
Bearish: Failure to hold this level → rejection back into the range
Execution
I’m waiting for weekly confirmation before looking for any lower-timeframe setups.
Patience until structure decides direction.
MrC
BTC Weekly Outlook: Trend Still Bearish, But Watch These LevelsBitcoin made a move early this week, breaking above last week's high — only to face sell pressure after the Fed’s rate cut. While rate cuts usually add liquidity (a positive for risk assets), BTC's technicals still lean bearish.
🔻 Trend Check:
Still forming lower highs and lower lows
No sign yet of a sustained trend reversal
Bulls need a confirmed higher low to shift momentum
📊 Technical Setup:
This bounce may be part of a corrective rally in a rising channel
Key resistance zone: 94K–95K
A clean breakout here could target 105K next
📌 What to Watch:
Price action near 94K–95K
Whether BTC prints a higher low on this pullback
🧠 Caution: Until the trend flips, rallies may be short-lived.

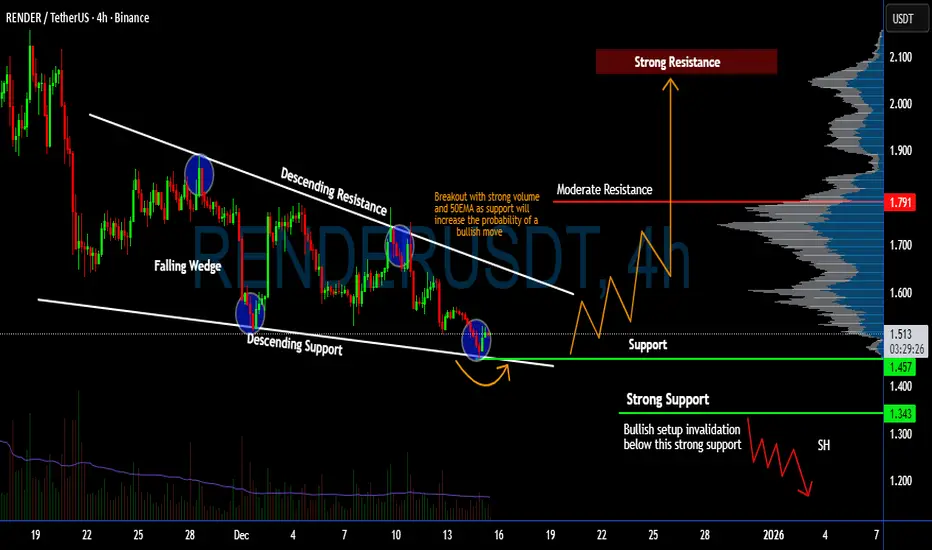
Will #RENDER Recover From Here or Not? Major Signs FlashingYello, Paradiser! Are you watching how #RENDERUSDT is respecting this falling wedge structure? Is a recovery on the horizon? Let's view the #Render setup:
💎#RENDERUSD is currently sitting right at the wedge's descending support after multiple rejections from the upper resistance trendline. Each touch of this support has triggered buyer interest, and if we see a breakout with strong volume, especially reclaiming the 50EMA, it could confirm a bullish shift.
💎This exact price action setup, a falling wedge paired with volume contraction, is a classic pre-breakout scenario. If the price pushes above the descending resistance with strength, it opens the path toward the moderate resistance around $1.79, with a potential continuation toward the strong resistance zone near $2.10.
💎On the downside, the strong support at $1.34 is critical. If we see a clean breakdown below that level with no recovery, it would invalidate this bullish setup and open the door for a deeper retracement into the low $1.20s. So far, however, buyers are stepping in aggressively whenever price dips into this support range — a sign of ongoing accumulation.
💎The next 1-2 candles will be crucial. A breakout above the wedge with volume confirmation could trigger a fast squeeze as short positions unwind and momentum buyers rush in. But patience is key, wait for the breakout and retest for the highest probability setup.
Trade smart, Paradisers. This setup will reward only the disciplined.
MyCryptoParadise
iFeel the success🌴
DYDX About to Explode or Collapse? Yello, have you seen what #DYDX is doing right now? This textbook falling wedge is running out of space, and the next move will either trap late sellers or leave sidelined bulls chasing.
💎#DYDXUSDT has broken out of its falling wedge pattern, and we’re now waiting for a clean retest of the breakout zone. Once that retest is confirmed, there’s a high probability of a bullish continuation move.
💎Previously, we saw price dip below the descending support, but that breakdown was quickly absorbed by buyers, flipping the script and revealing early signs of seller exhaustion. That kind of failed breakdown is a classic signal of demand strength.
💎 What’s even more telling is the reaction at the demand zone. Instead of panic or cascading liquidations, we’re seeing multiple rejections from the same support area—a clear signal that accumulation is underway.
💎 If price continues to push up from here and successfully retests the wedge, that would confirm a shift in market control. The first target is the minor resistance zone, and from there, any breakout backed by increasing volume could trigger a sharp expansion move toward the next major resistance area. That’s where momentum could accelerate quickly.
The bullish thesis remains valid as long as the current demand zone holds firm. However, a clean break and close below this area would invalidate the setup and open the door for a deeper correction.
MyCryptoParadise
iFeel the success🌴

SOL Quietly Accumulates, Waiting for the 140 BreakoutSOLUSDT currently shows the exact “signature” of a mild bullish move: not noisy, but advancing on a solid price base with clear accumulation . From a news perspective, SOL remains highly influenced by overall crypto market sentiment. As long as BTC stays stable and risk-on conditions remain moderate , Solana typically trends into a gradual recovery. That said, short-term pullback risk should still be respected , as altcoins often experience shakeouts before committing to a direction.
On the chart, price is currently compressed within a well-defined range: support around 130 and resistance near 140. Ichimoku indicates price is sitting in a short-term equilibrium zone, suggesting the market is in a force-building accumulation phase. When volatility tightens like this, the common scenario is a brief liquidity sweep to the downside, followed by a rebound to retest the upper boundary.
The most reasonable mild bullish scenario is to prioritize BUY setups on pullbacks toward 130–132, provided price shows clean holding behavior. From there, SOL is expected to push back toward 140 to test resistance. A clear break above 140 could allow the uptrend to extend further in a step-by-step advance rather than a vertical spike.
In summary, SOLUSDT is in an “accumulate to grind higher” phase . The 130 zone is the key anchor for maintaining the mild bullish outlook, while 140 is the gate that must open for further upside. The real question now is: will SOL bounce cleanly from 130 as expected, or will it need one more sweep before the move begins?

Surviving this market for 10 years taught me thisI’ve been trading this market for over 10 years.
In the beginning, all I cared about was how much I could make.
That’s what most people focus on.
What I learned the hard way is this:
If the account doesn’t survive, nothing else matters.
No funds means no next trade.
No next trade means no edge, no learning, no comeback.
There were long periods where I wasn’t making money.
But I was protecting my ability to stay in the game.
That mattered more than being right.
This chart isn’t about profits.
It’s about still being here.

QNTUSDT Breakdown Loading? Yello Paradisers! Have you seen what’s forming on #QNT’s chart? A clean Head and Shoulders pattern is developing, and it’s signaling that a major move could be just around the corner.
💎The structure shows clear bullish exhaustion, with the left shoulder, head, and right shoulder all forming under weakening momentum. Price is now pressing directly against the neckline supports the final barrier before a potential trend reversal.
💎Adding fuel to the fire, #QNT has already broken below its ascending trendline, confirming that buyers are losing grip. If we get a confirmed close below the neckline with volume, the bearish setup becomes active, opening the door to more downside.
💎The first area to watch is 81.70, a minor support where short-term buyers may react. But the main downside target sits between 69.65 and 67.52, a strong historical demand zone and high-volume area that could attract heavier bids.
💎As long as QNT stays below 99.70, the bearish outlook holds. A reclaim of that level would invalidate the pattern and give bulls another shot at pushing higher.
Stay sharp, the setup is clean, but it’s also a classic trap zone.
MyCryptoParadise
iFeel the success🌴

DASH Breakout: Reversal or Trap?
Yello Paradisers, is this the beginning of a massive DASH reversal or just another fakeout that will punish impatient bulls?
💎#DASHUSDT has just broken out of a well-defined Falling Wedge formation, a classic bottoming pattern that often signals the end of a correction and the start of a new bullish phase. The move comes after a strong bounce from the major demand zone around $45–46, a level that has consistently attracted buyers and proven itself as a high-liquidity reaction area.
💎The breakout above the descending trendline shows that sellers are losing control, but the structure still demands confirmation. What matters now is whether the market delivers a clean retest. Ideally, a pullback toward the broken trendline or a dip back into the upper portion of the $45–46 demand zone would serve as a strong confirmation and potential entry trigger for the next impulsive move.
💎If buyers step in with strength on the retest, #DASH could start grinding higher toward the first resistance around $49–50, and if momentum sustains, the price may even push toward the more significant resistance region near $55.
💎That said, this structure is still fragile. A failure to hold the demand zone, particularly if price breaks below $44, would invalidate the bullish scenario and put DASH back at risk of deeper downside.
It’s not about being early, it’s about being right. Stay sharp and don’t let emotions dictate your trades. That’s the only way you make it far in this game.
MyCryptoParadise
iFeel the success🌴

Funds Are Coming Back – Will BTC Surge?Hello traders, wishing you a great day! Let’s take a look at BTCUSDT together.
If we had to name one asset that is recovering after a storm and starting to attract capital again, Bitcoin is definitely the leading candidate right now. Expectations that the Fed will soon cut interest rates are bringing risk appetite back , the USD is cooling down, and part of the capital flow is returning to crypto – therefore BTC has a solid chance to recover after the sharp drop at the end of November.
On the 12H chart, BTC remains inside a downward channel , but is moving steadily above the short-term support around 85,700, which is marked as Immediate support . The current pullback is mainly a pause to regain momentum after the first rebound, without breaking the latest lows , and is showing signs of forming a higher low.
If price continues to hold above 85,700 and forms an accumulation pattern as projected, the resistance zone 93,900 near the upper boundary of the channel and the Ichimoku cloud will be the next natural target.
Given that macro news is gradually supporting risk assets and technical signals show weakening selling pressure, I personally prefer the scenario where BTC continues to recover toward 93–94k , rather than breaking support immediately.

TRX Breakdown Incoming? This Trendline Retest Could Be the FinalYello Paradisers, could this be the final warning before #TRX breaks down completely? Or is the market setting up for a savage fakeout that will trap late sellers and then rip higher?
💎#TRXUSDT is currently retesting the ascending trendline after pulling back from the supply zone around $0.2820, a level that has consistently acted as strong resistance. Price action remains within a clearly defined ascending channel, with the lower trendline still providing solid technical support; however, momentum is beginning to shift. The MACD is starting to show signs of developing bearish pressure, supporting the likelihood of a potential downside continuation in the short term.
💎If the current retest fails and confirms a rejection from this supply zone, the probability of a move lower increases significantly. In that case, the price could first target the minor support around $0.2720, and if selling pressure continues, we would be eyeing the stronger support zone near $0.2660 as the next key level to watch. On the flip side, a confirmed breakout above $0.2900 would completely invalidate the bearish setup and instead favor a bullish reversal scenario, opening the door for a more aggressive leg up.
💎Right now, the market structure presents a clean and high-probability short setup. The risk is clearly defined above the $0.2820 supply zone, and if the rejection confirms, the setup offers a very favorable risk-to-reward ratio for disciplined traders.
Trade smart, Paradisers. The market is never generous for long, and only those who combine strategy with discipline will reach the winner’s circle.
MyCryptoParadise
iFeel the success🌴

SOL at a Major Turning Point — Big Move Ahead#SOL
SOL is sitting right on its major weekly support, a zone that has held the chart together multiple times. This area is still acting as the main foundation for the current structure 🧱
If SOL can bounce from here and push back into the resistance zone above, the chart opens the door for a larger continuation toward the upper distribution area 🚀
We can already see how clean the structure becomes once price reclaims that mid-zone.
But if this major support fails to hold, SOL could slide into the deeper accumulation zone — a long-term area where strong buyers usually step in 👀
Right now, SOL is at a critical point. How it reacts here will shape the next big weekly move. Stay patient and follow the reaction, not the prediction ⚡
#SOLUSDT

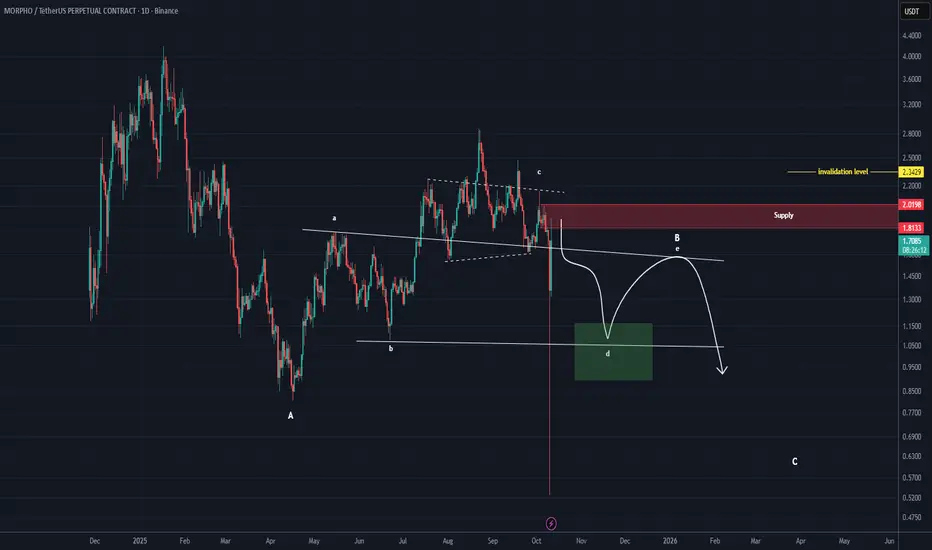
MORPHO Analysis (1D)It appears that MORPHO is currently in wave B. This wave forms a bearish triangle, and it now seems to be in wave D of that triangle. The price may move toward the green box, provided that the red box is maintained.
A daily candle close above the invalidation level will invalidate this analysis.
For risk management, please don't forget stop loss and capital management
When we reach the first target, save some profit and then change the stop to entry
Comment if you have any questions
Thank You
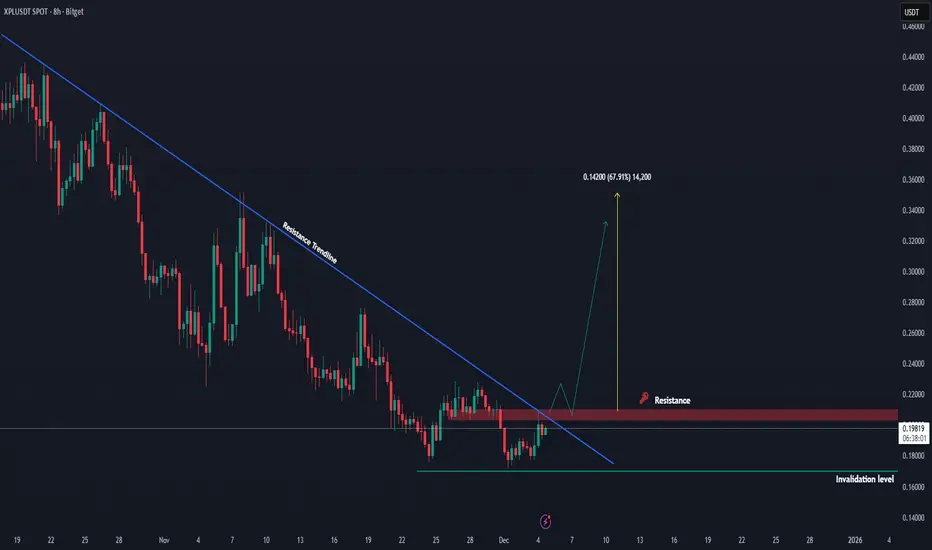
XPL Near a Break Point — Big Move Loading!!XPL is slowly climbing back toward its major resistance trendline, but it hasn’t broken out yet. The market is still testing this trendline, and this area remains the biggest barrier holding price down ⚠️
If XPL can finally break and close above this trendline, the structure could shift and open room for a strong move upward 🚀
But as long as it stays below, the trend is still in a cautious zone.
For now, we’re watching how price reacts right at the trendline — this is the level that will decide the next big move 📈
#XPL #XPLUSDT
BTC at Critical Support — Bounce or Breakdown?BTC 4H Update
BTC is still moving in a controlled pullback after failing to break the 93,241 resistance. The rejection shows the market continues to respect this supply zone, and price is now hovering just above short-term support.
The key area to watch is the 88,850–89,200 support zone. If BTC can hold this level, a rebound toward 90,193 is likely, followed by another attempt to break the major resistance. A successful breakout would open the path toward the 98k–99.5k zone shown on the chart.
However, if this support breaks, price may slide into the OB 87,670–86,300 or even revisit the 85,650–85,000 support area — the same zone that created the recent higher low. Losing that level would weaken the bullish structure.
For now, structure is still intact, and BTC just needs a clean bounce to maintain upward momentum.
