SOL at a Major Turning Point — Big Move Ahead#SOL
SOL is sitting right on its major weekly support, a zone that has held the chart together multiple times. This area is still acting as the main foundation for the current structure 🧱
If SOL can bounce from here and push back into the resistance zone above, the chart opens the door for a larger continuation toward the upper distribution area 🚀
We can already see how clean the structure becomes once price reclaims that mid-zone.
But if this major support fails to hold, SOL could slide into the deeper accumulation zone — a long-term area where strong buyers usually step in 👀
Right now, SOL is at a critical point. How it reacts here will shape the next big weekly move. Stay patient and follow the reaction, not the prediction ⚡
#SOLUSDT
Cryptotrading

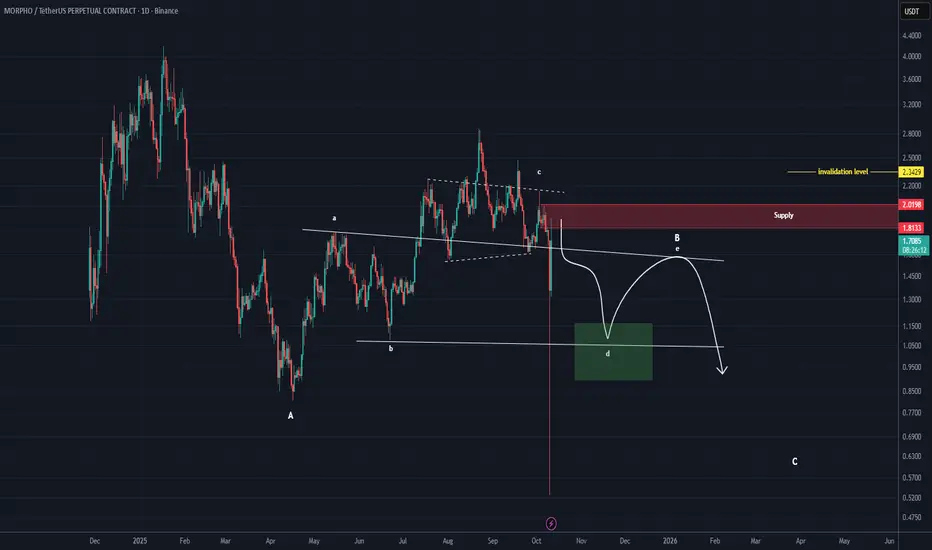
MORPHO Analysis (1D)It appears that MORPHO is currently in wave B. This wave forms a bearish triangle, and it now seems to be in wave D of that triangle. The price may move toward the green box, provided that the red box is maintained.
A daily candle close above the invalidation level will invalidate this analysis.
For risk management, please don't forget stop loss and capital management
When we reach the first target, save some profit and then change the stop to entry
Comment if you have any questions
Thank You
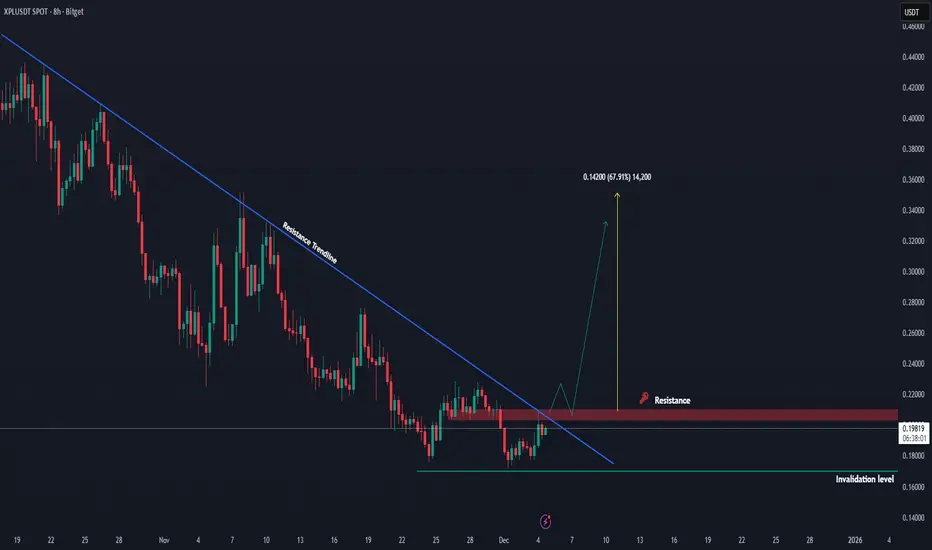
XPL Near a Break Point — Big Move Loading!!XPL is slowly climbing back toward its major resistance trendline, but it hasn’t broken out yet. The market is still testing this trendline, and this area remains the biggest barrier holding price down ⚠️
If XPL can finally break and close above this trendline, the structure could shift and open room for a strong move upward 🚀
But as long as it stays below, the trend is still in a cautious zone.
For now, we’re watching how price reacts right at the trendline — this is the level that will decide the next big move 📈
#XPL #XPLUSDT
BTC at Critical Support — Bounce or Breakdown?BTC 4H Update
BTC is still moving in a controlled pullback after failing to break the 93,241 resistance. The rejection shows the market continues to respect this supply zone, and price is now hovering just above short-term support.
The key area to watch is the 88,850–89,200 support zone. If BTC can hold this level, a rebound toward 90,193 is likely, followed by another attempt to break the major resistance. A successful breakout would open the path toward the 98k–99.5k zone shown on the chart.
However, if this support breaks, price may slide into the OB 87,670–86,300 or even revisit the 85,650–85,000 support area — the same zone that created the recent higher low. Losing that level would weaken the bullish structure.
For now, structure is still intact, and BTC just needs a clean bounce to maintain upward momentum.

CARDANO (ADAUSD): Bullish Reversal Confirmed?!
There are multiple bullish clues on ADA on a daily time frame
that make me think that the market is ready for a reversal.
First, the price formed a high momentum bullish candle.
Then, the market violated a resistance line of a falling
wedge pattern.
A change of character occurred afterward.
The market has a great potential to rise more
and reach 0.474 resistance soon.
❤️Please, support my work with like, thank you!❤️
I am part of Trade Nation's Influencer program and receive a monthly fee for using their TradingView charts in my analysis.

Big Money Is Pouring Into SOL – Is a Breakout Coming?When large capital starts flowing into Solana , SOLUSDT is no longer just another altcoin — it’s becoming a new safe haven for risk-on liquidity. Forward Industries recently announced that it now holds over 6.9 million SOL , making it one of the largest Solana treasuries in the world — a clear sign that institutional players are not just talking, but actually deploying capital.
On the technical side, the chart shows that SOL has broken away from its bottom structure and is now holding beautifully above the Ichimoku cloud. The area around 138 USDT has emerged as a new support zone: price has retested it multiple times without breaking, turning it into a solid base for accumulation. The current structure of higher lows confirms that buyers are still in control of the trend.
The most bullish scenario: SOLUSDT continues to consolidate above 138, compressing like a spring, before making a push toward the 153 USDT resistance area — exactly as projected on the chart. As long as price stays above 138 and the Ichimoku cloud remains below, the priority remains to buy dips, not to fight the trend.
In short, institutional inflows combined with a strong technical structure suggest that SOLUSDT is in a healthy, sustainable uptrend , and the current pullback looks more like an opportunity to enter, rather than a sign of weakness.

Bitcoin Comes Back to Life! Buyers Return With Full PowerIf I had to name a “warrior rising from the storm” , it would be BTCUSDT right now. After plunging to the 84k region, Bitcoin has just staged an almost 7% rebound back toward 93k, accompanied by news that big money from Wall Street is flowing back into crypto and overall fear in the market is calming down. The USD is no longer overly strong, and Bitcoin is once again being mentioned as a key gauge of market risk appetite .
Looking at the 12H chart, BTC has broken back above the bottom of the long-term descending channel and is now pushing into the Ichimoku cloud. This rebound isn’t a “spike and die” pattern — it’s a sequence of steady bullish candles with shallow pullbacks , showing that buyers are firmly in control. The scenario is becoming clearer: price may pull back to around 90,500 to gather liquidity and retest the cloud edge, before potentially bouncing toward the higher resistance region around 107,300 — the next equilibrium zone of the trend.
With the supportive news flow (institutional money re-entering, market accepting a new price base after the drop) and a technical structure showing BTC has temporarily escaped the free-fall phase , I remain biased toward buy-the-dip setups . The plan is to wait for short pullbacks for entries rather than trying to sell against a recovering bullish wave that’s clearly being “revived”.

BITCOIN (BTCUSD): Bullish Reversal is Coming?!
On our yesterday's live stream, we discussed Bitcoin.
It looks like the market found a bottom and preparing for a bullish reversal.
To confirm a start of an uptrend, I suggest focus on
92000 - 94100 Order Block zone.
Its breakout and a daily candle close above will confirm a bullish reversal.
A formation of a Higher Low after the last retracement from that leaves
some clues of a weakening bearish momentum.
A breakout will be our final confirmation.
❤️Please, support my work with like, thank you!❤️
I am part of Trade Nation's Influencer program and receive a monthly fee for using their TradingView charts in my analysis.

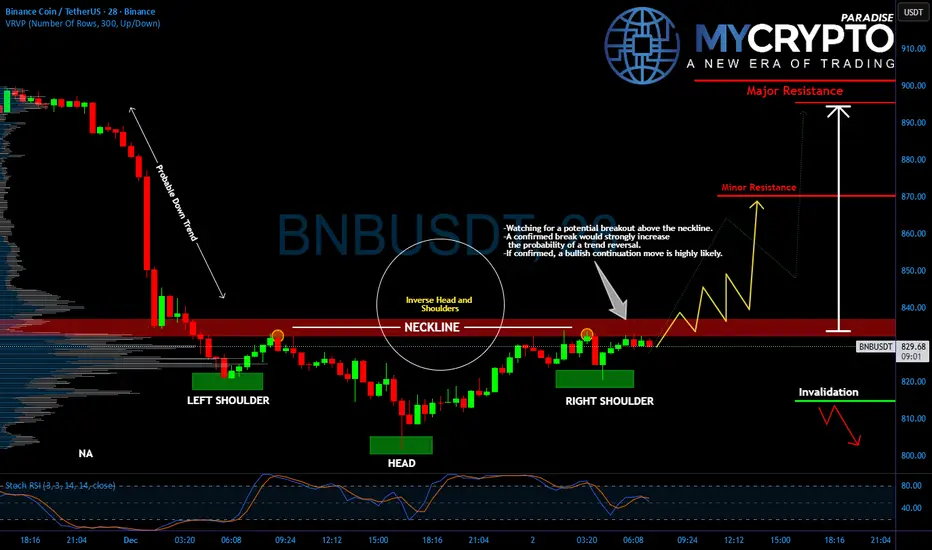
BNB Bulls Near Breakout: Reversal Pattern Emerges
Yello, Paradisers, is this the turning point for BNB? After the recent brutal drop, signs of a powerful reversal are emerging, and what we’re seeing now could trap late sellers in a dangerous spot.
💎#BNBUSDT has formed a textbook inverse head and shoulders pattern, signaling a potential bullish reversal after a steep downtrend. The neckline around the $834–$836 level has become a critical zone to watch. Price is currently testing this area, and a confirmed breakout above it could trigger a strong continuation move.
💎This structure forms after a sharp downtrend and often acts as a springboard for upside momentum when confirmed. If #BNB manages to break and hold above the neckline with volume, the next target lies near $870, minor resistance, with the $890–$900 zone acting as major resistance.
💎However, if bulls fail to break out and the price gets rejected from the neckline again, we could see a retracement back toward the $810 invalidation level, which would weaken the reversal setup and put short-term downside back in play.
💎The Stochastic RSI is also approaching overbought territory, suggesting bulls need to act quickly before momentum fades. Volume confirmation remains key here.
Stay sharp, the setup is clean, but it’s also a classic trap zone.
MyCryptoParadise
iFeel the success🌴
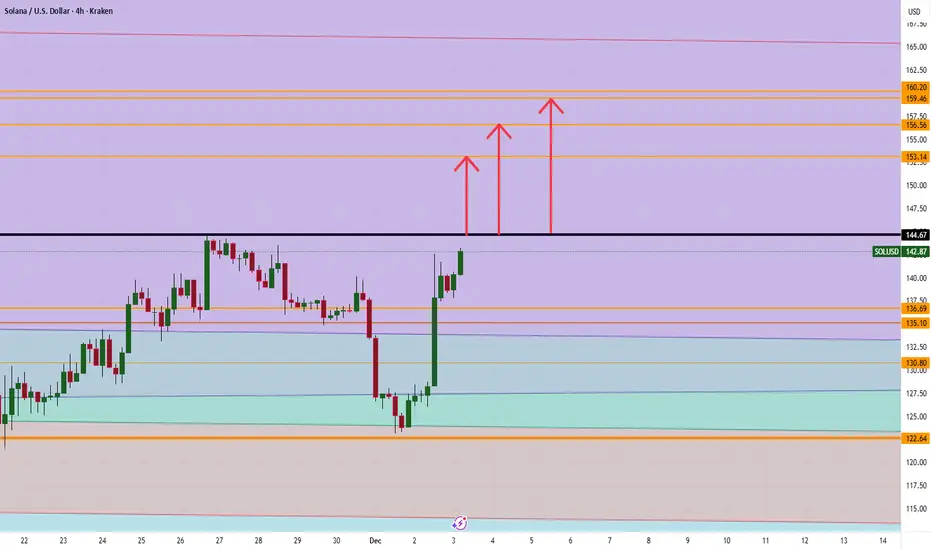
Solana Breakout to 153/156/ and 159 Jump on this MOVE !! Breakout on COINBASE:SOLUSD gets real only if we clear 144.67 with conviction. Above that, the levels to watch are 153, 156, and 159 for potential take profits.
Trade Smarter, Live Better/ Mindbloome Exchange.
If your trading feels stuck or you’re wrestling with a position right now, shoot me a message. Tell me what you’re doing, what’s not working, and I’ll send you a free, specific tweak you can test this week. No fluff, just something you can implement and see if it moves the needle.
STETH Bulls About to Get Trapped? Yello Paradisers, can you feel it? This breakout looks clean… but the trap might be even cleaner.
💎#STETHUSDT is currently pressing into a critical supply zone, and while the recent breakout from the channel looks solid on the surface, we’re watching closely for signs of bullish exhaustion. Price has been climbing steadily within a tight ascending channel, respecting both support and resistance levels precisely.
💎However, it has now entered a key supply area, aligning with strong historical rejection levels and pushing right into a zone where sellers previously took control.
💎Despite the aggressive move upward, the structure shows potential for a fakeout breakout, the kind that grabs late longs, sweeps liquidity, and then collapses.
💎A confirmed rejection from this supply zone around $2,940–$2,980 would be the first signal of a likely reversal toward minor support at $2,700, and potentially even deeper into the major support zone at $2,536.
💎Invalidation of the bearish bias comes only with a sustained breakout and daily close above $3,148.80, which would reintroduce bullish continuation targets.
Stay sharp, the setup is clean, but it’s also a classic trap zone.
MyCryptoParadise
iFeel the success🌴

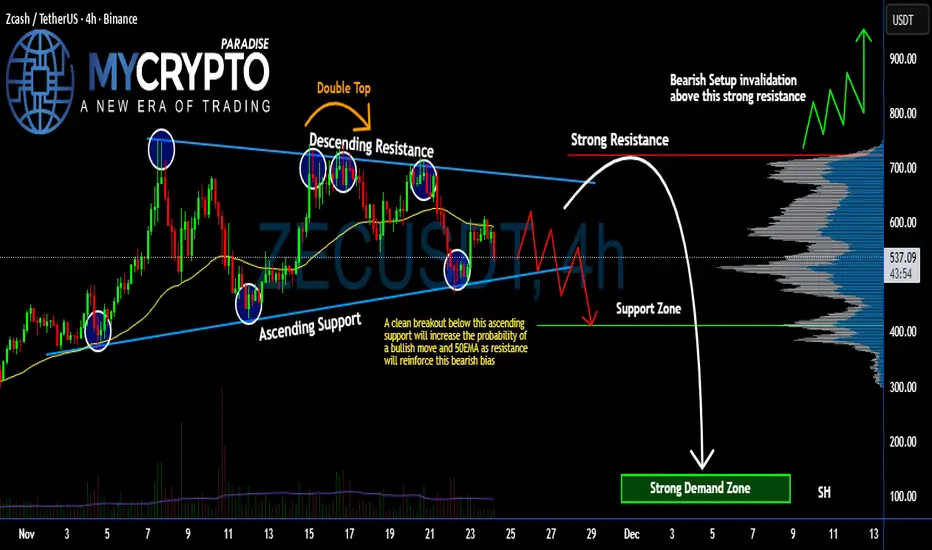
Is #ZEC Showing Signs of Weakness? Bears Ready to take Control Yello Paradisers! #ZECUSDT is flashing some serious structural clues—and if you’re not watching closely, you might miss a textbook bearish setup forming right under your nose. Let’s break down the #Zcash setup:
💎#ZEC has been trading between a clean symmetrical triangle, creating a tightening structure. This squeeze has already produced multiple strong rejections from the descending trendline, including a clear Double Top, which only strengthens the bearish narrative.
💎Current price of #ZECUSD is $536, sitting right above the ascending support. A clean breakdown below this support, especially with the 50 EMA now acting as resistance, would significantly increase the probability of deeper bearish continuation. A bearish retest from below would be the confirmation signal the market is waiting for.
💎If the breakdown plays out, the first target lies at the support zone around $411. But the real liquidity sits much lower, inside the strong demand Zone, where aggressive buyers could re-emerge. A sweep into that zone could fuel a powerful reaction… assuming sellers don’t maintain full control.
💎Bearish setup invalidation kicks in only if #ZEC reclaims the $724 strong resistance level. A breakout and hold above this zone would flip the entire structure and open the gates toward a bullish rally, potentially targeting much higher levels next.
Trade smart, Paradisers. This setup will reward only the disciplined.
MyCryptoParadise
iFeel the success🌴
BTC/USDT: Potential Uptrend and Buying OpportunityBitcoin is creating a buying opportunity as it continues to follow a clear uptrend channel. With support from macroeconomic factors and positive momentum from the cryptocurrency market, BTC/USDT has the potential to move upward strongly.
The chart shows that BTC is currently moving within an uptrend channel, supported by the EMA lines. The recovery from the recent bottom around 86,700 USD and the price moving closer to 91,000 USD indicates that the market is starting to regain upward momentum.
Looking at the current price levels, BTC is approaching an important resistance level at 95,500 USD. If this level is broken, the uptrend could extend, pushing the price to higher levels, potentially reaching 100,000 USD. However, if BTC fails to break through the 95,600 USD level and pulls back to test the 86,700 USD support, this would provide a good buying opportunity before continuing the uptrend.
In summary , BTC/USDT is currently on a strong uptrend, and the buying opportunity remains as the price adjusts back to key support levels. Watch the 86,700 USD level as an ideal entry point to take advantage of the upcoming strong rally.

ETHUSDT — Bearish Flow Targeting 2,956ETH is still trading below the key intraday resistance at 3032–3045, keeping the bearish structure intact.
As long as price fails to break and hold above this zone, downside pressure is expected to continue.
The current Fibonacci sequence supports a continuation lower, with price showing repeated rejections around the 0.333 / 0.236 levels.
This keeps the market biased toward the next liquidity pocket.
📉 Main bearish target: 2,956
This level aligns with the Fib 1.0 extension, making it the next high-probability destination if bearish momentum persists.
A break above 3045 would invalidate this scenario; otherwise, ETH remains on track toward 2,956.

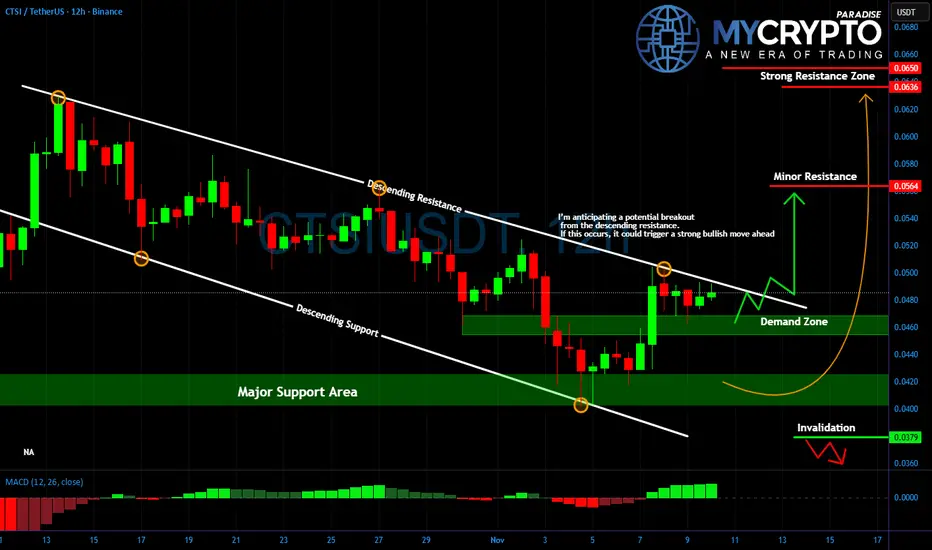
CTSI About to Explode or Fakeout Incoming?Yello Paradisers is CTSI finally ready to break out, or are we looking at another trap to wipe out emotional traders?
💎#CTSIUSDT has been moving inside a clean descending channel, respecting both support and resistance levels. The price recently bounced strongly from the key demand zone around $0.041 to $0.044, showing clear signs of accumulation. Now, price is approaching the descending resistance, where a confirmed breakout could change the game entirely.
💎A clean break and daily close above the $0.050 level would likely trigger bullish momentum, with short-term upside toward the 0.056 area. If this level gets cleared, the real target lies at 0.063 to 0.065, which marks a strong resistance zone and a likely exit area for smart money.
💎However, it's important to stay focused. Until the breakout is confirmed, this move remains unverified. Many traders get caught in fakeouts by rushing in too early. A move below $0.0379 would invalidate the bullish setup entirely, and at that point, the bias shifts back to the downside.
Discipline, patience, robust strategies, and trading tactics are the only ways you can make it long-term in this market.
MyCryptoParadise
iFeel the success🌴
SOL/USDT: Strong Uptrend – Short-Term Buy Opportunity!We are witnessing an excellent opportunity on the SOL/USDT chart, as Solana (SOL) continues to maintain a strong upward trend. In the context of a gradually stabilizing cryptocurrency market and positive news about Solana's ecosystem development, SOL is entering a significant price increase phase.
Currently, SOL/USDT is trading within an ascending channel and has broken out of the 140.00 support zone . The price is fluctuating around 143.66, close to the 140.00 support, which could see a slight pullback before continuing the upward momentum.
The next target for SOL/USDT in the short term is 155.00, where it might encounter some resistance. However, if the price maintains above 140.00, there is a high probability that SOL could continue its strong upward momentum towards 156.00 and even beyond.
Trading Strategy:
Buy SOL around the 140.00–143.00 range, with a short-term target of 155.00 and 156.00.
Set stop-loss if the price breaks below 139.00, as this is a crucial support level within the current uptrend channel.
In conclusion, SOL/USDT is maintaining a solid uptrend, and with positive signals from both technical indicators and fundamental factors, buying around the support zone is a reasonable strategy to capitalize on the upward movement.

BTCUSD: A fragile rebound, with risk of returning to the 84,000 After a fairly “tiring” week , Bitcoin has ticked up slightly at the start of the week, but the overall picture still leans clearly toward the bears . Outflows from U.S. spot Bitcoin ETFs have now extended into the fourth consecutive week , showing that institutional money is still cutting exposure. At the same time, the market is both hoping for a Fed rate cut in December (around 70% probability) and worrying because many Fed officials remain cautious. With no new bullish catalyst , the crypto market in general – and BTC in particular – remains under short-term downside pressure.
On the D1 timeframe, BTCUSD is holding a clear downtrend below the Ichimoku cloud . A descending trendline drawn from the previous highs continues to cap every rebound. Price is currently trading around 87,000 USD, after dropping to a recent low near 83,500 USD and then bouncing slightly. The scenario illustrated on the chart suggests BTC may range and consolidate before pushing up to retest the 96,700 USD area – a key confluence resistance where the descending trendline meets a horizontal supply zone.
If BTC reaches the 96,700 USD region but faces strong selling, the primary scenario is a new leg down back toward the 84,000 USD support zone. With ETF flows still negative and the Fed’s outlook still uncertain, every bounce into higher resistance levels currently looks more like a distribution opportunity than the start of a sustainable uptrend .

Is #HBAR Finally Ready to See a Massive Rebound or Not? Yello, Paradisers! Is this breakout from the falling wedge the beginning of a real trend reversal on #HBARUSDT, or not? Let’s break down #Hedera setup:
💎#HBAR is currently trading around $0.145, and after weeks of downtrend within a clearly defined falling wedge, we finally saw a breakout above descending resistance. This is the first bullish signal, but it’s not yet confirmed.
💎For real confirmation, we need to see the 50EMA hold as support in the coming candles. If that happens, the probability of a sustained bullish move increases dramatically.
💎On the upside, the immediate target is the Moderate Resistance at $0.177. A break above that zone, ideally on strong volume, would open the path for a larger move toward the Strong Resistance level at $0.209, and that’s where bulls will likely take significant profits.
💎However, if #HBARUSD fails to hold above the support zone near $0.134, and especially if price dips back into the wedge structure, we’ll likely revisit the Strong Demand Zone at $0.110. Below that, the entire bullish setup gets invalidated, and we’ll expect a retest of the recent lows, with increased downside pressure from short setups forming below.
Strive for consistency, wait for clear confirmations, and remember that discipline always beats chasing quick profits.
MyCryptoParadise
iFeel the success🌴

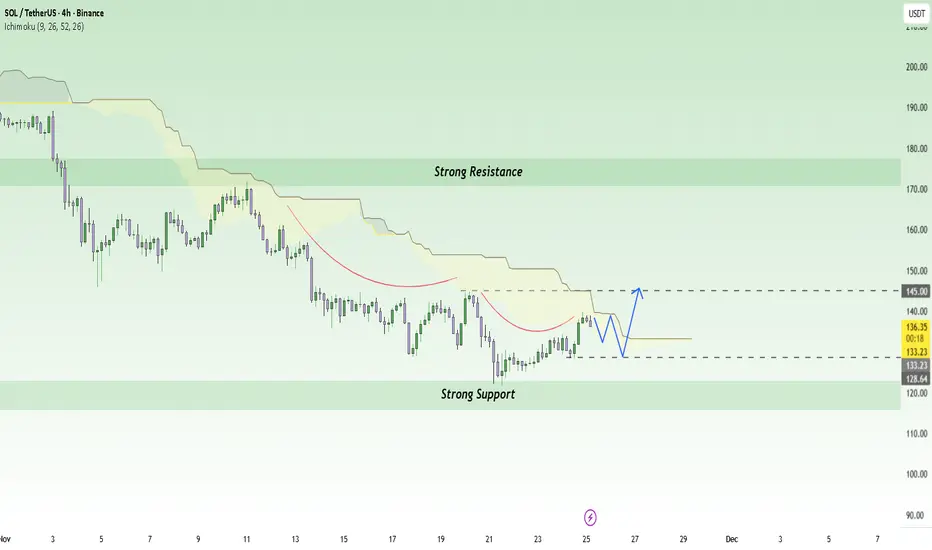
SOL/USDT: Growth Fueled by Inflows and Network ExpansionNews: The Solana spot ETF in the U.S. has seen a significant inflow of capital , with over $476 million USD coming in over 17 consecutive days. At the same time, the Solana network has reported strong revenue growth , reaching around $2.85 billion USD . These factors have bolstered investor confidence in Solana, creating a favorable environment for the upward trend of SOL/USDT.
Chart: On the H4 chart, SOL/USDT is currently trading within a strong uptrend channel , supported by the Ichimoku cloud at 133.23 USD. The price is in the support zone around 128 USD, and there is potential for a strong rebound if it continues to hold above this level. If SOL/USDT maintains this trend, the next target could be 145 USD, where there is strong resistance in the short term.
Outlook: With positive macro factors and a clear technical structure , SOL/USDT could continue its strong uptrend, aiming for the 145 USD resistance level in the near future, as long as the price stays above 128 USD.
DOGE Ready to Break $0.16000 – Strong Bullish Momentum Ahead!Currently, DOGE is fluctuating within a clear accumulation structure with strong support at $0.14700 and resistance near $0.16000. After testing this support zone, the price could break above the resistance, signaling the potential for a strong continuation of the bullish trend.
Reasons for the increase:
- ETF Hype & Institutional Confidence: The listing of the DOGE spot ETF on the US exchange has drawn attention from both institutional and retail investors. This could lead to a large influx of capital into DOGE, creating strong buying pressure.
- Technical Accumulation & Bullish Setup: The current price structure indicates a strong breakout potential if DOGE surpasses $0.154, with solid support levels below, such as $0.14700, which reinforces the likelihood of continued upward momentum.
- FOMO Opportunity & Market Sentiment: As a meme-coin, Dogecoin is highly sensitive to news and market "hype." When positive factors such as ETF announcements or favorable news arise, DOGE is likely to create a strong surge due to FOMO (Fear of Missing Out) sentiment.
Next scenario:
If DOGE surpasses $0.15400, it is likely to continue the bullish rally, targeting $0.16000, and possibly extend towards $0.17000. Both market factors and technical analysis suggest strong potential for further upward movement in the near term.
In summary: DOGE currently has strong upside potential thanks to ETF support and solid technical accumulation. If the market maintains a positive sentiment and DOGE breaks resistance, the bullish trend will continue.

TAO — Bearish Continuation Setup📉In my view, TAO continues to show signs of wanting to move lower. The market structure still looks bearish, and sellers remain in control.
🎯 Target 1: 274
🎯 Target 2: 268
❌ Idea cancel zone: 285
❓I also think we may see TAO at 260, but this level is still uncertain for me.
🔔So stay tuned — I’ll post an update once TAO gets closer to 268

USDT DOMINANCE Roadmap (1D)From the point where the green arrow is placed on the chart, it seems that a large-degree bullish pattern has started. Waves A and B of this pattern are complete, and we are now in wave C.
Wave A was a diametric, and wave B was a triangle. We are currently in wave a of C. After wave b of C completes, caution is needed because the movement of c of C will begin.
From the green zone, Tether dominance may turn bullish again toward the two red-line targets.
We will try to update this analysis periodically.
For risk management, please don't forget stop loss and capital management
When we reach the first target, save some profit and then change the stop to entry
Comment if you have any questions
Thank You

BTCUSDT – Blue Box Reversal IncomingHi fellow traders,
On the 1D BTCUSDT chart, I am applying Elliott Wave principles to outline a potential long setup. Price has tapped into the blue box after completing a ZIGZAG correction, and this region may provide the foundation for the next impulsive leg within the higher-degree structure.
I am entering at the current price, with a Stop Loss at 73,900.00. My Take Profit is set at 132,366.25, based on the projected continuation of the larger impulsive count.
If price breaks below the structural low around the stop level, this trade is no longer valid.
Good luck and trade safe!
