Give me 3 reasons not to be bullish on SolanaSolana’s Total Value Locked (TVL) expanded from $396M on Dec 26, 2022 to $8.69B by July 4, 2025, a 2,094% increase (~22x growth) across 80 weeks . This translates to a weekly geometric growth multiplier of ~1.089, or an 8.9% compound weekly rate .
This rapid TVL expansion reflects capital inflows, increased DeFi participation, and regained trust in Solana’s infrastructure following the FTX collapse.
————————————————
LST Ecosystem Expansion :
Liquid staking derivatives (JitoSOL, mSOL) accounted for a significant share of inflows, as yield-seeking capital returned with Ethereum-style primitives on Solana.
MEV Monetization & Compression Tech :
Validator-side MEV solutions and data compression (via Firedancer and ZK-state) improved scalability and trust in Solana’s low-latency environment.
Resurgence of DeFi-NFT Hybrids :
Protocols like Tensor and HadeSwap blurred lines between DeFi and NFTs, generating sticky liquidity and reinforcing Solana’s unique narrative.
Restored Institutional Confidence :
Post-FTX reforms and a more diversified validator ecosystem helped re-attract institutional capital, supported by enhanced wallet infra (e.g., Backpack, Phantom) and custodianship.
This pattern, paired with the geometric growth trend, suggests Solana’s DeFi ecosystem is entering a new structural bull phase, underpinned by both technical confirmation and fundamental evolution.
Anyways, let me know in the comments 3 reasons not to be bullish on Solana as we speak.
(PS: QC-resistant issues don’t apply only for Solana but for all major crypto assets!)
Cup And Handle

Is the hat back on?Bullish scenerio for BINANCE:WIFUSDT
Recently we can see:
1. Bouncing off GP (0.5)
2. Retested local TL
3. Retested local support (S/R)
4. Broke 50 RSI
Reaching 1.37 resistance would print a cup and handle pattern…

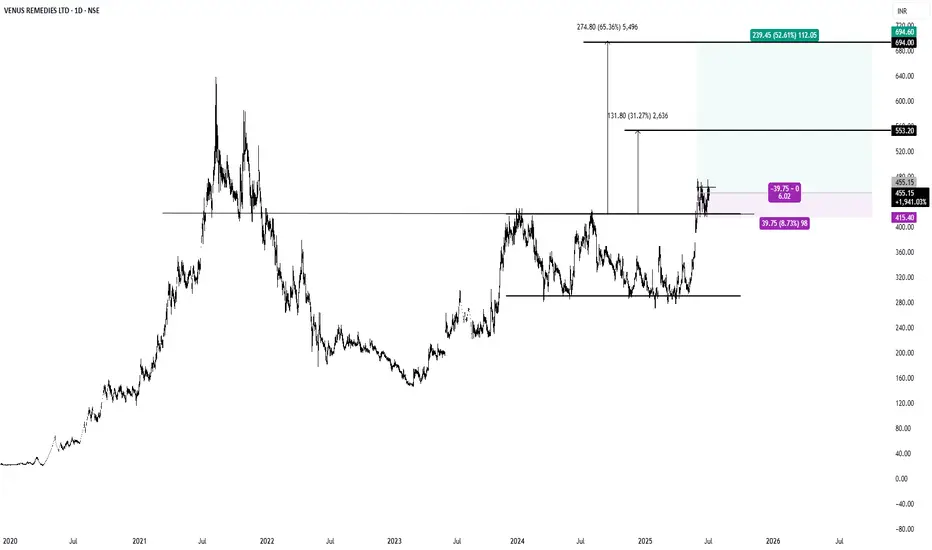
$VENUSREM #INDIA #NSE1. Cup and Handle Break Out.
2. Parallel Channel Break Out.
3.R:R >6 , Tight Stop Loss.
THELEELATHELEELA is giving resistance + cup and handle breakout above 414 level. Market participation has also increased in recent sessions. So if it sustains and closes above 414 then it looks very attractive and may start new momentum rally. 398 seems very good support. On upper side we may see momentum of 10-12%. Make sure that it sustain and closes above 414!

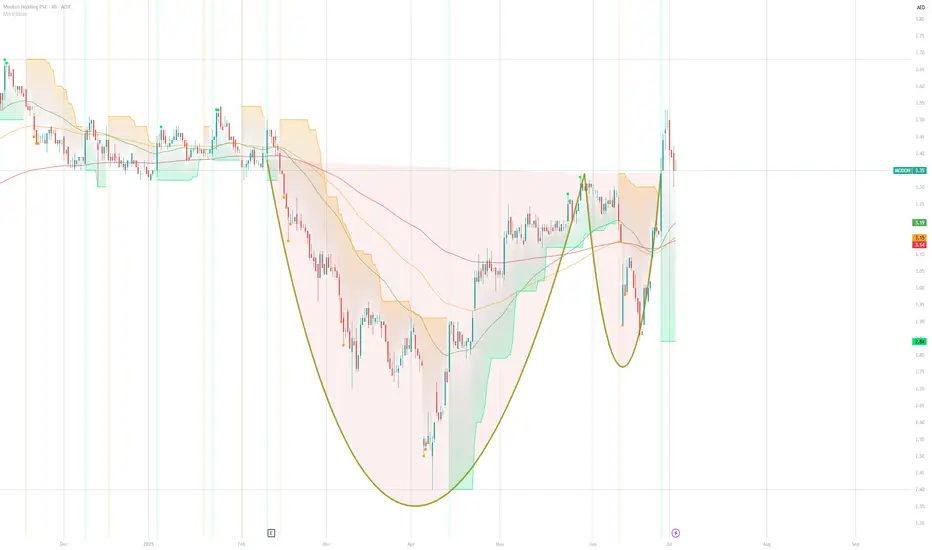
Spotting the Cup: A Technical Dive into Modon Holdings PSCThis chart illustrates a potentially valid Cup with Handle pattern on Modon Holdings PSC's daily chart. The cup formation appears well-rounded, with a reasonable depth that aligns with standard pattern criteria. The handle is correctly positioned following the cup and slopes slightly downward, which is acceptable and typical.
However, for a more reliable confirmation, it's important to assess two key factors:
1. Volume Dynamics: Ideally, volume should contract during the handle formation and expand significantly on the breakout. This confirmation is not visible from the chart provided and should be verified.
2. Pattern Duration: The pattern seems to have developed over a relatively short period. The Cup with Handle is generally more reliable when it forms over several weeks to a few months on a daily chart.
Overall, the drawing is structurally accurate, but traders should confirm volume behavior and ensure sufficient pattern maturity before acting on this setup. Constructive feedback is welcomed if others spot additional nuances.
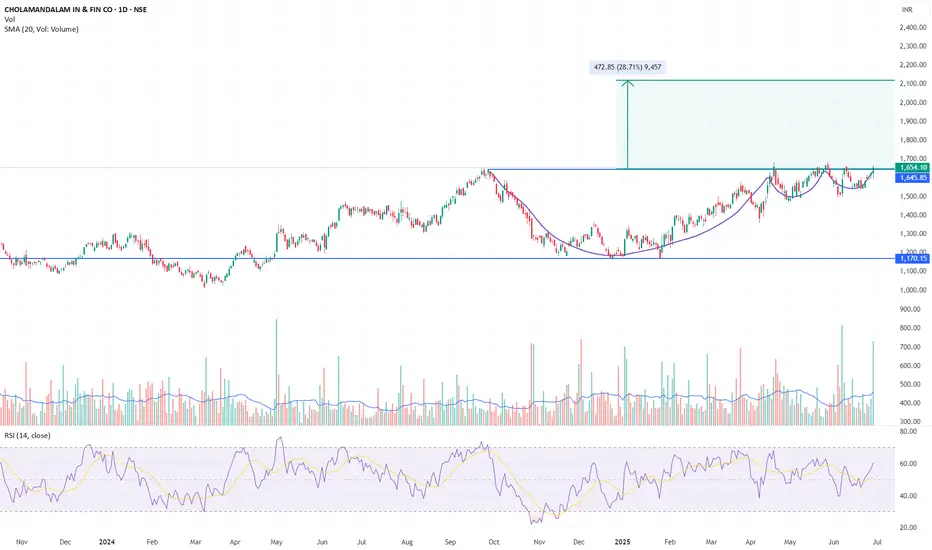
CHOLAFIN – Cup & Handle Breakout | Target ₹2120 (28% Upside)CHOLAMANDALAM FIN has confirmed a classic Cup and Handle breakout after 9 months of base formation. The neckline at ₹1645.85 has been cleanly crossed with strong follow-through and high volume.
Pattern Structure:
Cup Base: Formed between Sep–Dec 2024, bottomed near ₹1170
Handle: Shallow, corrective structure in May 2025 — ideal proportion
Breakout Zone: ₹1645.85 (horizontal resistance since Sep 2023)
Breakout Candle: Strong close at ₹1654.10 with high conviction volume (5.84M vs 2.3M avg)
Trade Setup:
Entry: Confirmed on breakout close above ₹1645
Target: ₹1645.85 + ₹472.85 = ₹2120
Stop Loss: ₹1545 (below handle low)
Risk-Reward: ~1:2.5 for positional traders
Indicators:
Volume: Significant spike, validating breakout
RSI: 60.2 and rising — bullish, not overbought
Moving Averages: Price well above 20 SMA, momentum aligned
Bias & Strategy:
Structure favours long-only positioning. Ideal for trend followers. Breakout is supported by volume and proper consolidation. Short-term pullbacks toward ₹1645–₹1620 can offer re-entry. Avoid shorting — this is the start of a fresh leg higher.
Disclaimer:
This analysis is shared strictly for educational and informational purposes. It does not constitute investment advice, nor is it a recommendation to buy, sell, or hold any securities. You are advised to perform their own due diligence, assess risk tolerance, and consult a registered financial advisor before making any investment decisions.
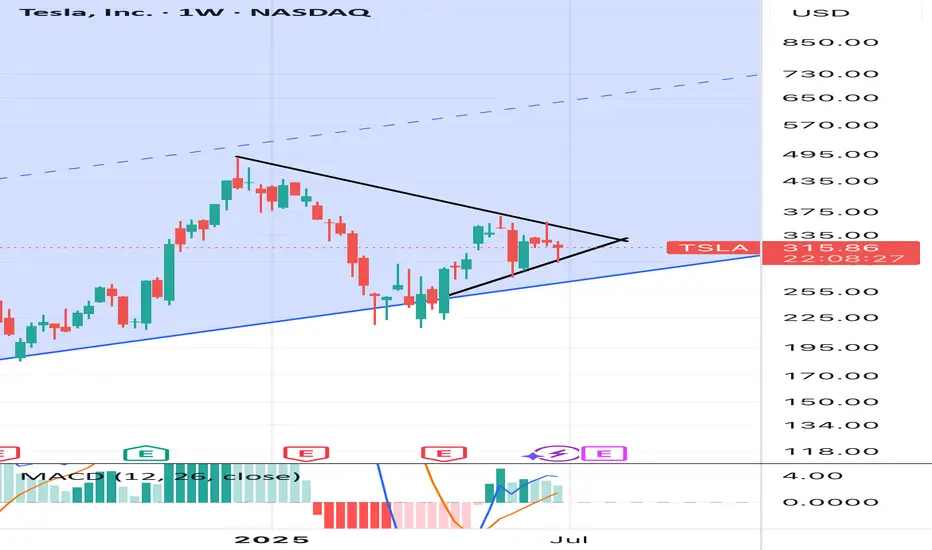
Big fat cup & handle on the weekly My instinct tells me today was the last dip buying opportunity before parabolic move. The daily chart is showing wedge consolidation and big institutions are buying. Elon just needs to focus
Gold going down Gold just made cup pattern I believe it’s clear sign for short and deep short let’s see

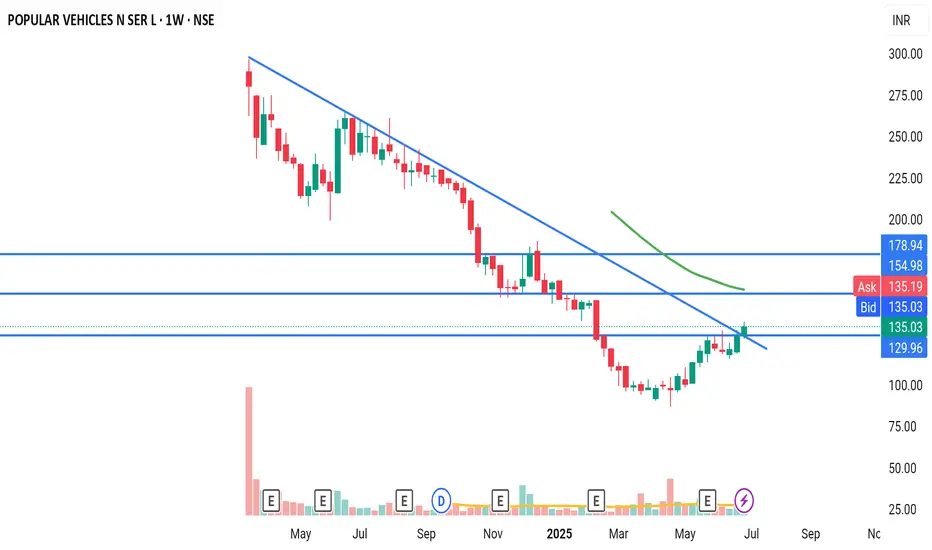
PVSLStrong upmove expected from CMP. Breakout of Cup and Handle pattern in daily timeframe, crossed trendline in daily and weekly timeframe.
Swing Trade Plan: MAN Industries (NSE: MANINDS)
A classic Cup & Handle Pattern bullish continuation pattern showing accumulation and a breakout from resistance. Indicates renewed buying interest.
Breakout supported by rising volume, confirming buyer strength.
Price holding above 20 and 50 EMA, indicating bullish trend continuation.
Company has consistent order inflows and is part of infra/pipe supply chain, aligning with current government spending themes.
This is my personal swing trade plan based on price action and fundamental analysis. Please do your own research before taking any investment decision.

VLAD impaling WALL ST!I believe Robinhood will achieve over One Trillion dollars in assets in very short order.
Giant Cup and Handle is your technical setup.
(I have covered hood at the low)

XAUUSD 15min – Bearish Setup | Short Trade Plan Below 3328Price action on Gold (XAUUSD) is showing signs of exhaustion near the 3,328 resistance zone, where we anticipate potential bearish rejection. A short opportunity may unfold once confirmation occurs below the key structural level of 3316.
Sell Trade Setup:
🔹 Primary Entry (Sell Entry 1):
📍 Zone: Around 3,328.29
📌 Reaction expected near major supply & resistance zone.
🔹 Confirmation Entry (Sell Entry 2):
📍 Below 3,316
📌 Break below structure may trigger bearish momentum.
Targets:
🎯 TP 1: 3,296.97 (Initial reaction zone)
🎯 TP 2: 3,276.64 (Mid support/EMA cross zone)
🎯 TP 3: 3,259.88 (Key structural support)
🎯 Extended TP:
3,243.94 (Re-entry confirmation level)
3,225.53 (Prior base structure)
3,202.45 (Final target if strong momentum follows)
3,159.31 (Ultimate low if sellers dominate trend)
Re-Entry Plan:
🔄 If price retraces after TP 3, watch for rejection at 3,243.94 to re-enter short toward the next levels.
Confluence Factors:
✔ 45° TPC angle supports bearish path
✔ Structure break expected below 3316
✔ EMA resistance and trendline rejection from upper zone
✔ Volatility cluster observed near 3,328 – ideal for trap setup
Bias:
Bearish below 3,316 – Expecting a downward continuation if structure confirms breakdown.
Author:
📅 1 July 2025
📊 Chart: XAUUSD – 15min
🧠 Shared by: @THEPATELCRYPTO

Can Penguins Fly?Pudgy Penguins #Pengu is up nicely already 3.6X from it's april low.
And is sitting nicely outside the top 100 CMC list and is the 8th biggest Memecoin by marketcap.
It appears it is on the cusp of a cup and handle breakout and projects to a very high flying 5 cent log projection.
(#Crypto's are highly speculative and can go down -99%)

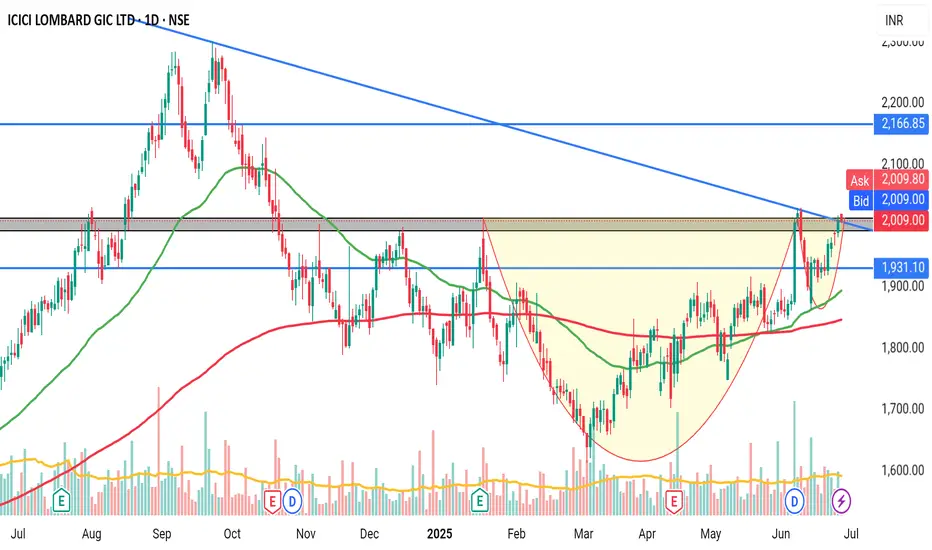
ICICI LOMBARDOn the verge of giving breakout of cup and handle pattern. If volume supports the breakout, it will shoot up in no time.
In the 2030's The Nasdaq 100 to 2X the Dow Jones.#CupandHandle don't fight the trend.
Technology vs Industrials.
AI
Robotics
Space Economy
Biotech
Artificial Super Intelligence to power GDP to insane levels.

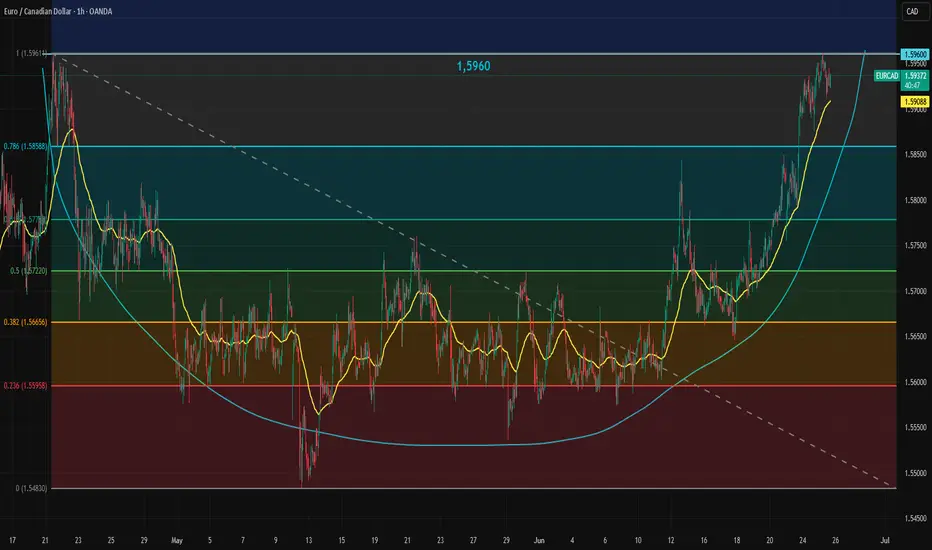
EURCAD Forms Cup FormationThe EURCAD rally, driven by a strong euro and a weak Canadian dollar, has created an impressive chart setup. A cup formation has developed just below the 1.5960 resistance level. Whether this pattern will be completed with a handle remains unclear at this stage.
If a handle forms, the 78.6% retracement level could serve as a reasonable downside target. In the short term, the 50-hour EMA is supporting the trend and can be watched as key support.
If EURCAD breaks above 1.5960 and confirms the cup formation, the medium-term target for the pattern could reach as high as 1.6440.
EURUSD: Pullback From Resistance Confirmed📉 The EURUSD could retreat from the highlighted resistance today.
I've identified a cup and handle pattern following a test of significant intraday resistance and a breach of its neckline, accompanied by strong bearish momentum.
Target - 1.1575.

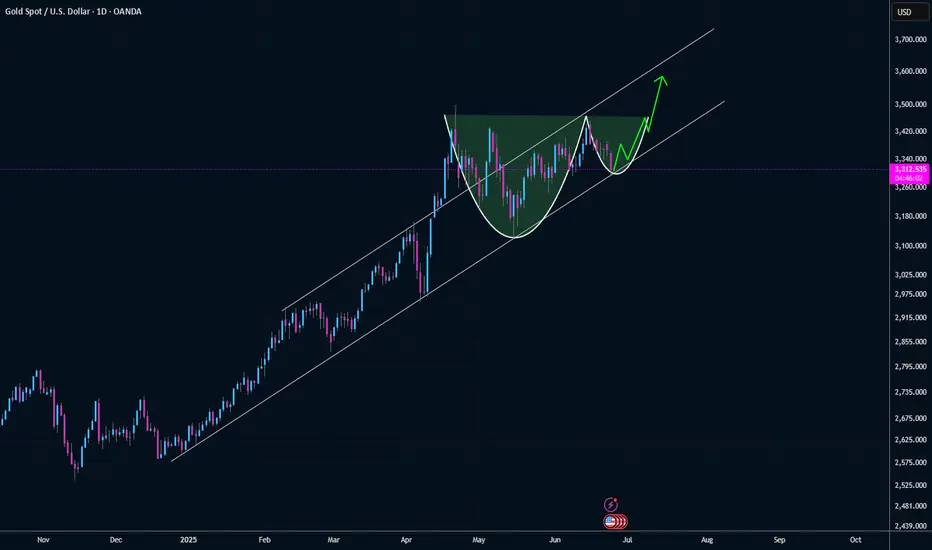
Gold Trend Still In TactPotential cup and handle formation as it the trend works into the bottom of the handle. Still think this comes back into play as the "big beautiful bill" comes back into focus and national debt is a topic of concern.
CADCHF: Confirmed Bearish Trap?! 🇨🇦🇨🇭
There is a high chance that CADCHF will bounce from the underlined
blue support.
As a confirmation, I see a cup & handle pattern on an hourly time frame
that compose a bearish trap.
Goal - 0.5926
❤️Please, support my work with like, thank you!❤️
I am part of Trade Nation's Influencer program and receive a monthly fee for using their TradingView charts in my analysis.

HIMS 1D — This pattern didn’t cook for nothingOn the daily chart of Hims & Hers Health, we’re looking at a textbook cup with handle formation — not just a pattern, but a structure backed by time, volume, and classic price behavior. The base of the cup formed steadily from February to May 2025, and as soon as the curve was complete, price transitioned into a tight consolidation — the "handle" that often masks real accumulation.
Right now, price is testing the resistance area. And it’s not just floating up there — it’s coming in hot: price has already broken through EMA 20/50/100/200 and SMA 50/200. That’s a full stack flip. This isn’t sideways noise — it’s a structural shift in control.
Volume is starting to build as price rises, confirming that demand is real and institutional positioning likely active. We’re watching a breakout zone above the handle — and when that breaks, the structure unlocks with a clear target: $107.25, roughly a 2x move from current levels.
This setup isn’t noise. It’s a long-cooked formation that’s now about to boil over. If the handle holds and price breaks through — the rest is just follow-through.

SOARING 20's are you ready for the Blowoff of the century#SPX v Currency in circulation
#Cup&Handle
1929 Echo bubble
AI will increase earnings and GDP
as ASI enters the workplace and Robotics grow us out of Debt
GDP = Number of people * Productivity
Now add an autonomous workforce to this.

SILVER (XAGUSD): Waiting For BreakoutIt appears that ⚠️SILVER is gearing up for a bullish trend.
Analyzing the 4H time frame, I spotted a falling wedge pattern and a confirmed breakout above its upper boundary.
The final hurdle for buyers is the 36.11 - 36.17 neckline of a cup and handle pattern.
If the bulls manage to break and close above this level, it will serve as a significant bullish signal, likely leading to a continuation towards at least 37.00.

QUBT - 2 Formations are in considerationHello Everyone,
Happy Sunday to all.
Today i would like to have a look another Quantum Computing stock which is QUBT.
For the time being price is going up and down between 18 to 21.
I am considering 2 formation in daily chart.
First one is Rounding buttom which is marked as Green:
Target : 40 - 42
If it can break 25.50 and stay for 3 days above it then we can consider this formation and reach to 40 $ level.
Second one is Cup and Handle which is marked as Orange:
First Target : 14.80 - 15.00
Then : 20-21
Then : 30
Final target is : 40.00
All in all i see a good opportunity on QUBT and within a year there is a possibility to hit 40. (Maybe less then a year)
This is just my thinking and it is not invesment suggestion , please do not make any decision with my anaylsis.
Have a lovely Sunday to all.
