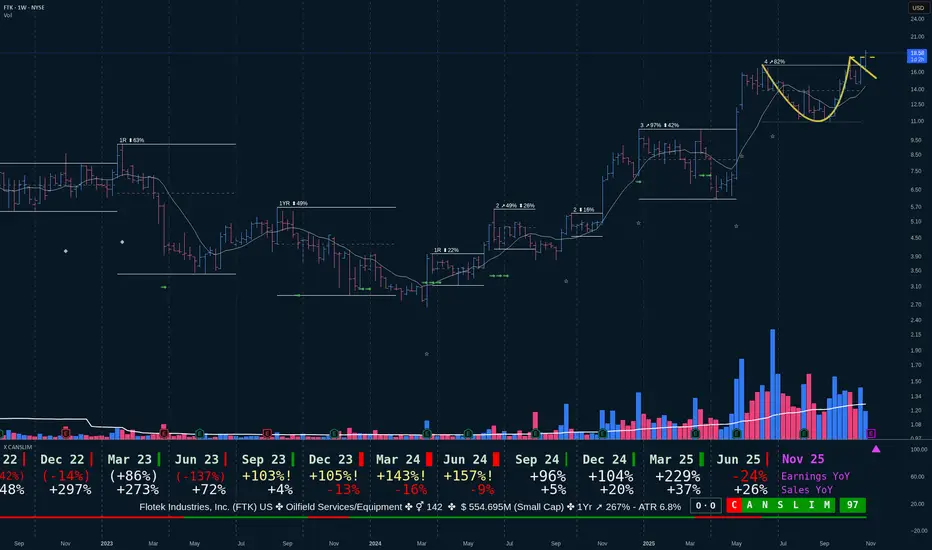
FTK is clearing a Cup with Handle baseKey points at the time of writing.
✣ Market
Cycle : Bull market cycle since June 2025
Direction: Up 100%
✣ Fundamentals.
Earnings somewhat mixed with a tendency to improve this year.
Institutional ratio is of 3.8 Buyers for 1 seller TTM with a ownership of 10.9%
✣ Technicals.
Clearing a Cup with Handle pattern.
Stock at base 4 is recent rally
TTM Performance is xx%
✣ Events / News
Earnings due next week !
Despite not being CANSLIM qualified it's clearing current base 4 ahead of earnings next week!
I expect a rise in price if there is some follow through in the coming days and most important if next week earning confirm the recent trend.
Cup And Handle
DOGE's situation+next targets and expected movementsNo matter how bad Dogecoin looks on lower timeframes, the higher timeframes tell a different story—one of strength and potential. As you can see, the weekly chart has formed a large Cup and Handle pattern. If this pattern breaks out, the price could easily surge above $1. So be patient and stay alert, because you don’t want to miss the next bull run.
Unfortunately, the harsh truth is that 99% of you *will* miss it.

Cup and Handle pattern about to playout?A very possible scenario that could playout. All we need is some good news in this world: end of FED QT, more rate cuts and of course the tariff deal with China we have all been waiting for.
Important levels to look for for a breakout in this case are highlighted with green and of course the fib retracement drawn next to it.
If both breakouts are confirmed, then I think that $328 could become our new ATH in Q4 this year!
CSGS - 8 months CUP & HANDLE══════════════════════════════
Since 2014, my markets approach is to spot
trading opportunities based solely on the
development of
CLASSICAL CHART PATTERNS
🤝Let’s learn and grow together 🤝
══════════════════════════════
Hello Traders ✌
After a careful consideration I came to the conclusion that:
- it is crucial to be quick in alerting you with all the opportunities I spot and often I don't post a good pattern because I don't have the opportunity to write down a proper didactical comment;
- since my parameters to identify a Classical Pattern and its scenario are very well defined, many of my comments were and would be redundant;
- the information that I think is important is very simple and can easily be understood just by looking at charts;
For these reasons and hoping to give you a better help, I decided to write comments only when something very specific or interesting shows up, otherwise all the information is shown on the chart.
Thank you all for your support
🔎🔎🔎 ALWAYS REMEMBER
"A pattern IS NOT a Pattern until the breakout is completed. Before that moment it is just a bunch of colorful candlesticks on a chart of your watchlist"
═════════════════════════════
⚠ DISCLAIMER ⚠
The content is The Art Of Charting's personal opinion and it is posted purely for educational purpose and therefore it must not be taken as a direct or indirect investing recommendations or advices. Any action taken upon these information is at your own risk.

EURGBP - 7 months CUP & HANDLE══════════════════════════════
Since 2014, my markets approach is to spot
trading opportunities based solely on the
development of
CLASSICAL CHART PATTERNS
🤝Let’s learn and grow together 🤝
══════════════════════════════
Hello Traders ✌
After a careful consideration I came to the conclusion that:
- it is crucial to be quick in alerting you with all the opportunities I spot and often I don't post a good pattern because I don't have the opportunity to write down a proper didactical comment;
- since my parameters to identify a Classical Pattern and its scenario are very well defined, many of my comments were and would be redundant;
- the information that I think is important is very simple and can easily be understood just by looking at charts;
For these reasons and hoping to give you a better help, I decided to write comments only when something very specific or interesting shows up, otherwise all the information is shown on the chart.
Thank you all for your support
🔎🔎🔎 ALWAYS REMEMBER
"A pattern IS NOT a Pattern until the breakout is completed. Before that moment it is just a bunch of colorful candlesticks on a chart of your watchlist"
═════════════════════════════
⚠ DISCLAIMER ⚠
The content is The Art Of Charting's personal opinion and it is posted purely for educational purpose and therefore it must not be taken as a direct or indirect investing recommendations or advices. Any action taken upon these information is at your own risk.

$PUMP 4HNYSE:PUMP 4H Chart
A clear Cup & Handle breakout formation with bullish momentum building above the breakout point.
As long as price holds above the FVG (1h) and previous resistance turned support, continuation towards T1–T3 remains likely.
Structure looks healthy for a potential leg up.
#PUMP #Crypto #TradingView #YodaXCalls

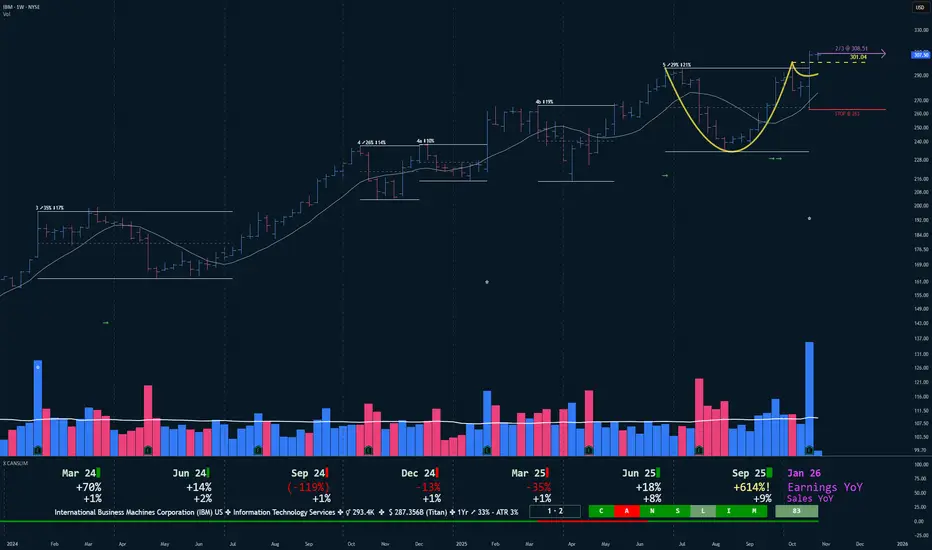
IBM just cleared a daily Cup with Handle on strong earningsKey points at the time of writing.
✣ New bull market cycle running since June 2025
✣ Market Direction is Up 90%
✣ Stock Fundamentals have just turned good.
✣ Institutional support with a buy/sell ratio of 1.3 and a ownership of 59%
✣ TTM Performance is 33%
I expect a more important upside move if we get some follow-through in the comming weeks.
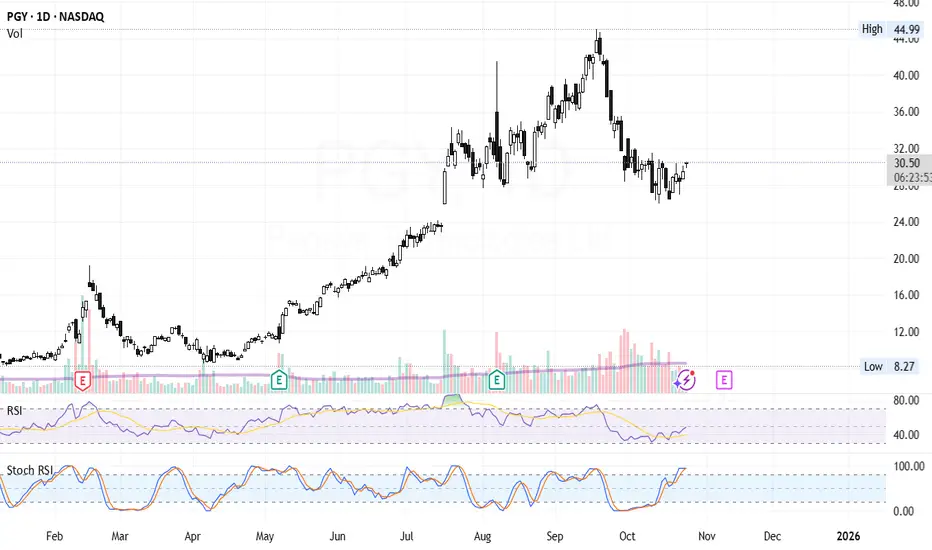
PGY on way to create a Cup and Handleafter cooling off the recent rally, PGY is now creating a really well shaped rounded bottom. an increase in price would indicate the stock shaping in to a cup and handle setup.
BNB 1H ChartCRYPTOCAP:BNB 1H Chart
Forming a Cup & Handle pattern.
Price holding above the FVG 1H zone, watching for a breakout above ~$1.1k
Next target: $1,190 (+7–8%) if momentum continues. 🚀

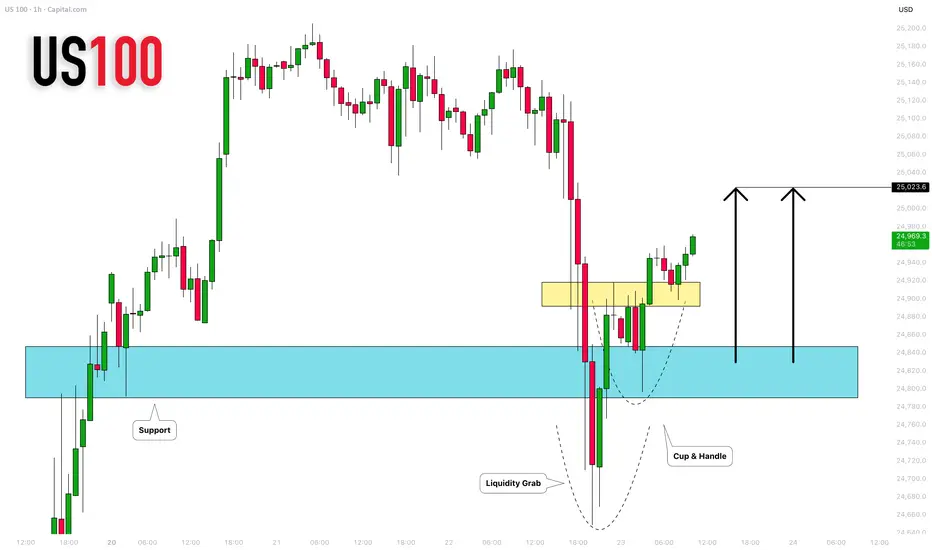
NASDAQ INDEX (US100): Bullish Move After the Trap
I see a confirmed liquidity grab below a key horizontal support
on an hourly time frame.
A formation of a cup & handle pattern and a breakout of its neckline
afterward suggest a strong buygin interest.
The market will rise more and reach at least 25023 level.
❤️Please, support my work with like, thank you!❤️
I am part of Trade Nation's Influencer program and receive a monthly fee for using their TradingView charts in my analysis.
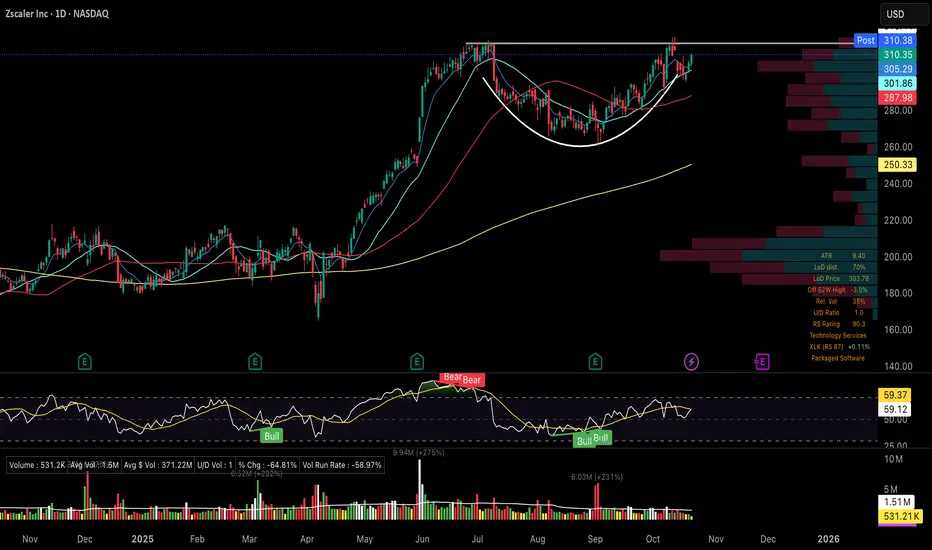
Cup and handle at ATHHere it is, not seeing a lot of volume though, waiting for the break around $317 confirmed with volume.
NB (Possible Cup & Handle Play)I like NB at its price for its market.
However I do feel cautious of how hard its spiked recently... so I zoomed out
And why dont you look at that, we broke a swing low pattern and then formed a nice cup.
With a handle and a breakout of the handle, we can look to aim for a new local high.
This is now on my watch list and hoping to come down a bit. I'll draw out channels when I see that start to happen. Once the channel breaks is when we start raising our stop losses.
But until we draw out the handle, I am not bought in for a play as of yet.
Just want to put this out there on peoples radar


SILVER (XAG/USD): Trend-Following Signal📈SILVER experienced a notable pullback on Friday, with the price subsequently retracing to a critical intraday support level.
Analyzing the hourly chart, I spotted the formation of a cup and handle pattern, followed by a confirmed breakout above its neckline.
Based on this analysis, there is a strong likelihood of further upward movement, potentially reaching a target of 53.31.

USD/CAD: Bearish Reversal Confirmed!?The 📉USDCAD pair has broken and closed below a significant intraday horizontal support level.
The blue area, which is underlined, is also the neckline of a cup and handle pattern.
This violation suggests the potential for a continued downward movement.
The subsequent support level is anticipated to be at 1.3985.

We could soon be talking again about Palantir...Ten weeks of consolidation could end by a Cup with Handle breakout... or not.
Key points at the time of writing.
✣ New bull market cycle running since June 2025
✣ Market Direction is Up 90%
✣ Stock Fundamentals are good with multi-year growth except in December 2024
✣ Earnings acceleration in last 2 quarters.
✣ Strong Institutional Interest with 2200 Buyers vs 1120 sellers TTM and a ownership of 45%
✣ Stock at base 5 is a red flag !
✣ TTM Performance is 310%
✣ Earnings due in 2 weeks !
If the pattern is broken to the upside, we could see a nice rise in the stock price...

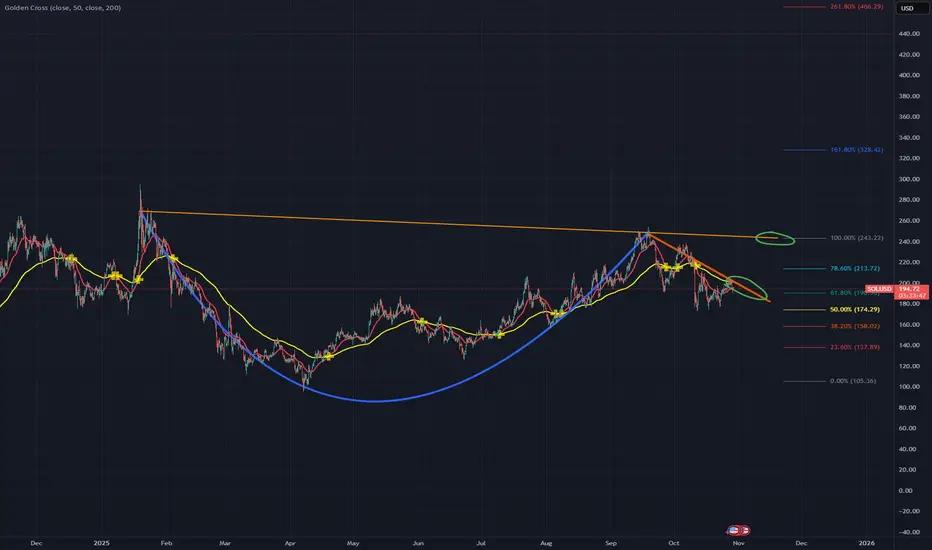
That's exactly what happened.If we measure the percentage from the bottom of the cup to the rim, we get ~1200%.
We now plot the same value from the rim line to get an idea of the possible movement.
You might say that at this price, silver would be disproportionately expensive relative to gold.
Take a look at 1980 (the year when this “cup with a handle” began to form).
Silver was worth 49% of the total capitalization of gold.

GOLD (XAUUSD): Bullish Market Opening?!
We got a nice pullback on Gold on Friday
and the price nicely retraced to a key intraday support.
Analysing the market reaction to that, I spotted a cup & handle pattern
and a confirmed violation of its neckline.
With a high probability, the market will rise after the opening.
The price will reach at least 4272 intraday resistance.
❤️Please, support my work with like, thank you!❤️
I am part of Trade Nation's Influencer program and receive a monthly fee for using their TradingView charts in my analysis.

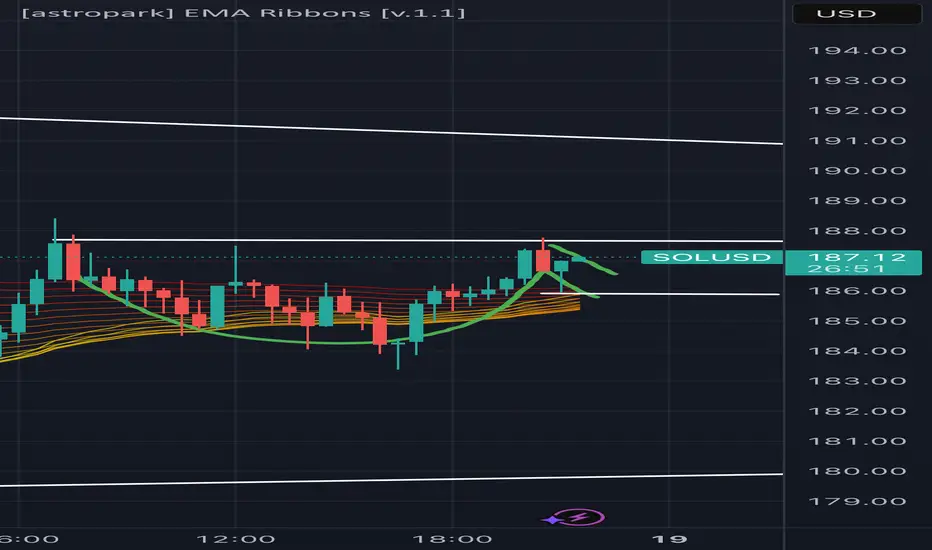
Cup & handle pattern: let’s go!Solana is realing going strong under a bearish BTCUSD. I think this cup and handle pattern will play out well.
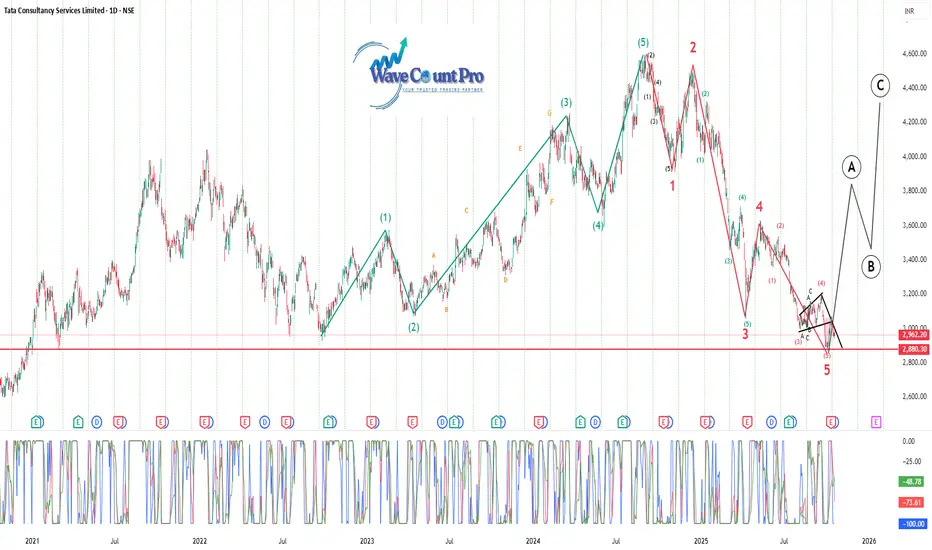
TCS Trend Reversal ??🔹 Wave Structure Overview
The chart clearly maps a complete 5-wave impulse uptrend (green count) followed by a 5-wave corrective decline (red count).
The current position indicates that Wave 5 of the corrective phase has just completed — signaling a possible end of the downtrend and setup for a bullish reversal.
🔹 Key Observations
Support Zone:
Strong horizontal support lies between ₹2,880–₹2,950, previously tested multiple times since 2021.
Price is currently hovering at this zone, showing signs of consolidation and potential reversal.
Wave Count Analysis:
The correction from the top (~₹4,600) unfolded in a clear 5-wave structure (1–2–3–4–5).
Subwave (5) appears to have terminated near the major support — a typical ending point for an Elliott Wave correction.
Pattern Recognition:
A falling wedge structure can be observed near the Wave 5 termination, which often precedes a bullish breakout.
The oscillator at the bottom also indicates oversold levels, reinforcing the likelihood of a rebound.
🔹 Projected Path (Next Phase)
The chart projects a corrective rally (A–B–C) following the completed 5-wave decline:
Wave A: Initial sharp rebound possibly toward ₹3,600–₹3,700.
Wave B: Pullback to retest lower supports near ₹3,200–₹3,300.
Wave C: Final leg up toward ₹4,200–₹4,400 range.
This A–B–C pattern would represent a corrective recovery phase before the next larger structure develops.
🔹 Sentiment & Outlook
Aspect View
Current Trend Bearish cycle likely completed
Immediate Bias Bullish rebound expected
Support Zone ₹2,880–₹2,950
Upside Targets ₹3,700 (A), ₹4,400 (C)
Invalidation Level Breakdown below ₹2,880
Momentum Oversold, positive divergence forming
🔹 Conclusion
TCS appears to have completed a major correction and is positioned for a medium-term trend reversal.
Holding above ₹2,880 will confirm strength, potentially leading to an A–B–C recovery toward ₹4,400 levels.
Momentum indicators and wave structure both support the beginning of a bullish phase after a prolonged decline.
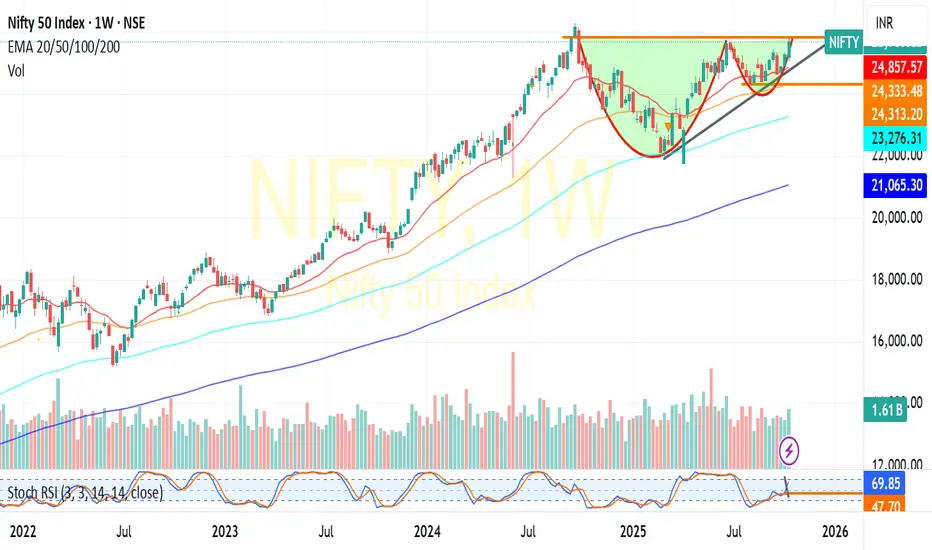
NIFTY:Cup&Handle Break Out-Bull RunNIFTY : Trading at 25700+ Levels.
Trading above all its critical moving averages even in weekly charts(20/50/100/200) showing the momentum
Has formed Cup&Handle formation in weekly chart indicating a possible upside of another 800-1000 Points .Daily chart also confirms the momentum by formation of Inverted Head &shhoulder pattern.
Seems any reasonable dip is likely to be bought .23400 shall be considered as the major support point for any trend reversal.(For educational purpose only)
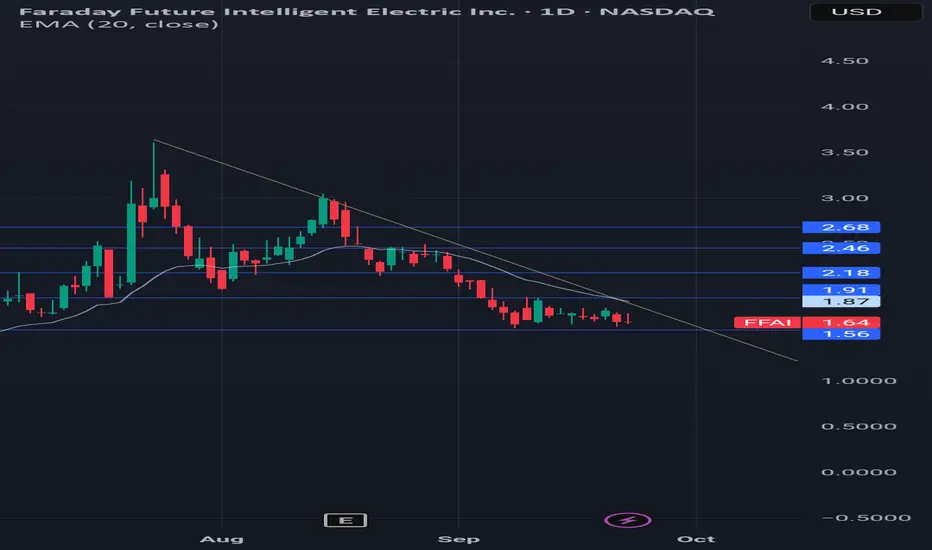
Cup and Handle According to Google AI, a textbook cup and handle typically has a pull back (the handle part) that ranges from 33% to 50% of the cup range (bottom of cup to beginning of handle).
Currently this is sitting at roughly 40% pull back and showing signs of support.
I'm looking for price to establish a consolidation range somewhere close to where we are now, and possibly start pushing over the 20 ema.
Next update will be a buy signal, with any luck.
Good luck 👍
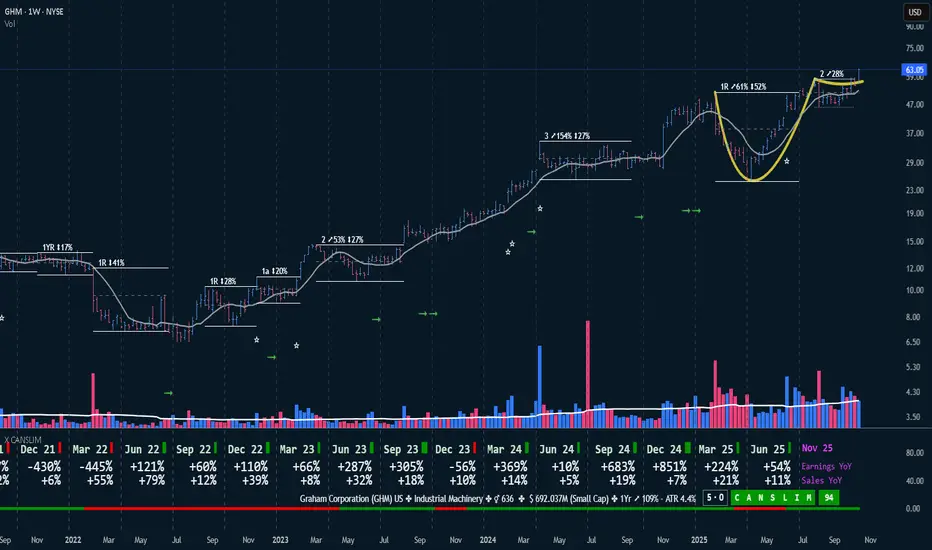
Graham Corp. (GHM) - Would you like some more Cup with Handle ?Key points at the time of writing.
✣ Young bull market cycle running since June 2025
✣ Market Direction is Up 90%
✣ Stock Fundamentals are ALL good showing 5 consecutive quarters of growth.
✣ Institutional Interest, 81 Buyers vs 57 sellers TTM with a ownership of 69%
✣ Stock technically clearing base 2.
✣ TTM Performance of 109%
✣ Good Volume profile.
Stock is right now breaking out. Some volume is missing but we still have 2 trading days to end the week.
If the breakout is confirmed, we could see a nice rise in the stock price...