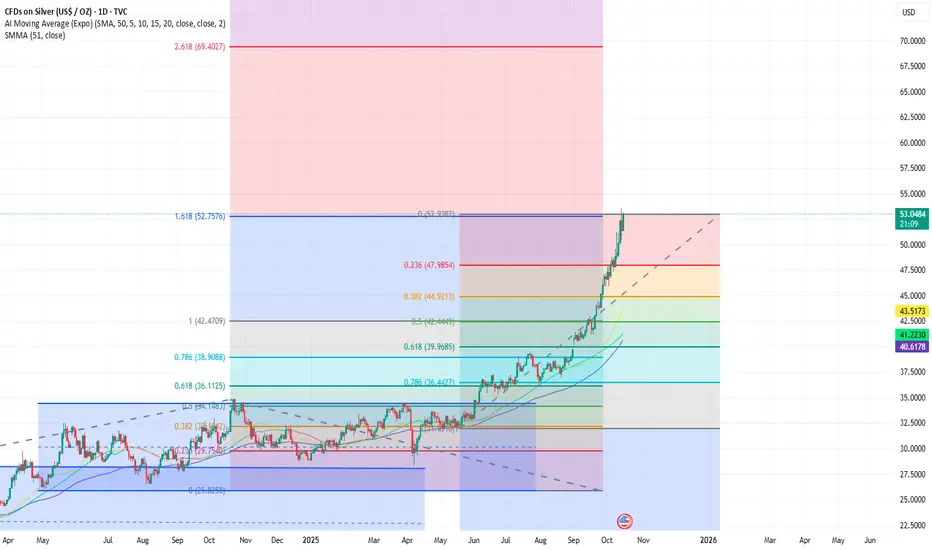
The Silver ChartRecent technical analysis suggests a bearish signal for silver, with charts showing a potential reversal after a significant rally. However, there is conflicting information, as some technical indicators still show a "Strong Buy" signal and long-term fundamental factors like tight supply and industrial demand could support prices
Cup And Handle
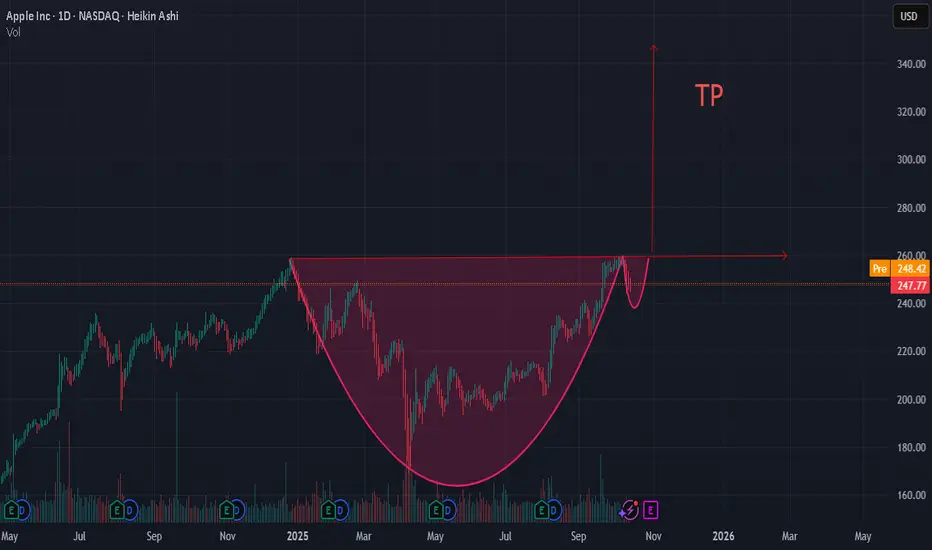
CUP AND HANDLE ON AAPL TP 340 LONGApple moves in a 10-15% range for years!
With lowering interest rates, and with quite low P/E ratio (32), compared to other companies in this industry, a new wave can begin!
JOBY | Let It Fly | LONGJoby Aviation, Inc. is a transportation company, which engages in developing an all-electric, vertical take-off and landing aircraft that intends to operate as a commercial passenger aircraft. The company was founded by Bevirt Joebenn in 2009 and is headquartered in Santa Cruz, CA.

Bitcoin Price Prediction: $351,000 Target Hi everyone! 😊
I've shared my Bitcoin analysis with you. Based on the RSI divergence with price, along with the formation of a cup and handle pattern, my final prediction for Bitcoin is reaching the target of 351,000 USDT. 🚀
However, I absolutely do not recommend long positions in futures trades due to the high risk from negative fundamental news. ⚠️
I hope you'll share your thoughts on this analysis! 💬
If you found this analysis interesting, give me some energy by liking it! 👍 Don't forget to share it with others! 🔄
Please note that trading responsibility lies with you, and my analysis is solely a personal opinion. 📝

Teacup Chart Pattern — Brewing Bullish MomentumSup, legends! Shall we tea it up? ☕
Today, we’re not just talking about your morning cuppa. We’re diving into something traders get excited about — the Teacup Chart Pattern. Just like a perfect brew, this pattern takes time to form, and knowing how to spot it can make your trading experience much smoother.
What Is the Teacup Chart Pattern?
The teacup chart pattern is a bullish continuation setup that resembles the shape of a tea cup when plotted on a price chart. It typically forms after an extended uptrend, signaling a consolidation phase before the asset resumes its upward trajectory.
Key characteristics of the tea cup pattern include:
A rounded bottom that reflects a gradual shift from selling pressure to buying support.
A slight pullback, known as the "handle," which represents a brief pause or shakeout before the next move.
A breakout above the resistance line at the cup’s rim, often accompanied by strong trading volume.
Anatomy of the Teacup and Handle Pattern
To apply teacup pattern trading effectively, traders must understand the structure:
The Cup – This is the rounded consolidation. It can take several weeks or months to form, depending on the timeframe. A smoother curve is generally considered stronger than a sharp V-shaped recovery.
The Handle – Following the cup’s formation, price action typically retraces slightly, creating a downward or sideways movement. This handle reflects short-term profit-taking and helps “reset” market sentiment.
The Breakout – Once the handle is complete, a breakout above the cup’s rim confirms the tea cup trading pattern and signals renewed bullish momentum.
Trading the Teacup Pattern
When approaching tea cup pattern trading, consider the following strategies:
Entry Point : A common entry is at the breakout above the rim of the cup, once volume confirms the move.
Stop Loss Placement : Traders usually place stops slightly below the handle’s low to minimize downside risk.
Target Projection : The potential price target can be estimated by measuring the depth of the cup and projecting it upward from the breakout point.
Why the Teacup Trading Pattern Works?
The teacup trading pattern embodies market psychology. The rounded cup reflects gradual accumulation, while the handle signals a controlled pullback that shakes out weak hands. When the breakout occurs, it often triggers a surge of buying pressure from both breakout traders and those re-entering the market.
For crypto traders, the tea cup chart pattern is particularly valuable because digital assets are prone to sharp moves. Recognizing this structure early can provide an edge in catching strong upside momentum.
Common Mistakes in Teacup Pattern Trading
Even experienced traders can misinterpret the teacup chart pattern. Some common pitfalls include:
Mistaking a sharp V-shaped rebound for a valid cup formation.
Entering too early, before the handle completes.
Ignoring volume confirmation, which often validates the breakout’s strength.
Patience and discipline are critical in successfully applying the tea cup pattern trading strategy.
Final Thoughts
The teacup and handle pattern is one of those OG bullish setups in crypto that just works when you read it right. Think of it as the market taking a chill before the next leg up. You spot the rounded cup, wait out that handle fake-out, and when volume kicks in — that’s your green light.
With crypto’s crazy volatility, the teacup trading pattern can be a solid way to catch continuation moves and ride some serious momentum. Just don’t ape in blind — always stack confirmations. Watch the volume, line it up with MAs or momentum tools, and filter out the noise. The pattern’s strong, but context is king if you don’t wanna get trapped in a fake breakout.

FLOCKUSDT Cup & Handle Breakout, More Rally LoadingFLOCKUSDT has successfully broken out above the strong cup and handle neckline zone, confirming a bullish continuation structure. The current pullback towards the breakout zone should act as a healthy retest and provide a strong buy-back opportunity.
As long as the neckline zone holds, we anticipate another leg up that could trigger a more aggressive rally towards the projected bullish targets shown on the chart. Failure to hold the neckline zone, however, would invalidate the setup and delay the bullish move.
The plan remains to accumulate from the retest zone and follow the bullish path while keeping risk management in place.

GMR Airports Ltd – Cup & Handle Breakout in the MakingGMR Airports Ltd – Cup & Handle Breakout in the Making
NSE:GMRAIRPORT
📈 Pattern & Setup:
GMR Airports is forming a classic Cup & Handle pattern on the daily chart. After a long consolidation phase and multiple shakeouts around the 80–85 zone, the stock has started curling up again from its base.
The structure shows a strong recovery from the cup bottom, followed by a handle formation with tight price action — a sign of supply exhaustion. The resistance zone around 92–93 has been tested several times, and a breakout above it could mark the beginning of a new upward leg.
📝 Trade Plan:
✍Entry: Above 93 (breakout confirmation)
🚩Stop-Loss: 86 (below handle low)
🎯Targets:
Target 1 → 103
Target 2 → 115 (25% potential move)
💡 Pyramiding Strategy:
1. Enter with 60% position on breakout above 93
2. Add remaining 40% once price sustains above 97 with expanding volume
3. Trail stop-loss to 89 after a close above 100
🧠 Logic Behind Selecting this Trade:
This setup highlights a textbook accumulation structure. Multiple shakeouts during the cup formation cleared weak hands, allowing smart money to accumulate quietly. The tightening handle pattern suggests reduced volatility and growing breakout probability. Once the neckline is crossed, momentum could accelerate toward triple-digit levels.
Keep Learning. Keep Earning.
Let’s grow together 📚🎯
🔴Disclaimer:
This analysis is for educational purposes only. Not a buy/sell recommendation. Please do your own research or consult your financial advisor before trading.

$QS Cup and Handle Breakout continuationAlready formed perfect cup and handle pattern, retraced the 0.618 at $11.91. Then hit the 1.236 fib at $16.34, then retraced back to top of cup as new support. If it hold support, it should retest $16.34 and then on to $19.08 at 1.618 fib.
EP: here @ $14.70
SL: $13.40
TP1: $16.35
TP2: $17.72
TP3: $19.08

$SLI Cup and Handle Forming 10/12/25Base formed around $1.06. Reached top of cup at $4.74. Retrace back to $3.33 before resuming breakout.
EP: $3.3
SL: $2.85
TP1: $4.74
TP2: $5.61
TP2: $6.60
TP3: $7.00

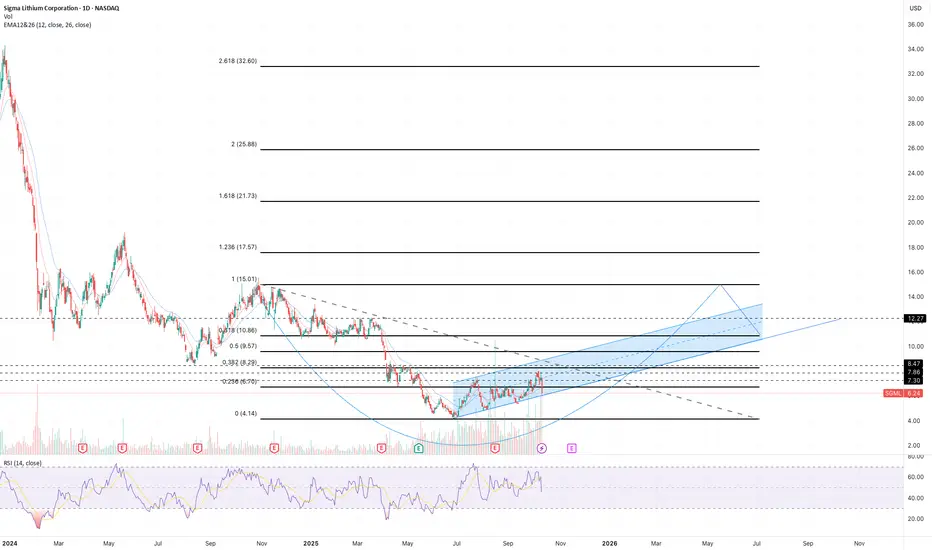
$SGML Cup and Handle Forming into next yearFinding a bottom around $4.14. Trending up back towards $15 would be the cup. Retrace to $10.86. Opportunities to swing it up and play the parallel channel.
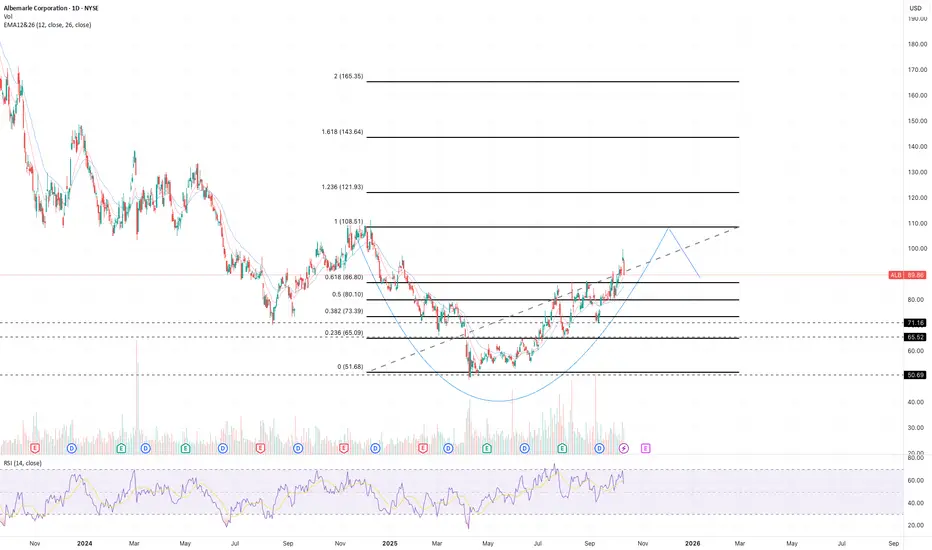
$ALB Cup and Handle FormingNYSE:ALB forming a cup and handle after forming a based around $51.68. 0.618 retracement from the top would be $86.80. I think this is a good entry before resting $108.51 and then breaking higher.
EP: ~$86.80
SL: $80.10
TP1: $108.51
TP2: $121.93
TP3: $143.64
TMRC Cup and Handle Breakout SoonTMRC is currently finishing a cup in a cup and handle formation. A retrace to the 0.618 from top to bottom of cup would be $1.39. An entry near there would be good.
Entry: ~$1.39
Stop loss: $1.28
TP1: $1.71
TP2: $1.91
TP3: $2.24

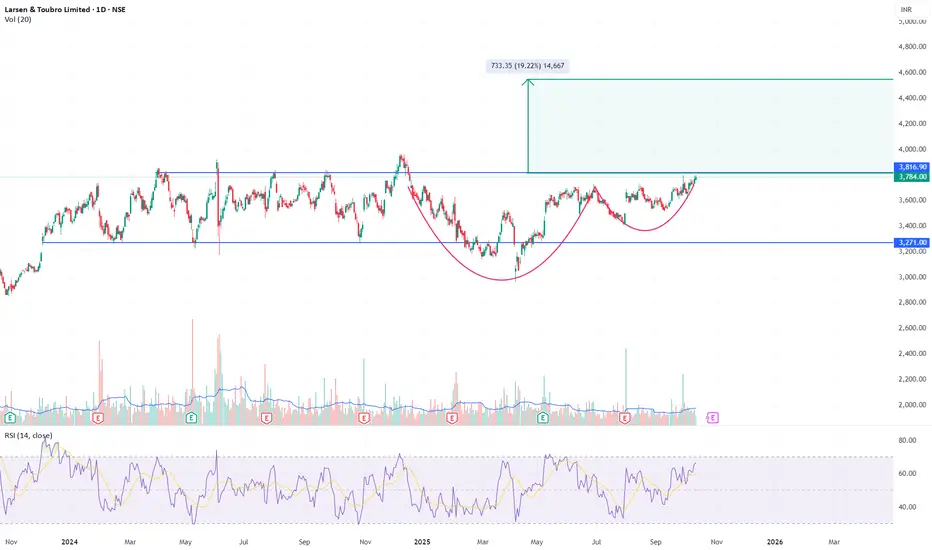
L&T - Cup and Handle Formation Near Breakout ZoneChart Structure:
Larsen & Toubro is forming a textbook Cup and Handle pattern that’s now testing its neckline around ₹3,780–₹3,800. The base extends nearly 10 months, creating a strong accumulation structure with a shallow handle - ideal for a breakout continuation.
Technical Highlights:
Cup Base: ₹2,950–₹3,000
Neckline: ₹3,780–₹3,800 (currently being tested)
Handle: Tight consolidation with declining volume, now showing early expansion
RSI: Rising towards 70, confirming strengthening momentum
Volume: Reaccumulation behavior - lighter on corrections, heavier on upswings
Trade Setup:
Breakout Confirmation: Close above ₹3,820 with strong volume
Target: ₹4,500–₹4,550 (≈19% upside from breakout)
Stop-Loss: ₹3,600 (below handle low)
Technical Verdict:
A sustained move above ₹3,820 would mark a major bullish continuation, potentially initiating a new leg in L&T’s long-term uptrend. Pattern reliability is high given the depth, duration, and structure of the base.
Disclaimer:
This analysis is for educational and informational purposes only and does not constitute investment advice or a recommendation to buy or sell any security. Markets involve risk, and past performance does not guarantee future results. Conduct your own due diligence or consult a qualified financial advisor before making investment decisions.
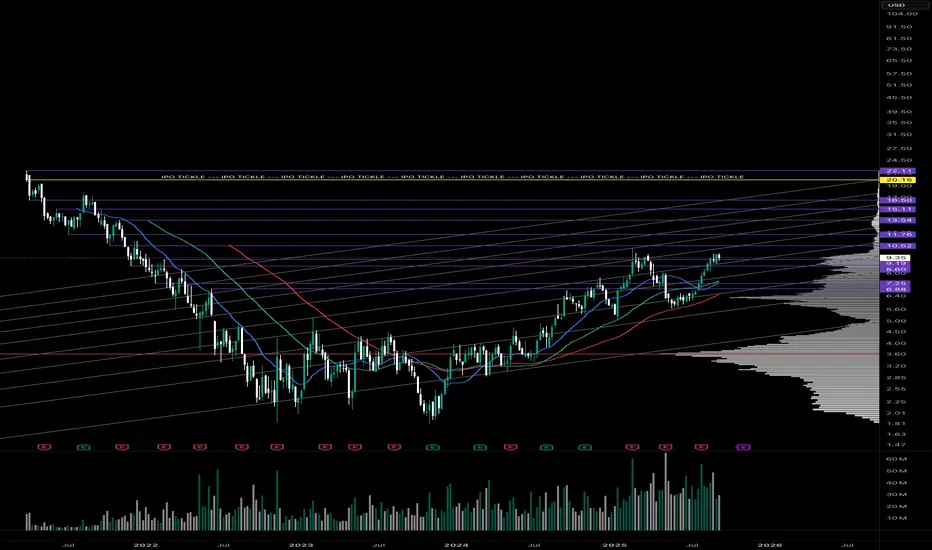
To know where you are, you need a Compass. Opendoor Technology's ( NASDAQ:OPEN ) recent surge (20x of lows) caused me to wonder what the theme is. After all, rarely is a movement motivated by nothing.
I've determined the only logical conclusion is the correlation of Real Estate to interest rates.
Opendoor is a REIT disguised as a tech company and without the hefty dividend. While they offer tools for homeowners to exit / enter homes quickly, they really are just operating a fat inventory of housing. This is a difficult asset to manage at scale and of course is why they had a difficult 3.5 years after IPO AND the quickest increase of interest rates since the 1980s. This post isn't meant to talk trash on OPEN. I am very happy with what the asset did and may very well continue to do.
Compass, Inc. ( NYSE:COMP ) operates a set of tools to allow real estate agents a simpler buying / selling process for their clients. A very similar value proposition to OPEN, but without the heavy real estate inventory on the balance sheet. The lack of bloat on the balance sheet allows COMP to focus on their main customers intently. What this means is a decrease in interest rates will likely allow their base to do more business and frankly a significantly larger amount of business when compared to 2022-2024.
The current DD is simple.
* COMP price-to-sales of 0.7, i.e. they're market capitalization is 70% of their annual revenue. This means they are trading at a discount to their current business model and NO growth is priced in.
* Interest rates are coming down next week. The only question is if the Federal Reserve will lower rates by 0.25 of 0.5. If you think I'm just making this up, check out this link --> www.cmegroup.com
* The chart suggest Compass has completed a multi-year Cup and Handle pattern. The end of the handle is generally quite bullish. As well, the volume profile notates only a single node of transaction volume above at about ~$13.5. Outside of that level, it's wide open above without much price resistance.
My main price target for this trade is IPO value, which is around ~$18 aka 100% away.
TAO - BULLISH BREAKOUT AWAITED#TAO - Bullish 📈
Cup & Handle H4 & Daily wedge test 🚀
Key resistance: 378 - 380$.
Price is gonna fly if we break above 🚀
🎯400
🎯435
🎯440
🎯478+

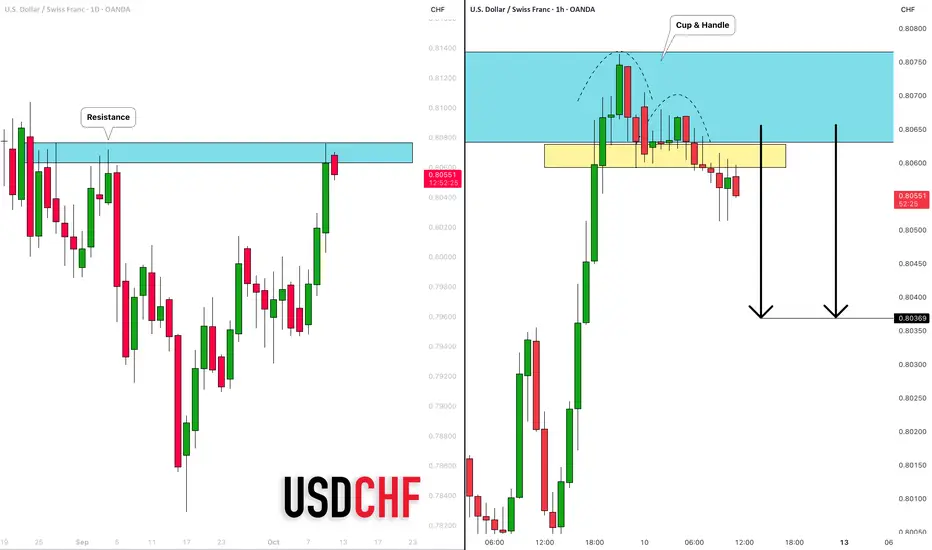
USDCHF: Overbought Market & Pullback 🇺🇸🇨🇭
There is a high chance that USDCHF will retrace from the underlined
horizontal daily resistance.
A cup & handle pattern formation on that on an hourly time frame
suggest an overbought state of the pair.
Goal - 0.8037
❤️Please, support my work with like, thank you!❤️
I am part of Trade Nation's Influencer program and receive a monthly fee for using their TradingView charts in my analysis.
Home Depot Cup and HandleHome Depot is all set up to rocket as interest rates are cut and mortgages get cheaper. Hopefully the increased homebuilding will lead to increased sales this year and in 2026, completing the pattern.

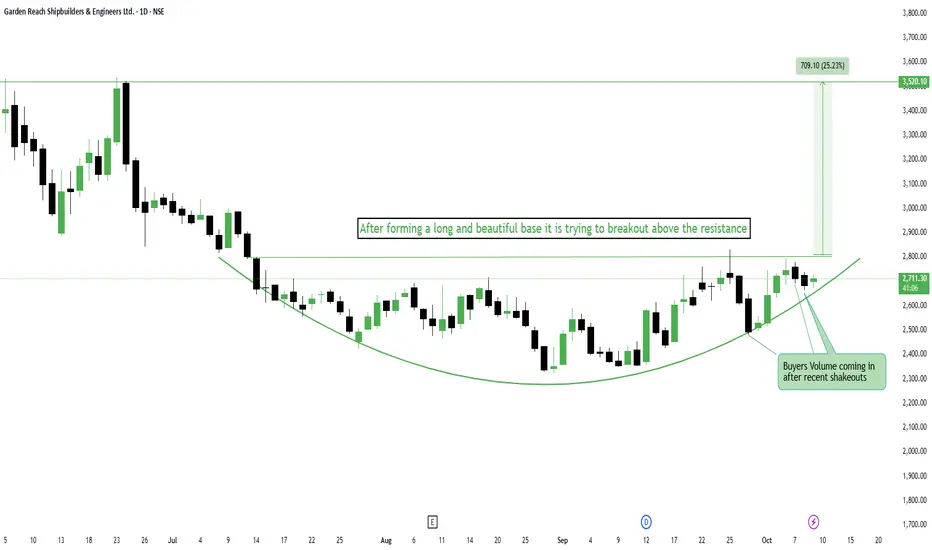
GRSE - Base Formation Turning into Breakout SetupGarden Reach Shipbuilders & Engineers Ltd – Base Formation Turning into Breakout Setup
NSE:GRSE
📈Pattern & Setup:
GRSE has been quietly forming a classic rounding base pattern over the past few months, absorbing every shakeout phase (as marked on the chart). Each dip found buyers stepping in, creating a smooth U-shaped recovery — a strong sign of accumulation.
Now, the stock is attempting to break out of its neckline resistance near 2750 after multiple retests. This zone has acted as a wall for months, but the recent surge in buying volume right after the last shakeout hints that strong hands are taking control.
If price sustains above this neckline, the breakout can easily trigger a sharp rally toward 3500+ in the medium term.
📝 Trade Plan:
Entry: Above 2760–2780 for confirmation of breakout.
🚩Stop-Loss: 2600 (below trendline and last shakeout low).
🎯Targets:
Target 1 → 3100 (initial move).
Target 2 → 3520 (pattern completion, ~25% potential).
💡Pyramiding Strategy:
1. Enter first lot on breakout above 2780.
2. Add more once the stock sustains above 2850 with volume confirmation.
3. Trail stop-loss to 2670 after price crosses 2950.
🧠Logic Behind Selecting this Trade:
The combination of shakeouts, rising demand volume, and a well-rounded base indicates that the stock is in late-stage accumulation. Breakouts from such long bases tend to deliver strong, sustainable upside moves.
This is a textbook case of "volume follow-through after consolidation", which often marks the beginning of a fresh uptrend.
Keep Learning. Keep Earning.
Let’s grow together 📚🎯
🔴Disclaimer:
This analysis is for educational purposes only. Not a buy/sell recommendation. Please consult your financial advisor before taking trades.
The biggest cup&handle of all times: silver targets $50The data suggests a cup&handle:
Cup was between 1980-2011
Handle is still in progress and probably may finish by 2025 or earlier.
For the short run: a re-test of low re-accumulation range of $23 can be seen.
The next mid-term target will be $25.
Final target will be $50.

KIOCL| Buy @ LTP | Strict SL below 485| Targets 630, 960Disclaimer:
This is not financial advice. Please do your own research or consult with a financial advisor before making any investment decisions. Investments in stocks can be risky and may result in loss of capital.

SEQUENT | Buy @ 215 | SL below 180 | Target 360Disclaimer:
This is not financial advice. Please do your own research or consult with a financial advisor before making any investment decisions. Investments in stocks can be risky and may result in loss of capital.

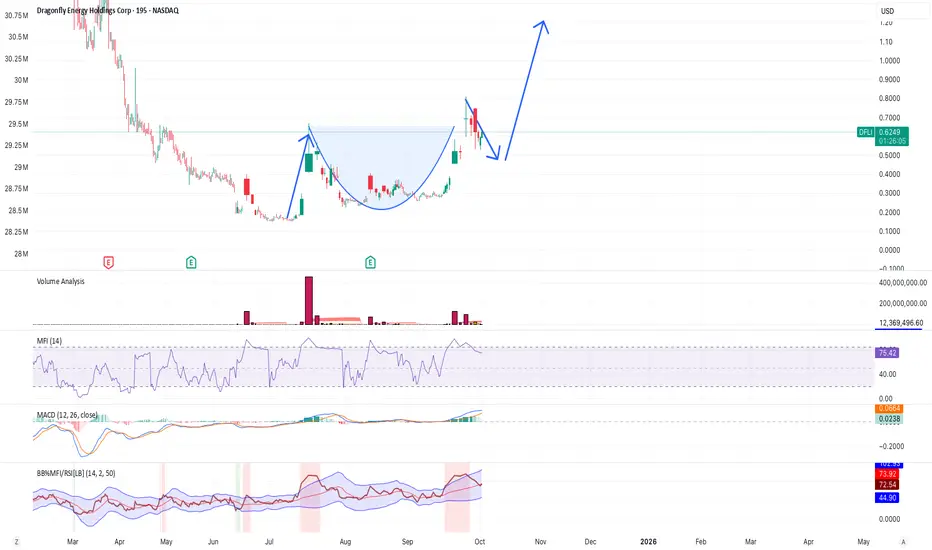
Cup & Handle Chart Pattern on $DFLIA bullish cup and handle chart pattern is currently in play for $DFLI. It is easy to see on the 1/2 day (195min) timeline. Given this is a penny stock, I am allowing a cup and handle chart pattern on a timeline shorter than 1 day.
Importantly, the cup was initiated and preceded by a rise from a lower base. Currently, the handle is playing out with a low volume decline from the top of the cup. Minor further downside is possible before a swift and strong breakout through the $0.80 price point, with a profit taking target area of $1.30+. A downside break below $0.40 prior to breaking out above $0.80 would nullify the chart pattern.
These are my observations and thoughts alone and not meant as financial advice.
$AMZN massive cup and handle formingIf we look at the chart of AMZN, we can see that $236 has become an important resistance level.
So far, it's been tested multiple times which means that resistance has weakened. I do think that next time we get up to that level, it'll likely break and we can see higher prices.
On top of the resistance being weakened, there's a massive cup and handle forming on the chart. If we end up breaking resistance, the measured target would be the $313 resistance.
I've marked off other important levels on the chart should price break that key resistance level.
Let's see how it plays out over the coming month. Will likely start accumulating calls on any dips.
