RELTD - Ravindra Energy | Buy @LTP | SL below 159 | Target 232Disclaimer:
This is not financial advice. Please do your own research or consult with a financial advisor before making any investment decisions. Investments in stocks can be risky and may result in loss of capital.
Cup And Handle


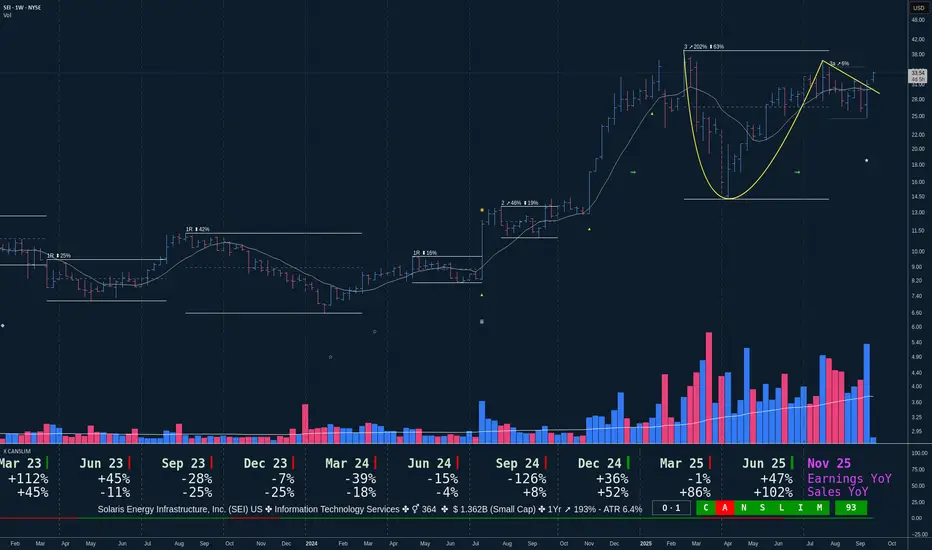
Solaris (SEI ) tempting an assault to a C&H at base 3Key points at the time of writing.
✣ We are at a new market cycle since June 2025
✣ Market Direction is Up 90%
✣ Stock Fundamentals are almost good, only missing yearly earnings for now.
✣ Institutional Ownership is 67% (marketbeat.com) (no quarterly data)
✣ Stock technically at base 3.
✣ TTM Performance of 193%
✣ Good Volume profile.
The stock shows evident signs of accumulation with a Highest Positive Volume Ever last week which broke the handle down trend.
I expect it to rally If the handle buy point is broke hopefully with good volume.
USDCAD: Bull Trap & Confirmed Bearish MovementThe USDCAD appears to be bearish following a false violation of a significant daily resistance level.
The formation of a cup and handle pattern, coupled with a bearish imbalance after the neckline violation, suggests a strong bearish signal.
I anticipate a downward movement, potentially reaching 1.3797.

$SOL / $BTC 50WMA Reclaimed - Alt Season Confirmed!Ladies and Gentlemen,
CRYPTOCAP:SOL / CRYPTOCAP:BTC has officially closed the Week above the 50WMA and is back within the POI.
Double bottom confirmed this setup.
Along with the longest cup and handle I’ve ever seen lol.
Let the rotation for Alt Season begin!

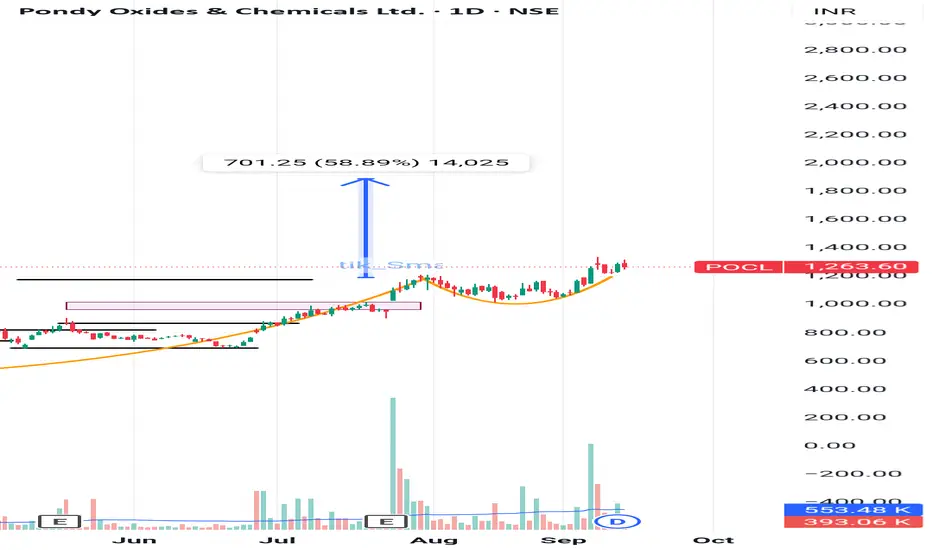
POCL : Cup & Handle PatternPOCL : At Cup & Handle Breakout levels
CMP 1263
Pattern Target 1900
View negated below 1150
Please check the chart for details.
XRP Cup & Handle – Testing a Key Breakout ZoneXRP has built a textbook cup & handle formation on the daily timeframe, a pattern that often signals continuation when confirmed.
Cup Formation: The rounded base extended across several months in 2025, absorbing selling pressure and establishing support.
Handle Development: A descending wedge formed as the handle, pulling price back into prior resistance.
Breakout Test: Price is now pressing against the neckline (~$3). Sustained closes above this area are critical for confirming a breakout.
Measured Move Projection (example, not a guarantee): A typical cup & handle breakout can project a move equal to the depth of the cup. In this case, that points toward the ~$4.20 region.
Key Levels to Watch
Support: ~$2.80 (handle low / prior consolidation zone)
Breakout Level: ~$3.00 neckline
Potential Projection: ~$4.20 if breakout confirms
Takeaway
The setup is clear: XRP needs to confirm the breakout with sustained closes above the neckline and rising volume. Without confirmation, the pattern risks invalidation.
This is an educational chart only - not financial advice. Market movements are unpredictable, and past performance is not indicative of future results.

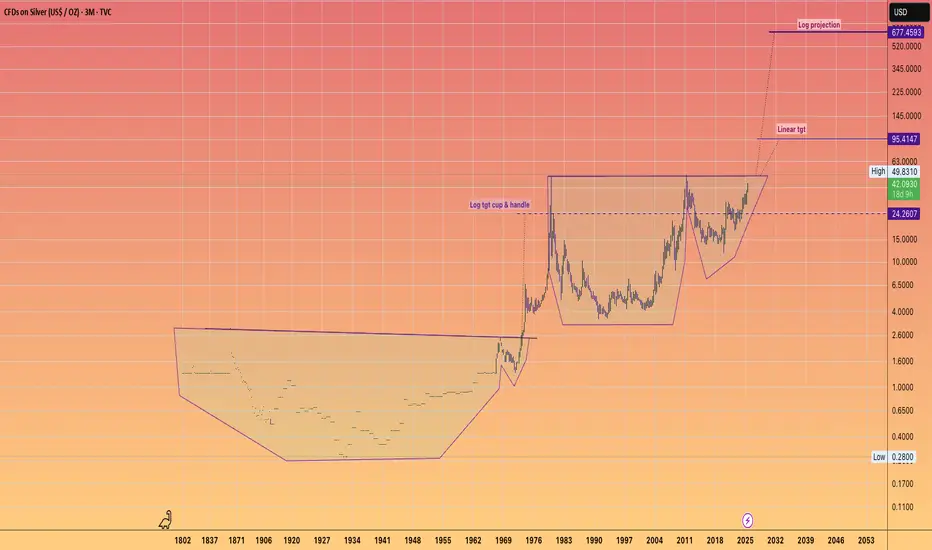
SILVER Accelerating to $95This is the full history of Silver.
With it's two GIANT Cup & Handle Patterns.
Big Patterns = Big Moves !!!
I find myself uncertain about the kind of world we would inhabit if Silver were to achieve the LOG projections in a chaotic disorderly manner.
We are undoubtedly stepping into a period of significant transformation across various sectors for global society in the coming decade or two.
Finance. Governance, Technology—let's seize the moment and take full advantage of the incredible opportunities available to us.

GOLD (XAUUSD): Time To Fall!?Gold appears to be respecting a falling trend line on a 4H time frame.
A strong bearish pattern seems to be emerging. The price has formed a cup and handle pattern and is currently testing its neckline.
The next confirmation for a bearish trend is to watch for a breakout. A 4-hour candle closing below the 3620 level would validate the breakout.
Subsequently, a bearish reversal could be anticipated, potentially leading towards the next support level.

[b]New All Time High for DOGE [/b]New All Time High for DOGE
Cup & handle on weekly timeframe on $DOGEUSD. This aligns perfectly with a squeeze from Bollinger Bands, top of Elliot Waves, solid support from next Fibonacci level and the launch of the ETF tomorrow! Run DOJE Run!

#HBAR USDT PERP 1D
Watching this level 👀 → $0.2355
Break & close above = 🚀 Long Entry confirmed
Support strong at $0.2230
Next stop if breakout holds → $0.25 – $0.26
Simple: Breakout = send, Rejection = back to support 🔄

Elementary TA - Cup & HandleIn pure return % from the 2022 bottom (+330%) ; following 'Cup & Handle' TA guidelines, the +330% yields a future CRYPTOCAP:BTC price near the $300k mark...
Using the drawdown % from the 2021 ATH (-76.5%) and applying the same 'Cup & Handle' methodology, we have a more sober target of +76.5% from ~$70k and yield a future CRYPTOCAP:BTC price of $125k...
God speed

FFL Cup & HandleBeautiful cup and handle formation completed. Next target as per cup and handle is mentioned in chart. This is not a buy/sell call.

NZDJPY: Can We Expect a Pullback?The NZDJPY pair appears to be testing a strong horizontal resistance level on its intraday chart.
An inverted cup and handle pattern is observable on an hourly timeframe, accompanied by a neckline breakout, multiple rejections, and an unusual gap up.
There is a possibility of a price rebound.
Potential targets are 87.22 and 87.00.

CHFJPY: Another Bearish Confirmation 🇨🇭🇯🇵
2 out of 3 gaps that we traded yesterday were filled.
The one that is still missing is on CHFJPY.
This morning, I see another bearish confirmation that was formed
on higher structure levels - a neckline breakout of an inverted cup & handle pattern.
With a high probability, the price will drop to our projected target soon.
❤️Please, support my work with like, thank you!❤️
I am part of Trade Nation's Influencer program and receive a monthly fee for using their TradingView charts in my analysis.

CADJPY: Another Gap For Today?I spotted another potential gap-up opening on the 📉CADJPY pair.
Based on the formation of a cup and handle pattern on the hourly timeframe, a bearish continuation appears highly probable.
My target is 106.61.

Zydus Lifesciences – Weekly Breakout Watch, Targeting 1,200Chart Context (Weekly)
Multi-year horizontal resistance around 1,020 tested repeatedly since 2022.
Strong weekly candle now approaching this zone with above-average volume (7.15M vs 5.01M).
RSI climbing ~60, momentum building without overbought conditions.
Setup
Base formation since late 2024 after a deep correction.
Breakout above 1,040 on a weekly close confirms structural reversal.
Measured move from base points to ~1,200 (~20% upside).
Levels
Breakout trigger: Weekly close > 1,040.
Upside potential: 1,150–1,200.
Risk management: Structure invalid below 960.
Bias: Medium-term swing; breakout confirmation needed for follow-through.
Disclaimer: This analysis is for educational purposes only and does not constitute investment advice. Please do your own research or consult a financial advisor before making trading or investment decisions.

Gold MCX Bullish MoveGold as long as it is staying above the ichimoku cloud it can show a bullish move from here within a few days.. this month we can expect some movement on the upside clearing highs.
Stop loss can be kept near 94700-95300 levels with target of 102000 - 105000 with this month.

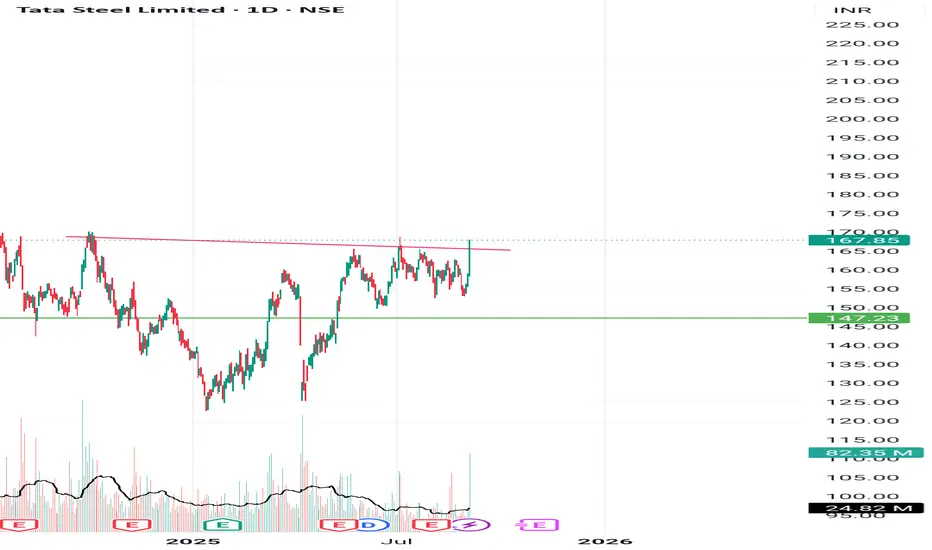
Clear breakout with good volume Breaked a clear trendline cum cup and handle pattern with decent volume indicates to go up. Do your own analysis and take up your trade
***Educational purposes only***

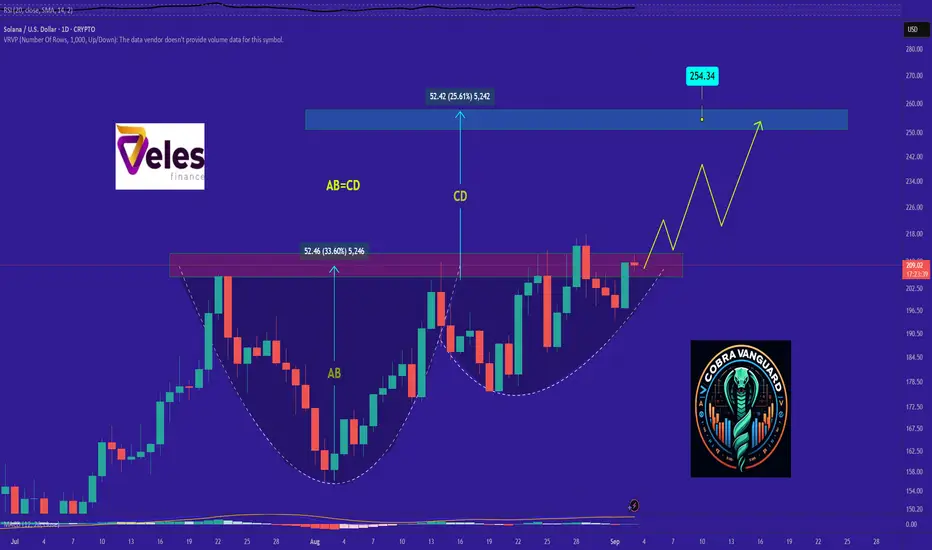
SOL's Situation, A Comprehensive Analysis !!!It appears that the price is forming a cup and handle pattern, and if this occurs, it could push the price above $215.
Best regards CobraVanguard.💚
ENIC: Can You Ignore This Massive Cup And Handle?ENIC (Enel Chile S.A.) is a Chilean utility company primarily engaged in the generation, transmission, and distribution of electricity. A key player in the Chilean energy sector, the company focuses on serving residential, commercial, industrial, and government customers.
Technical Analysis
ENIC's chart exhibits a classic " cup and handle " pattern, a bullish continuation formation that signals a potential for a significant upward move.
Understanding the Cup and Handle Pattern
The cup and handle pattern, developed by William J. O'Neil, is a technical chart pattern that looks like a teacup with a handle. It is considered a bullish signal and is formed after an uptrend, indicating a period of consolidation followed by a continuation of the upward movement.
The "Cup": The cup is a rounded, "U" shaped formation that shows a price drop, a stabilization period at the bottom, and a rally back to the original price level. A rounded bottom is preferred over a sharp "V" shape, as it indicates a more stable consolidation.
The "Handle": The handle is a smaller, downward-sloping or sideways consolidation that forms on the right side of the cup. It represents a period of profit-taking by early buyers before the next leg of the rally.
ENIC's Current Setup
The chart shows the formation of a well-defined cup and handle pattern. The neckline, which is the resistance level at the top of the cup, is identified between $3.44 and $3.50.
Breakout Confirmation: Traders should monitor the price for a clean breakout above this neckline on strong volume. A breakout would confirm the pattern and signal a potential move to the upside.
Measured Move Target: The measured move of the cup and handle pattern, which is calculated by taking the height of the cup and adding it to the breakout point, sets a first target price of $5.80. This would represent a 70% return from the current levels if the breakout is confirmed.
Fibonacci Extensions: For potential longer-term targets, Fibonacci extensions provide additional price levels to monitor:
Fibonacci Extension No. 1: $6.22
Fibonacci Extension No. 2: $7.20
Historical Performance
Since July 2022, ENIC has shown strong momentum, generating a 250% return for long-term investors. This impressive performance, combined with the current bullish chart pattern, suggests the stock could be poised for another significant move.
Sector: Utilities
Country: Chile
Suitable for long term investors
Disclaimer: This is a technical analysis based on chart patterns and is not financial advice. All trading involves risk. It is crucial to conduct your own due diligence and consider your personal risk tolerance before making any investment decisions.
