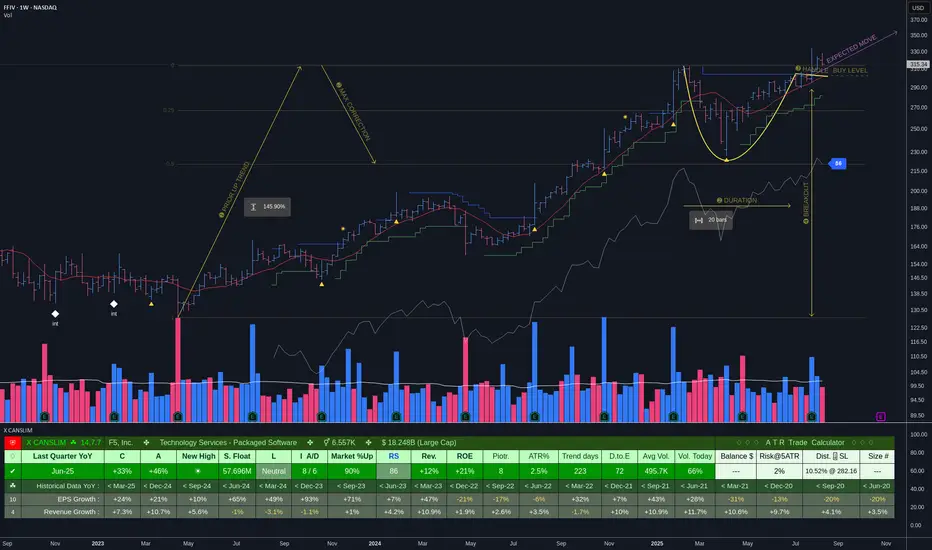
FFIV has just cleared a CUP with HANDLE patternThe stock has good fundamentals and the pattern checks all the criteria:
➊ Prior Up Trend > 30% with volume. ✔
➋ 50% Max Correction Cup over 7 to 65 weeks. ✔
➌ 2 weeks or more Handle above 50% of Cup and 10 week ma. ✔
➍ Breakout Day Volume > 140% of 50 day average. ✔
⮞ The peak price in the handle area is what determines most buy points
and is almost always below the base’s actual high.
⮞ Sometimes you can get a slight head start by drawing a downtrend line
from the overall pattern’s absolute peak downward across the peak
where the stock begins building the handle and begin your purchase
when the trend line is broken on the upside a few weeks later.
I expect it will go up in the coming months as long as the fundamentals continue to be there and the market doesn't turn bearish.
Cup And Handle
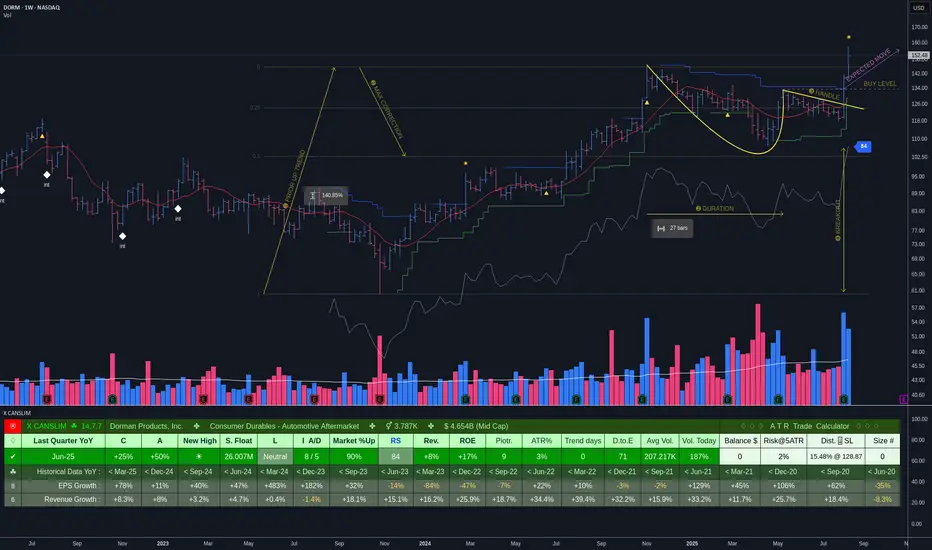
DORM has just cleared a CUP with HANDLE patternThe stock has good fundamentals and the pattern checks almost all the criteria:
➊ Prior Up Trend > 30% with volume. ✔
➋ 50% Max Correction Cup ofer 7 to 65 weeks. ✔
➌ 2 weeks or more Handle above 50% of Cup and 10 week ma. ~
➍ Breakout Day Volume > 140% of 50 day average. ✔
⮞ The peak price in the handle area is what determines most buy points
and is almost always below the base’s actual high.
⮞ Sometimes you can get a slight head start by drawing a downtrend line
from the overall pattern’s absolute peak downward across the peak
where the stock begins building the handle and begin your purchase
when the trend line is broken on the upside a few weeks later.
I expect it will go up as long as the fundamentals are there and the market doesn't turn bearish.
USDCAD: More Growth is Coming Next Week 🇺🇸🇨🇦
There is a high chance that USDCAD will continue rising next week.
The market closed in a very bullish sentiment, nicely respecting
a recently broken horizontal resistance and closing above that.
The next strong resistance is 1.3852
It will be the next goal for the buyers.
❤️Please, support my work with like, thank you!❤️
I am part of Trade Nation's Influencer program and receive a monthly fee for using their TradingView charts in my analysis.

RKT – Cup & Handle Breakout Setup + Bullish Earnings Beat (TargeSummary
Rocket Companies (RKT) has formed a multi-year Cup & Handle pattern, now testing the key breakout zone at $19.8–20.2. Last week’s earnings beat (+41% EPS surprise, +6.6% revenue surprise) adds bullish sentiment. A confirmed breakout with volume could trigger a strong continuation move toward higher Fibonacci targets.
Technical Confluence
Cup & Handle : Clean rounded bottom from 2022–2024 with a shallow handle retracement – classic bullish continuation setup.
Harmonic Structure (ABCDX – Bat Variant):
AB ≈ 0.55 of XA
BC ≈ 0.836 of AB
CD ≈ 1.677 of BC
D ≈ 0.861 of XA – potential resistance zone, but breakout above invalidates the short harmonic bias.
Momentum Indicators:
RSI trending higher, not yet overbought on daily.
MACD positive with expanding histogram.
Stochastic elevated, which can remain high during strong breakouts.
Volume: Recent spikes around earnings support the possibility of sustained interest.
Trade Plan
Breakout Trigger
Daily close > $20.20
Volume ≥ 1.5× 20-day average volume
Entry Levels
Conservative: $20.20–20.60 after confirmed breakout + retest
Aggressive: $19.20–19.60 on handle bounce (higher risk)
Stop Loss
Conservative: < $17.40 (below handle low / major support)
Aggressive: < $18.10 (break back into handle)
Profit Targets
T1: $21.8–22.5 (prior swing high / X point)
T2: $25.5–26.8 (Fib 1.272 extension)
T3: $30–33 (Fib 1.618 extension & full cup projection)
Invalidation
Weekly close < $17.5 would negate the bullish structure in the medium term.
Alternative Scenario (Bull Trap)
If $20.2–20.5 rejects with a reversal candle + low volume, expect a pullback toward $18.2–17.5. A break below $17.5 could extend to $15.8 support.
Fundamental Context
Earnings Beat: EPS surprise +41% ($0.04 vs. $0.028 est.), Revenue +6.6% above estimates.
Macro Sensitivity: Highly responsive to mortgage market and interest rate outlook. Rate stabilization or declines could act as a tailwind.
Next Catalysts: U.S. inflation data, Fed rate policy updates, mortgage origination volumes.
Risk Management
Only take breakout entries with volume confirmation.
Scale out partial profits at each target.
Move stop-loss to breakeven after T1 is reached.
Position sizing: risk ≤ 1–2% of account equity.
TL;DR
RKT is at a critical Cup & Handle breakout zone post-earnings beat. A confirmed breakout > $20.20 with strong volume targets 22.5 → 26.8 → 30–33, stops at 17.4–18.1. Watch for rejection signals at $20.5 for a possible short-term pullback.
#RKT #CupAndHandle #BreakoutSetup #HarmonicPattern #TechnicalAnalysis #SwingTrade #EarningsBeat

8/14: Watch Resistance at 3352–3358, Support at 3332–3323Good afternoon, everyone!
After entering the 3372–3378 resistance zone, gold attempted two breakouts but failed, forming a double-top pattern and breaking below the 3366 support. It then found temporary support at 3358–3352, but the rebound failed to reclaim 3366, leading to a further drop to test the 3343–3337 area. This is a textbook support-to-resistance shift, worth studying for those interested in technical analysis.
Currently, the structure favors the bears. In the coming moves, watch closely to see if the 3352–3358 area turns from support into resistance again. If selling pressure persists, 3332–3323 will be the next battleground. Should bulls fail to defend it, the 3300 level could be retested.
For the rest of the week, trading should remain focused on these key support and resistance zones. With data coming in during the US session today, risk management is crucial — favor short positions on rebounds, with long trades as a secondary option. If caught in a losing position, and your account is safe, consider averaging down or hedging. If you need assistance, feel free to message me.

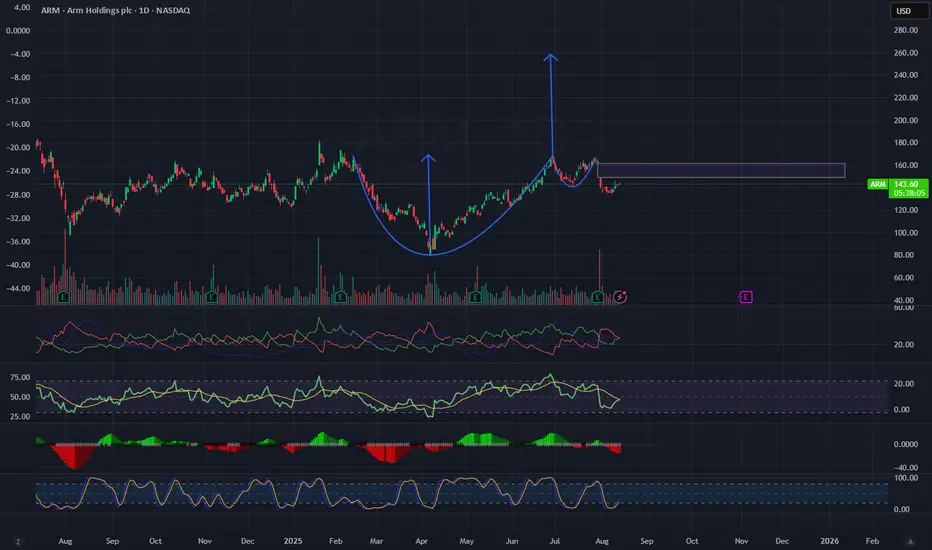
ARM – Cup & Handle Pattern with Potential BreakoutOn ARM’s daily chart, we can see a clear Cup & Handle pattern – twice in a row – with strong upward moves following each completion.
The latest pattern completed around the $165 area, after which the stock pulled back into a healthy correction and is now consolidating in the $140–$150 range.
Technical Analysis:
Pattern: Cup & Handle with a small pullback, indicating potential re-accumulation.
Key Support: $140 (a breakdown below would weaken the setup).
Key Resistance: $150–$155 (a confirmed breakout above could trigger the next bullish leg).
Indicators:
RSI near 50 – neutral, room to move higher.
MACD in a correction phase but close to a potential bullish cross.
ADX showing temporary trend weakness but could strengthen after a breakout.
Stochastic slightly in overbought territory but not extreme.
Volume: Decreasing volume during the pullback – a healthy sign for a potential upward breakout.
Trade Plan:
Entry: On a confirmed breakout above $155 with higher-than-average volume.
Target 1: $165 (previous resistance).
Target 2: $180–$185 (depending on momentum strength).
Stop Loss: Daily close below $140.
Summary:
ARM is showing a classic bullish setup with a strong potential for another upward move. A breakout of the key resistance levels with strong volume could trigger a sharp rally, similar to the previous two bullish waves.
DOGE - Time to buy again!It appears that the price is forming a cup and handle pattern, and if this occurs, it could push the price above $0.33.
Best regards CobraVanguard.💚

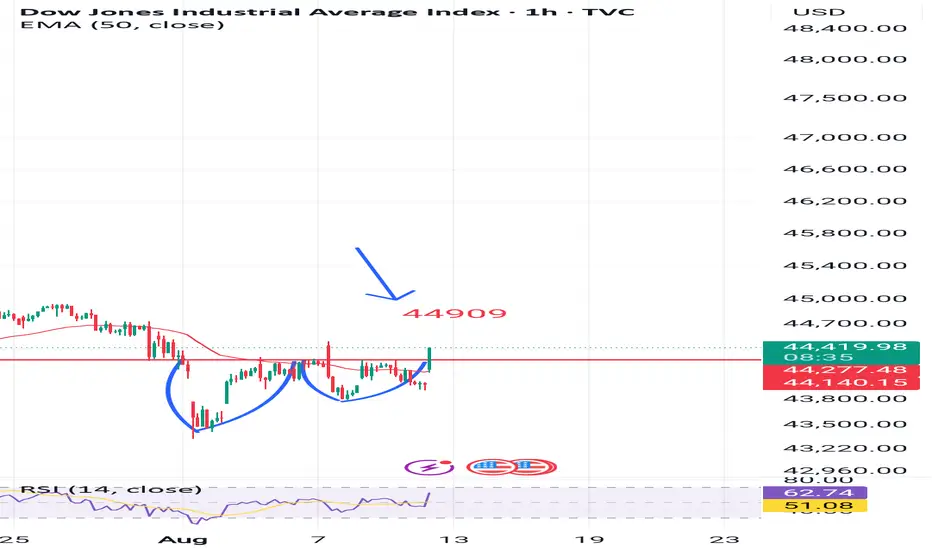
Cup and handle breakout in dow jonesNow cup and handle pattern observed in dji index.
Also the breakout of neckline implying bullish movement hence making the next target 44900.
Which could also affect indian market.
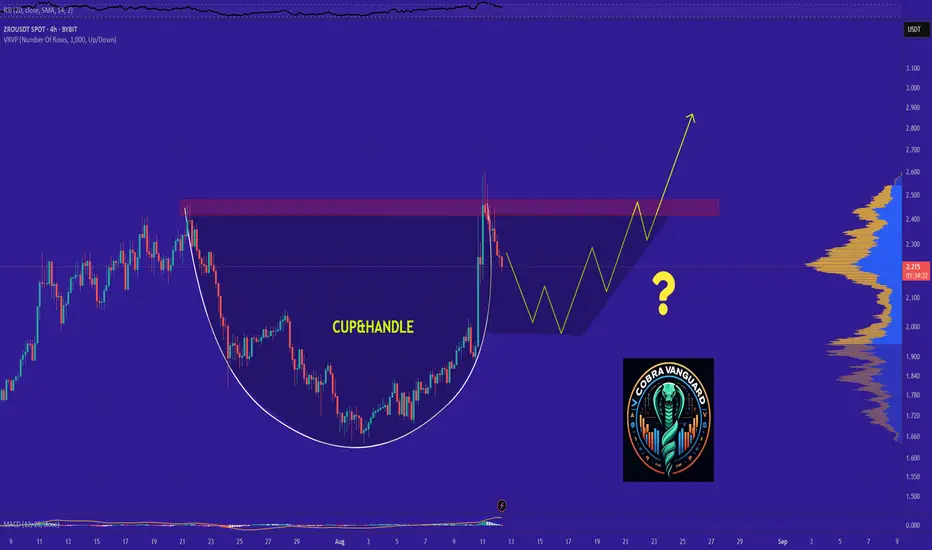
ZRO's Situation (4h) !!!It appears that the price is forming a cup and handle pattern, and if this occurs, it could push the price above $2.5.
Best regards CobraVanguard.💚
PLTR 1D — When the tea is brewed and the handle’s in placePalantir’s daily chart is shaping up a textbook cup with handle pattern — one of the most reliable continuation setups in technical analysis. The cup base was formed over several months and transitioned into a consolidation phase, building a rectangle structure where smart money likely accumulated positions before a breakout.
Now here’s the key: price has not only broken out — it’s settled above all major moving averages, including EMA 20/50/100/200 and MA 50/200. The breakout candle was supported by surging volume, signaling strong participation from institutional buyers. When all the averages start bending upwards, it's usually not by accident.
The breakout above the $121 resistance zone unlocked a pathway toward a target at $187 , derived by projecting the height of the cup upward from the breakout level. This kind of structure, once confirmed, often fuels aggressive continuation — and this one’s got the setup locked in.
From a fundamental perspective, Palantir is holding solid ground: strong earnings reports, expanding government and commercial contracts, and aggressive development in AI services. Institutional interest is rising steadily, and that momentum is visibly reflected in price action.
To sum it up: price has launched cleanly out of the consolidation zone, pierced all critical MAs and EMAs, and continues to gain momentum. While the market sips its tea, this cup is boiling hot. Just don’t forget your stop loss — this is a trading desk, not a tea party.
If you enjoy posts like this, drop a like, share it around, and let’s hear your thoughts below. It keeps ideas moving and the content flowing — free, sharp, and relevant.

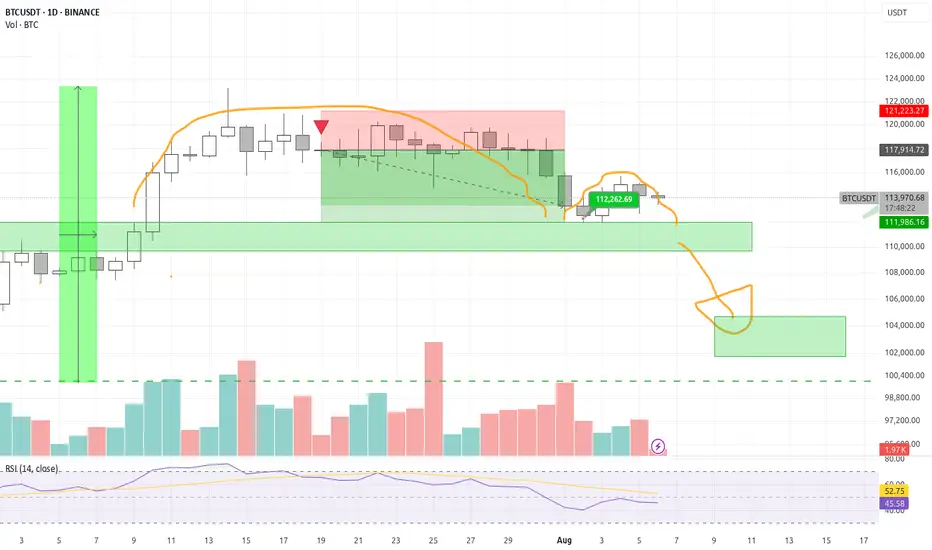
BTC Technical Structure: Cup & Handle BreakoutBitcoin just broke out of a Cup & Handle formation, a pattern often associated with bullish continuation.
Pattern target based on cup depth: ~125,500 USD (projection only, not a guarantee).
Breakout came with increased trading volume and a short consolidation period.
Whether you trade or invest, identifying repeating patterns like this is a core skill for market analysis.
👉 What’s your take? Could this momentum carry into Q4?

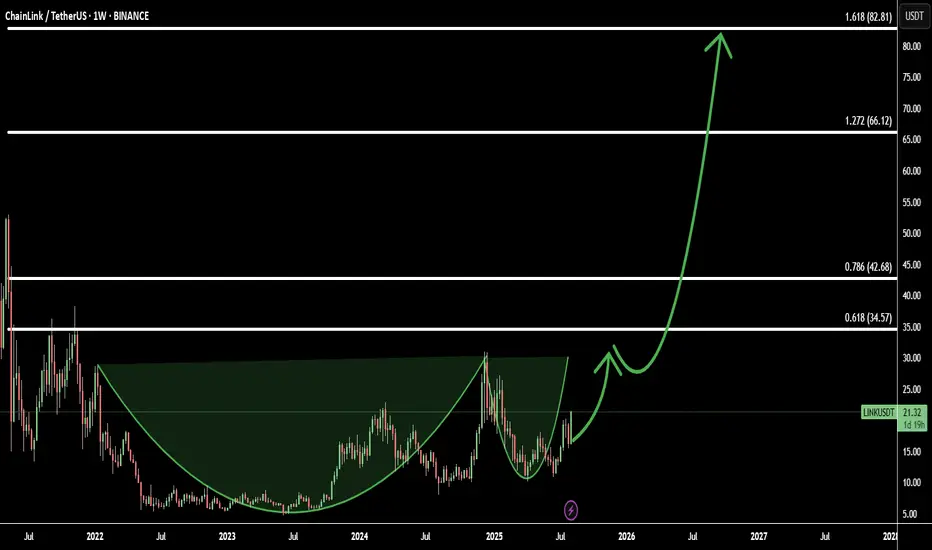
LINK/USDT – Cup & Handle Breakout: 4 Fibonacci Targets AheadGood luck to everyone who bought the dip — now Chainlink (LINK/USDT) is offering another buy opportunity before the big move.
On the chart, LINK has formed a cup & handle pattern — a strong bullish continuation setup that often marks the start of a major rally. This is the beginning of the movement, and price action is aligning perfectly with technical targets.
Using Fibonacci extensions, here are the 4 upside targets:
Target 1: 0.618 Fib – 34.57 - initial breakout confirmation
Target 2: 0.786 Fib – 42.68 - momentum acceleration zone
Target 3: 1.272 Fib – 66.12 - extended bullish target
Target 4: 1.618 Fib – 82.81 - full potential of the pattern
With momentum building and a clean breakout structure, LINK is ready to fly toward these targets.
silver big picturedisclaimer: i got no idea what i am doing
but somehow silver got a 40 year cup and handle pattern in the chart, given the current sentiment and short squeeze potential in the markets, I think it is likely that silver will go back to the midline of the channel at around 100$.
After that I got less conviction what will happen next, it might depend a lot on inflation in fiat currencies and if commodities go into a decade long bull market.

NEIROUSDT that 300% is cooking The neckline of pattern which was 0.00068$ didn't break previous time and price is still range and dead but soon i think the 0.0007$ resistance zone will break with high volume and this signal can hit take profit.
DISCLAIMER: ((trade based on your own decision))
<<press like👍 if you enjoy💚

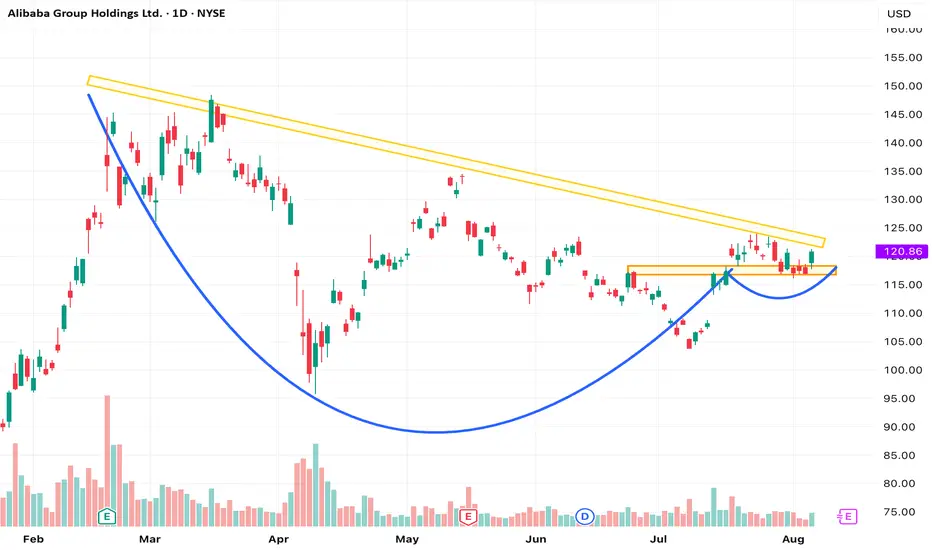
BABA – Cup and Handle Breakout with First HH/HLNYSE: BABA is forming a cup and handle pattern, with price breaking above the previous lower high, marking the first higher high and higher low in this potential trend reversal. Structure is turning bullish with momentum building.
Cup and handle pattern observed in premier energies Cup and handle pattern observed in premier energies.
1150 neckline
Target 350 points after breakout of neckline.
So enter the trade after 1170
Target will be 1500

BTC cup and handle: 128k soon?I see a nice cup and handle confirmed and broken up on the daily chart. If this is correct we could see 128k as a nice target. There’s still a resistance at 104k first, we’ll see after that.

GBPNZD: Another Bullish Wave Coming 🇬🇧🇳🇿
GBPNZD respected a strong rising trend line on a daily.
The price formed a cup & handle pattern on that
and violated its horizontal neckline yesterday.
I think that another up movement is ahead.
Goal - 2.26
❤️Please, support my work with like, thank you!❤️

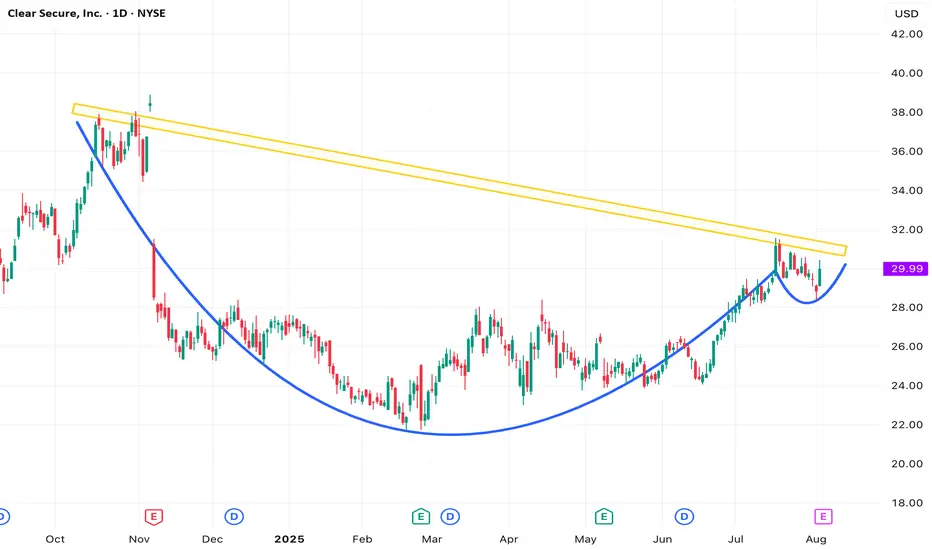
Clear Secure (YOU) - Who Loves the Cup and Handle Pattern?Classic Cup and Handle pattern forming — textbook shape, clean handle. Market's been consolidating nicely, now just waiting for that breakout spark. Will the bulls show up? Watching for volume surge and breakout confirmation.
Lemonade may be ready for a squeezeNYSE:LMND broke dramatically into overbought territory on the weekly chart earlier this year. It's taken understandable time to digest those gains and now looks like it could be building steam to revisit prices reached during that breakout.
The shorter term 4H chart, more suitable for entry and exit signals, illustrates a recent break above a cup and handle formation. That little pump appears to be consolidating rapidly.
Should the shorter term move find traction, the the weekly chart could provide a reasonable target as a trading range is formed for a larger move in the long run. A swing trade looks attractive at this point with potential 50% upside.

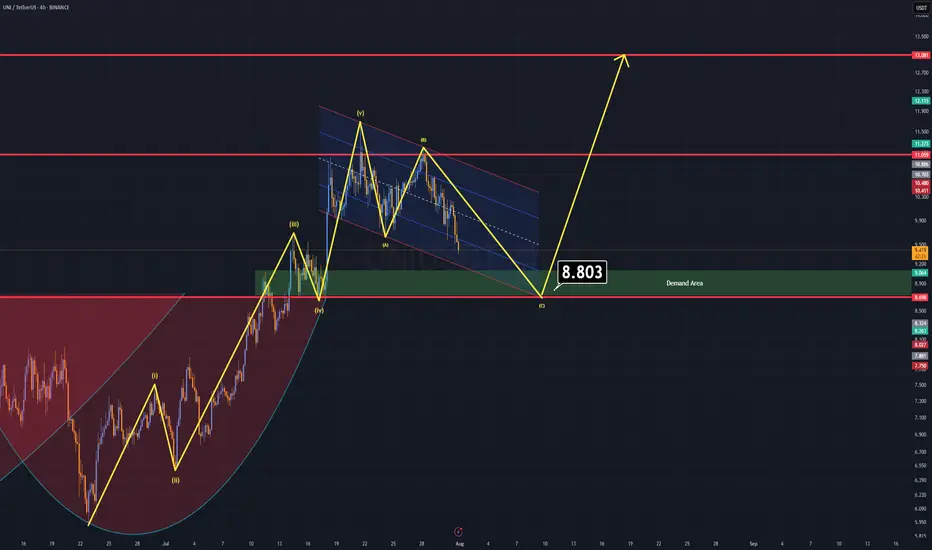
UNI Analysis (4H)UNI – Correction Might Bring Opportunity
Currently, UNI is forming an A–B–C corrective pattern, and based on technical structure, this correction may complete around the $8.8 level.
Key Zone to Watch: $9.0 – $8.5
There's a strong demand zone just below $9, supported by historical price action.
On the daily time frame, a broken cup & handle formation aligns perfectly with this area — the old neckline may now act as support, increasing the confluence.
This overlap of structure and demand makes the $9–$8.5 zone a favorable entry for a long position.
Once price reaches this area, expect a significant upward correction as part of the next move in the cycle.
Good Luck.
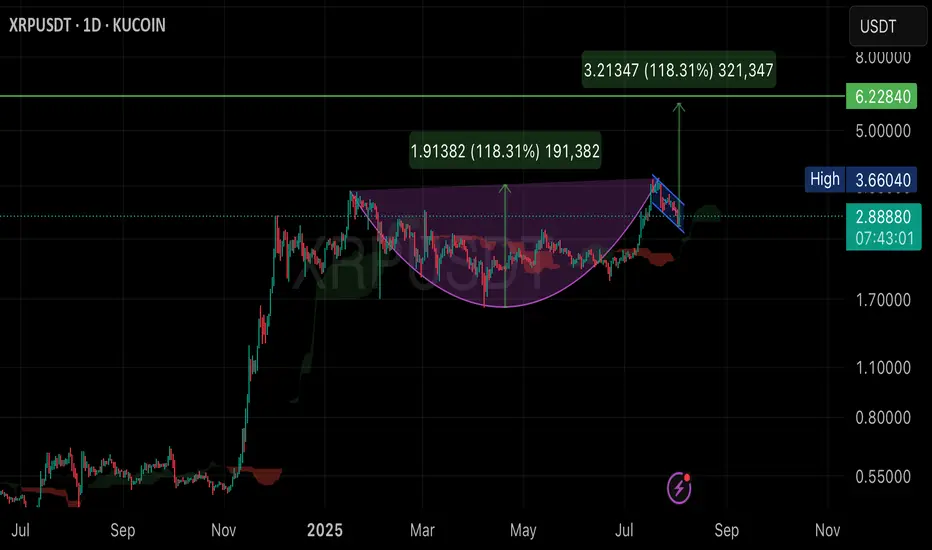
XRP doing Cup with handle pattern?technical analysis chart of the XRP/USDT using daily data (1D). Here are the main details:
• Cup and Handle Pattern: The chart displays a “cup and handle” formation, which is a bullish continuation pattern suggesting further upward movement. The rounded shape below represents the “cup” (running from roughly February to July 2025), and the small channel to the right is the “handle.”
• Target Price:
• The chart shows a projected breakout target from the handle region—from about 2.88 USDT to 6.22 USDT.
• The value 1.91382 (118.31%) is the measured move—calculated from the bottom of the cup to the neckline, then projected upwards from the breakout point.
• Another label, 3.21347 (118.31%), shows a similar projected percent gain (about 118.31%) from the breakout point.
• Support and Resistance Lines:
• Horizontal lines mark key levels, such as 3.66 (recent high) and 6.22 (target).
• Other Indicators:
• The chart uses a red moving average and Ichimoku cloud to highlight trend support and resistance zones.
• Current Status:
• The current price is 2.88881 USDT (up 4.30% on the day).
• A blue channel represents the consolidation phase before an anticipated breakout.
Summary:
This chart suggests that, if there’s a breakout from the “cup and handle” pattern as shown, the next target price for XRP is around 6.22 USDT, representing an estimated 118% gain from the breakout point. The analysis uses technical patterns and indicators to project possible future price movements.