PIOC - PSX - Technical AnalysisPIOC on monthly TF, after making a Cup & Handle pattern has started its bull run in June 2023 which is still going strong.
RSI is almost in the same region since Nov 2023 and therefore it points to somewhat constant and upward buying sentiments in this SCRIPT. Also on monthly TF there is a hidden bullish divergence, which may cause a sudden pumping up of the price.
As per AB=CD pattern TP can be 364 and as per Cup&Handle pattern, TP can be 404 which is even higher.
Trade values:
Buy-1 : 291 (CMP)
SL: 260
TP1: 364
TP2: 404
Cupandhandlepattern

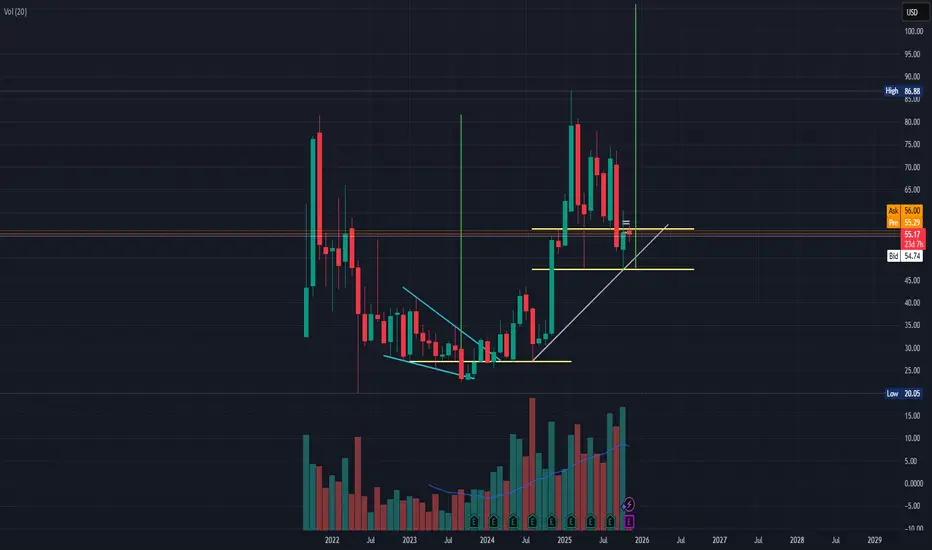
ZOOMing back to $160 $ZMZoom is already a solidly profitable, mid teens P/E on forward earnings and very strong gross margins versus large SaaS and tech peers.
Recent quarters have shown revenue growth reaccelerating from a low base.
Management has repositioned the company as a unified communications and AI centric platform
(ZOOM workplace, Phone, contact center, AI companion) broadening it's TAM beyond meetings and supporting upsell to existing enterprise customers.
Zoom has a strong balance sheet and robust free cash flow, which limits downside and offers buyback optionality.
#CupandHandle

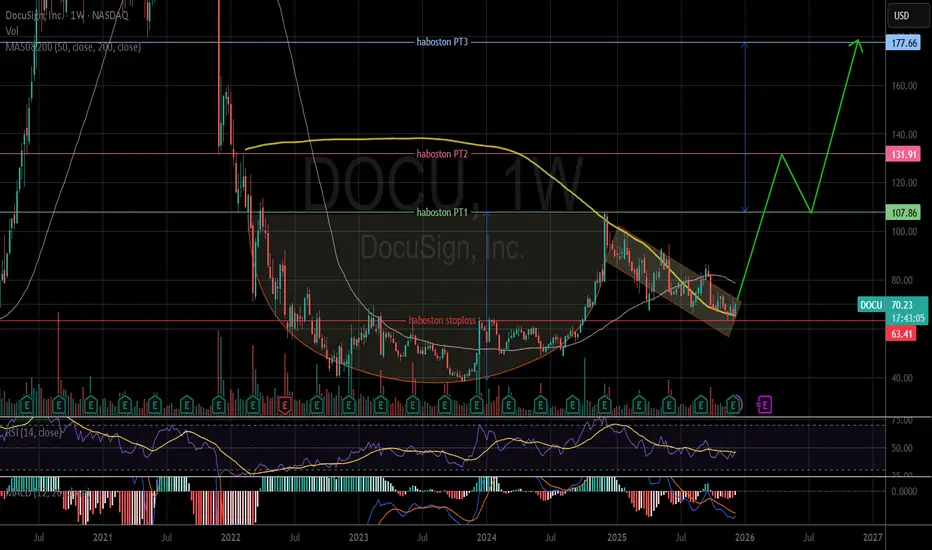
DOCU - Cup and Handle pattern on Weekly chartDOCU has completed a Cup and Handle pattern. Hopefully, a breakout will occur in the near future. This is a weekly chart, so it is suitable for long-term investment.
However, a stop-loss should still be considered because anything can happen.
The price closed today (12.11.2025) is $70.23.
Target $107.86/ $131.91/ $177.66.
Stop loss $63.41.
IMO, an amateur trader.
Good luck!
Sequent Scientific Approaching a Major Reversal LevelThis is the weekly timeframe chart of Sequent Scientific.
The stock is currently trading near the key support zone of 180–190 and is moving within a well-defined structure.
If this support zone holds, we may see a potential upside move towards the 280 and 300 levels.
Thank you.

JMIA Swing tradeReasoning:
Strong Industry/Sector
Cup with a handle
If Labelled a Swing trade(2-6 Week Holds)
Entry: Full position on breakout
Profit Taking: Sell 1/3 at Goal 1
Final Exit: Remainder at Goal 2
If labelled a long term trade (3-12 Month Holds)
Entry: Full position on breakout
Profit Taking: Sell 1/4 to 1/5 at Goal 1
Exit Signal: Close below 20-day EMA (your trend guide) or 50EMA
Why: Strong moves are hard to time at the top, but the 20EMA acts as a reliable trend filter
Note:
Remember: Every long-term investment alert can also be played as a swing trade.
I normally use half the risk that I show here, this is because I am okay re-entering if it fails and it gives a better R/R ratio

CUP AND A HANDLE - DAILY(For some reason, my published idea chart was blank… so I’m sharing it again)
As you can see there is a cup and a handle pattern forming.
At the same time RSI showing bearish divergence a strong one from the tops, and and weak one from the bodies, and price is showing a gap.
Now simply put, I can try and snipe it by waiting for a better entry after filling the gap, and perhaps cut losses at 18.15
OR as the last red candle has been denied by buyers (denied a lower price (wick)), you can enter now but tread lightly.
To me, with current market conditions, maybe I'll buy a little position, incase it went up, and add to the position to complete a full lot size (from cost basis amount) once it fills the gap.
Remember, the target price from a text books rule says it's the cup and a handle depth but from endpoint of the handle.
But to me, I'm a little worried with current market volatilities, mostly I'll take profit before it reaches full price target.
SILVER: The Mother of All Cup and Handles? 45-Year BreakoutThis analysis highlights what could be the most significant long-term technical pattern currently forming in the financial markets: a massive, multi-decade Cup and Handle formation on the silver/USD monthly chart.
The Cup (1980 – 2011)
The Cup began with the historic spike in 1980 and was completed with the rally to the same resistance level around $50 per ounce in 2011. This vast, 31-year, rounded consolidation zone represents a massive accumulation and basing phase.
The Handle (2011 – Present)
Following the 2011 peak, silver entered the "Handle" phase. This is the final consolidation period, characterized by price compression and sideways action below the key $50 resistance zone. This phase serves to shake out weak hands and build the energy required for a major long-term structural breakout.

Silver Cup and HandleAfter some consolidation silver has started showing immense strength. Silver is buy on dips. Take long positions in silver in any dip you get. Check the chart for the cup and handle pattern on the daily timeframe.
Support will be the low of the handle as seen on the chart for big risk takers and for small risk takers sl can be around 157000.
Target- One can look for all time highs as target and then 180000.
Disclaimer- This is just for educational purpose.
Jai Shree Ram

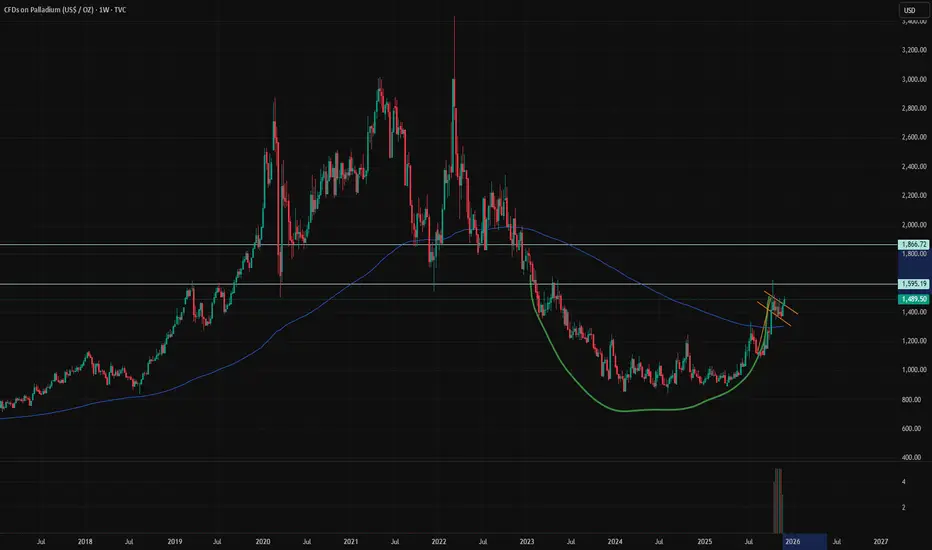
Cup & handle, bull flag - look for a breakoutCommodities are bullish right now if you didn't know.
Silver, Gold, Natural Gas, Palladium and more. They are all interesting right now. Commodities is the sector you should be looking at right now.
We had tech, weedstocks, cryptos, ai
now look for commodities for near term plays.
Speaking of Palladium, I love this chart. Beautiful.
We have a nice formation of a 2 year cup with a resistance at 1600$
Short term, we have near break out of bull flag at 1500$
The blue zone extending to may should be a zone where you have to keep close attention to this chart.
I'm expecting a breakout with target of 1870 ish on palladium. I'm early on this one, there is no breakout at the moment. I just follow the good sector and bet on the nice chart.
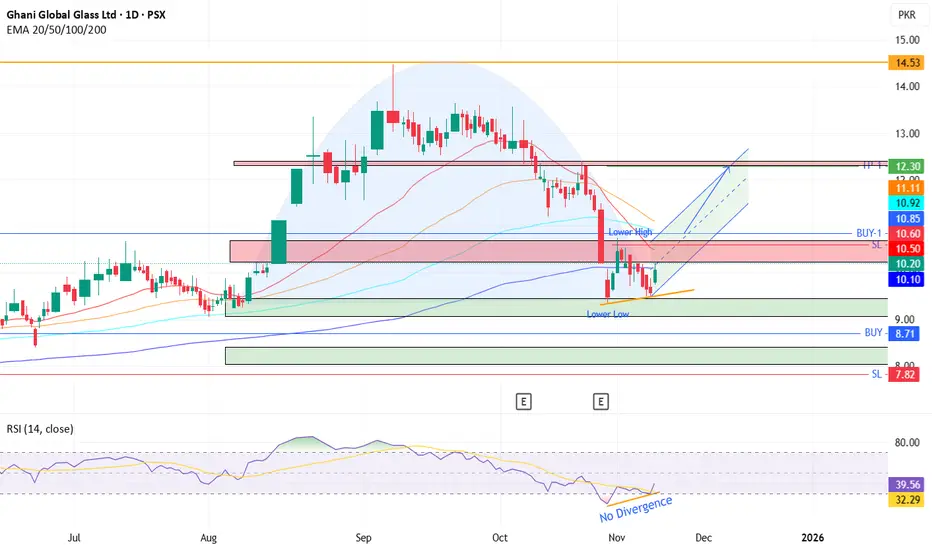
GGGL- PSX - Technical AnalysisOn daily time frame, GGGL has made an inverted Cup and now Handle is likely in the making as drawn.
On RSI there is NO bullish divergence. Hence price going up from the support level which can even continue down wards after a few days. Moreover, there is a resistance channel just above whereby price can be pushed down.
Technically, very correct entry is at BUY-1, after crossing the previous Lower High with TP around 12.30 and SL 10.60.
Perfect Cup and handle Pretty self explanatory here perfect cup and handle on Silver. Very Bullish
Happy Hunting - ND

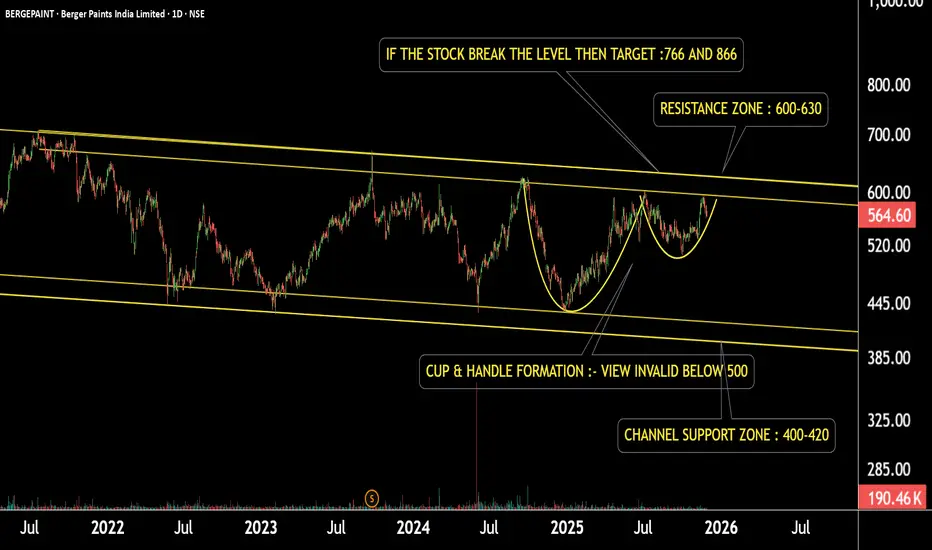
Berger Paints: Pattern Formation — Is This the BreakoutThis is the daily timeframe chart of Berger Paint.
The stock is moving within a well-defined channel and has formed a Cup & Handle pattern inside the structure.
If the pattern continues to hold and the price stays above ₹500, the pattern remains valid.
A breakout above the resistance may trigger potential upside targets of ₹766 and ₹866.
However, if the price fails and breaks below this zone, the stock may decline toward the channel support near ₹400.
Thank you.
Walt Disney (DIS) – Reversal Cup & Handle FormationOn the Daily timeframe, NYSE:DIS is forming a reversal cup and handle pattern.
The price is moving below both EMA 50 and EMA 100 , confirming short-term bearish momentum. The recent decline matches the depth of the previous cup’s widest part, indicating potential continuation toward the next strong support near $106.
If this support level breaks, the price could move down to test the psychological zone around $100 , and possibly fill the gap below it.

$NIO: Big move aheadNYSE:NIO seems to be forming a cup& handle pattern on the chart. The target of this pattern is 13$
After a harsh move to the downside NYSE:NIO is likley to test the blue colored SMA. This SMA has been strong resistance in the past, as shown in the chart. Now there is an opportunity to turn this SMA in to a support and push to complete the cup & handle pattern.
I imagine some consolidation before the big move.

EUR/JPY’s Coffee Break Before the Big Bull Run!Greetings, traders! Market Prophecy: Forecasting Breakouts, Not Birthdays!
Disclaimer: My trading strategy isn’t a signal—it’s more like a workout for my brain. I’m just here flexing my market structure knowledge and sharpening my trading skills while building my trade journal. Think of it as financial gym time—no personal trainers, just candlesticks!
Attention XXXJPY lovers
In the coming months, we’re about to witness some seriously interesting moves on the XXX/JPY pair. Don’t snooze on this — it could be your chance to turn charts into cash! As we all know, the Cup & Handle is a continuation pattern, and right now, it’s brewing like a perfect latte. After years of depositing, losing, winning, and hitting repeat like a broken playlist, I thought… why not share this trade idea so we can all sip profits together? Let’s make forex fun — and profitable!”
And to answer that PM asking why I do this on weekends when the market is sleeping?
Simple — because weekdays are like speed dating with pips. I’m too busy focusing on my trade plan and fixing those little flaws that sneak in like uninvited guests. Weekends? That’s my chill time with the charts — no drama, no price action,no breakout, no trendline just me and my candlesticks having a quiet coffee date.
“If you found this helpful, hit LIKE & COMMENT ❤️ Because every click saves a trader from staring at charts alone on a Saturday night.”

GBPUSD Brewing a Latte: Cup & Handle Special EditionWelcome to Market Prophecy..
The recent weekly decline in GBPUSD occurred because the price failed to break above the 1.37476 resistance level (marked in yellow) and dropped to 1.30375. If the price does not break below the 1.30375 daily support level, there is a strong likelihood that it will rebound and attempt to test the nearest resistance at 1.35639. Based on the projection I’ve drawn, there is a high probability that the price will form a cup-and-handle pattern on the weekly chart. Don’t miss the opportunity for a potential swing buy.
Good luck, everyone! And hey, don’t forget to smash that like button and drop your wildest market predictions in the comments! ❤️
Disclaimer: My trading strategy isn’t a signal—it’s more like a workout for my brain. I’m just here flexing my market structure knowledge and sharpening my trading skills while building my trade journal. Think of it as financial gym time—no personal trainers, just candlesticks!

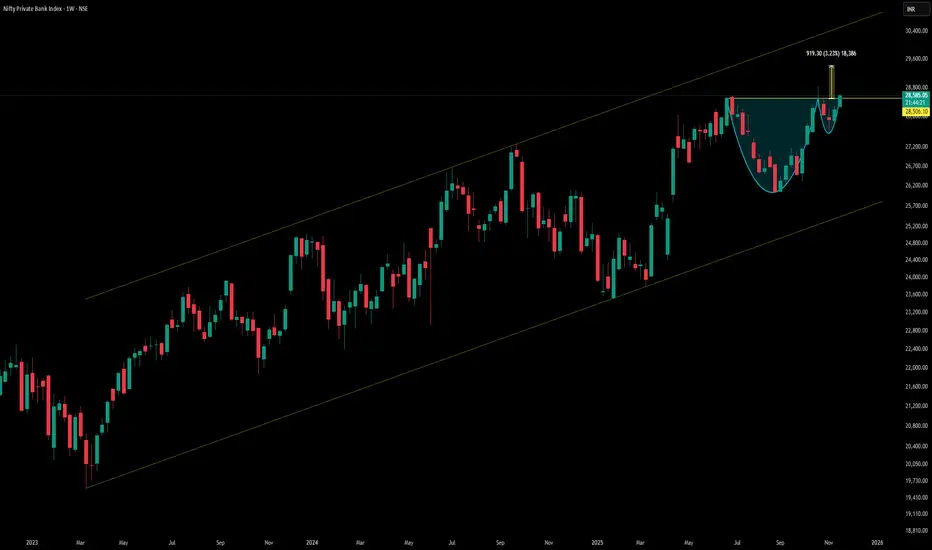
Nifty Private Bank confirms a classic Cup and Handle patternThe Nifty Private Bank chart shows a bullish Cup and Handle breakout — signaling upside in top private banks like HDFC Bank, ICICI Bank, Axis Bank, Kotak Mahindra Bank, and IndusInd Bank. These stocks are likely to lead the rally.
Cup: Rounded bottom formed over weeks/months, showing accumulation.
Handle: Shallow pullback or sideways drift, indicating consolidation before breakout.
Breakout: Above resistance with volume, projecting a 10.31% upside from the breakout level.
This setup is a strong bullish continuation signal, especially when backed by sector-wide momentum.
Top Nifty Private Bank Stocks to Watch
These are the official constituents of the Nifty
HDFC Bank & ICICI Bank: Largecap leaders with strong Q2 earnings and institutional flows.
Axis Bank & Kotak Bank: Showing breakout setups and improving loan growth.
IndusInd & IDFC First: Mid-tier banks with rising ROE and margin expansion.
⚠️ Disclaimer
This analysis is for educational purposes only and does not constitute investment advice. Market conditions can change rapidly, and chart patterns do not guarantee future performance. Please consult your financial advisor before making any investment decisions.
KRBL is Roaring — Is This the Breakout Moment?This is the weekly timeframe chart of KRBL.
The stock is showing strong price movement accompanied by increasing volume. If this volume continues to rise, KRBL may break above its key level and complete the Cup & Handle pattern.
The major pattern resistance lies in the 480–490 zone.
If the current rally sustains, we may witness higher price levels in KRBL.”
Thank You !!

Perfect Setup: Thyrocare Cup and Handle | Long-Term WealthSTRONG BUY Setup 🏥
Entry: ₹1,490-1,510 (Current Level)
Target 1: ₹1,557-1,570
Target 2: ₹1,611-1,630
Target 3: ₹1,665-1,685
Target 4: ₹1,750-1,800+ (Extended - Cup Depth Target)
Stop Loss: ₹1,400
Technical Rationale:
PERFECT CUP AND HANDLE PATTERN forming on Weekly Chart (educational diagram shown)
Massive multi-year Cup formation (pink shaded area) from 2021 highs
Handle consolidation currently forming near 1,400-1,500 range
Strong +7.15% surge today breaking above handle resistance
Volume at 2.82M - strong for weekly timeframe
Price breaking above descending trendline (black line)
Trading above both pink trendlines - bullish reversal confirmed
RSI around 60-65 - healthy momentum with room for upside
Healthcare/Diagnostics sector fundamentally strong
Cup depth: ~1,500 to bottom (~400) = ~1,100 points
Measured move: 1,500 base + 1,100 depth = 2,600 target (long-term)
Multiple resistance levels: 1,557, 1,611, 1,665
Clear support at handle base: 1,400
Risk-Reward: EXCEPTIONAL 1:10+ ratio for full cup target
Pattern: CUP AND HANDLE on WEEKLY Chart - one of the most powerful and reliable bullish continuation patterns in technical analysis
Strategy: Long-term positional/investment (months to year+)
Book 15% at T1 (1,565), 15% at T2 (1,620), 15% at T3 (1,675)
Hold remaining 55% for major target 2,000-2,600
Trail SL to 1,500 after crossing T1
Key Levels:
Handle Support (Critical): 1,400 - MUST HOLD
Cup Rim Resistance: 1,500-1,520 (breaking now)
Strong Resistance: 1,557, 1,611, 1,665
Extended Targets: 1,800, 2,000, 2,200-2,600
Major Support: 1,400, 1,350
Timeframe: WEEKLY chart - this is a MAJOR long-term investment setup (6-18 months)
Cup & Handle Characteristics:
✅ Cup: Multi-year rounded bottom (2021-2024) - ✓
✅ Handle: Consolidation at rim (current) - ✓
✅ Volume: Decreasing in handle, increasing on breakout - ✓
✅ Depth: Significant (1,100 points) - ✓
✅ Breakout: Occurring now with volume - ✓
Volume Analysis: 2.82M weekly is substantial, confirming breakout authenticity
Sector: Healthcare/Diagnostics - Thyrocare is major diagnostic chain, secular growth story
Measured Move Calculation:
Disclaimer: For educational purposes only. Not SEBI registered.
Cup bottom: ~400
Cup rim: ~1,500
Depth: 1,100 points
Target: 1,500 + 1,100 = 2,600 (100%+ upside potential)
Conservative target: 1,800-2,000 (50-70% upside)

Solana Cup w/ HandleFor some reason everyone is bearish on SOL right now.
Breakpoint coming up.
Falling Wedge for the handle.
I'll see you at $400 bears.

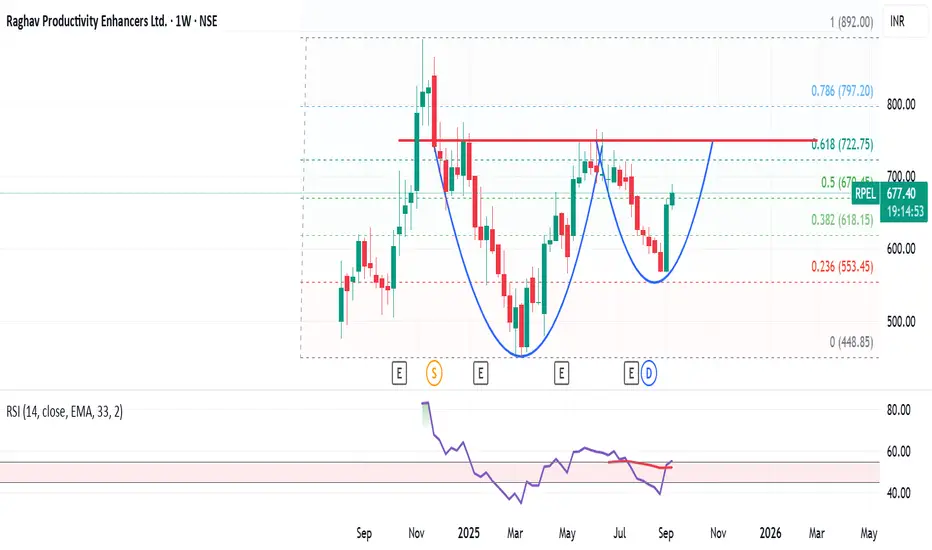
Cup n Handle pattern will work?Let's see if Cup n Handle pattern give some movement to this unknown stock. PE vs ROCE is not good, but technical pattern is showing some promise
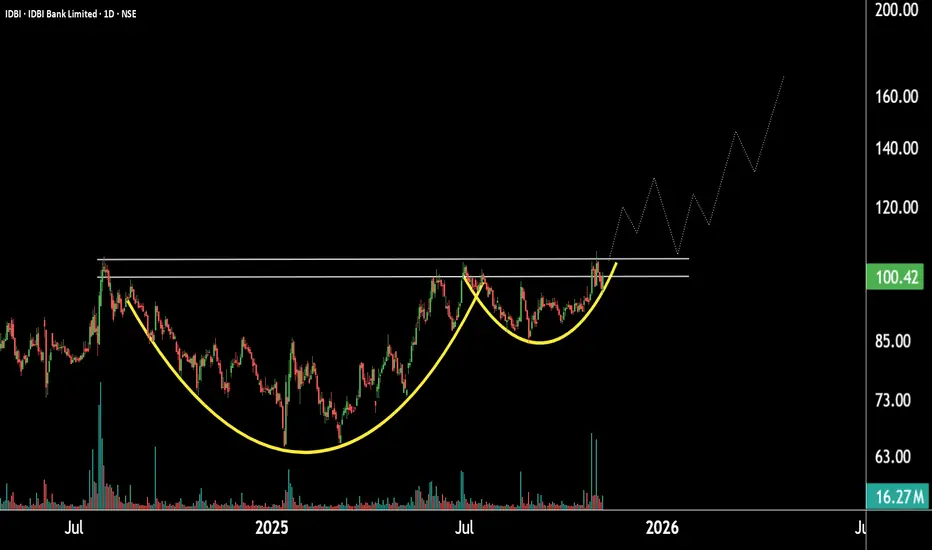
Cup And Handle Formation In IDBI Could Trigger MomentumThis is the daily timeframe chart of IDBI Bank.
The stock is forming a Cup and Handle pattern on the daily timeframe, with a strong support zone near the 90–95 range. If the current rally continues and the stock breaks out of this pattern, it may move toward the 130 level, followed by 165.
If the support zone holds, IDBI Bank could witness higher prices in the coming sessions.
Thank you.
Cup & Handle - BROS (Monthly Chart)As you can see in the monthly chart of BROS, a cup and handle pattern is forming.
The price target of a cup and a handle is the depth of the cup but starting from the the handle's ending candle.
In this graph, you can see that I'm using a little conservative price target: the price target is not from the end of the handle, rather from the support around 47.
That is because the cup depth from the handle would give us 100%+, and though I like such results, I'm a little conservative when it comes to trades of above 50% gain, regardless of trade length (and it's more of personal risk management and it works for me but maybe someone else can see this as a clear sign of consistent buying until PT).
Fundamentally, the earning of 5-Nov-2025 after market, shall play a huge role in succeeding the completion of the cup and handle price target.
My short term price target is 62, and the reason for that is the 20-Aug-2025 and 15-Sep-2025 role reverse from support to resistance (Daily Chart), and considering BROS volatility, it's conservative, yet, risky in nature.
My medium term target is 77.5 which is the highest from the body candle from the left of the cup and handle and not the second one of 79.16, and again, the reason for this is because I want to take a more conservative approach as BROS volatility may hurt high risk-intolerant traders.
The long term target is 105 due to the cup and handle depth.
Generally, I'm a high risk trader. However, with current market conditions and the current phase of uncertainty in U.S. equities due to government shutdown and volatile policies (especially tariffs), one might want to seek more conservativeness in their trading.
That being said, BROS is fundamentally one of the best growth stories I've analyzed. Revenues, earnings, cash management and funding, operational execution, etc., combined they check out the marks of a good investment. Yet, also fundamentally, it has a lot of optimism priced in, and as of this writing, we are confronting investors fears from the current uncertainty, high valuations, and profit taking period. we might see some selling pressure after a strong hike (assuming positive/expectations beat in earnings) due to profit taking and uncertainty. It has a very high valuation comparing to its peers, yet, it also has great growth comparing to its peers...
Not a financial advise, just a guy behind a screen.
Please do not hesitate to share your opinions, as long as it's logical.