DXCM WCA -Cup and Handle Company: Dexcom Inc.
Ticker: DXCM
Exchange: NASDAQ
Sector: Health Technology
Introduction:
Our technical analysis today concentrates on Dexcom Inc. (DXCM), a prominent name in the Health Technology sector, listed on the NASDAQ. A potential Cup and Handle pattern, serving as a reversal formation, has been forming on the weekly chart, suggesting a promising setup for bullish traders.
Cup and Handle Pattern:
The Cup and Handle pattern typically emerges during a period of consolidation, signifying a potential bullish reversal or continuation. It's recognized by a "cup" formation, followed by a smaller "handle".
Analysis:
Previously, Dexcom was experiencing a clear downward trend, represented by the blue diagonal line. However, the trend appears to be changing, with the price now consolidating in a Cup and Handle pattern. Though the handle's size is slightly larger than the norm, the well-defined horizontal resistance at 125.58 lends credibility to the pattern's significance.
The price is standing above the 200 EMA, confirming a bullish environment. If the price breaks above the horizontal resistance, it could present an excellent opportunity for a long position. The subsequent price target is projected at 184.24, indicating a potential upside of approximately 46.69%.
Conclusion:
The weekly chart of Dexcom reveals an interesting Cup and Handle pattern, hinting at a potential bullish reversal. As such, this setup could provide a favorable long trading opportunity.
Disclaimer: This analysis is not financial advice and is intended for educational purposes only. Always do your own research and consult with a financial advisor before making investment decisions.
If you found this analysis helpful, please consider liking, sharing, and following for more insights. Wishing you profitable trading!
Best regards,
Karim Subhieh
Cupandhandlepattern

Radix cup and handle formation(?)In my opinion it seems Radix has started forming a cup-and-handle formation. It's very early to predict the pattern so let's (wait and) see what the price will do the upcoming weeks. When the pattern is confirmed it's definitely a bullish sign. Then you can draw a line from the bottom of to the upper part of the "cup". Take that distance and put it at the point of the outbreak to see what's the target. When I'm doing this calculation, XRDUSD token-price has a target of approximately $0.23.
We'll see what the future will bring us. I'm still saying that much will depend how the whole crypto-market, especially BTC, will develop in the (near) future. That will be the leading indicator for the altcoins, like Radix, as well. Purely looking at the Radix project; I'm very bullish for the long term

multi-bagger alert: tatamotorsjust found a cup and handle patteren in monthly timeframe.
if it broke out, it should go a little above 1000 rs. if the price reversed from resistance. it should fall back to 450 levels.
do your own analysis before jumping in.

GEDYH DCA - Cup and Handle Company: Gedik Yatirim Menkul Degerler
Ticker: GEDYH
Exchange: BIST
Sector: Financials
Introduction:
Welcome to our weekly technical analysis, where today we're focusing on Gedik Yatirim Menkul Degerler (GEDYH), listed on the BIST in the Financials sector. The weekly chart showcases a Cup and Handle formation, suggesting a bullish continuation.
Cup and Handle Pattern:
A Cup and Handle pattern is a bullish continuation pattern that marks a period of consolidation followed by a breakout. It's characterized by a "cup" - a round, bowl-like pattern, and a "handle" - a small bearish channel or consolidation, following which a breakout occurs.
Analysis:
GEDYH's chart demonstrates a clear Cup and Handle formation over the course of 833 days. This pattern often indicates a bullish continuation, signaling potential for growth. The price is convincingly above the 200 EMA, further emphasizing the bullish environment and a preference for long setups.
The horizontal resistance is established at 8.23 TRY. If we witness a breakout above this level, we could potentially initiate a long position. The price target, following a successful breakout, is set at 12.78 TRY, representing an estimated gain of approximately 55.83%.
Conclusion:
GEDYH's weekly chart presents an interesting Cup and Handle formation, suggesting a potential bullish continuation. This analysis should be part of a comprehensive market research and risk management strategy.
Please note, this is not financial advice and investing always carries risk.
If you found this analysis helpful, please consider liking, sharing, and following for more insights. Wishing you profitable trading!
Best regards,
Karim Subhieh

BEARDSELL- LOOKS SUPER ATTRACTIVE FOR LONGHello Friends,
Here we had shared possible Elliot wave counts of BEARDSELL LTD (NSE), which is Showing that we are currently in impulse wave in which we have completed Wave ((1)) and ((2)) of some degree and now we are in wave ((3)) in which we have completed wave (1) and (2) and currently we are unfolding wave (3) and again in which we have completed wave 1 and 2 and are going to unfold wave 3 of wave (3) of wave ((3))
Stock also gave the breakout of cup and handle pattern which also giving bullish bias and All the supporting indicators are also having bullish bias for this stock in dual time frame of which snapshots are mentioned below.
overall Elliot wave structure shows that stock has completed corrective WAVE ABC as flat correction in 3-3-5 waves which expanded till 1.618 fib levels and currently we are in impulse wave.
current scenario of Elliot
Cup and Handle chart pattern
stock went sideways after giving breakout of cup and handle pattern on 28th july 2022, and recently on 25 may 2023 stock again gave breakout of downward sloping trendline with good intensity of volume
Price challenging upper bollinger bands
price is trading above 50DEMA, 100DEMA and 200 DEMA
MACD in daily time frame
MACD in weekly time frame
RSI in daily time frame
RSI in weekly time frame
overall the scenario for BEARDSELL LTD is showing bullish bias
Disclaimer
I am not SEBI registered analyst
please consult your financial advisor before taking investing decision
i am not responsible for any kinds of your profits and losses.

$BTCUSDT Price is range bound.Bitcoin price is range bound. Adam and Eve double bottom, possible Cup & Handle pattern; 4h. Set new alerts.
Bull fractal: 28096.39
Bear fractal: 27571.11
Target 1: 28433.17
Target 2: 28861.94

Ingersoll Rand Inc WCA - Cup and HandleCompany: Ingersoll Rand Inc.
Ticker: IR
Exchange: NYSE
Sector: Industrials
Introduction:
In today's technical analysis, we turn our attention to Ingersoll Rand Inc. (IR), a key player in the Industrials sector, listed on the NYSE. The weekly chart is demonstrating a potential Cup and Handle formation, a well-known bullish reversal and continuation pattern. This pattern has developed over a period of 553 days, suggesting a possible breakout on the horizon.
Cup and Handle Pattern:
This Cup and Handle pattern is a bullish continuation pattern that occurs during an uptrend and represents a period of consolidation followed by a breakout. It is characterized by a "cup" formation, followed by a smaller consolidation period called the "handle."
Analysis:
Previously, IR's chart was showing a clear uptrend, indicated by the green dashed line. Now, we are witnessing a consolidation phase that appears to take the form of a Cup and Handle pattern.
The horizontal resistance is at $60.51, and the price is comfortably above the 200 EMA, signaling a bullish environment. A breakout above this resistance level could be a potential entry point for a long position.
However, this setup also presents a unique condition, a natural breakout filter, in the form of a secondary resistance level at $62.33. A convincing breakout would ideally surpass both these resistance levels.
The potential price target, if both resistance levels are broken, is set at $81.63, signifying an upside of approximately 35% from the breakout level.
Conclusion:
IR's weekly chart reveals an interesting setup with a potential Cup and Handle pattern. This could suggest a continuation of the previous bullish trend. This setup is currently a watchlist candidate and not a direct trading recommendation.
As always, this analysis should be used as part of your comprehensive market research and risk management strategy. Please remember, this is not financial advice and investing always involves risk.
If you found this analysis helpful, please consider liking, sharing, and following for more insights. Wishing you profitable trading!
Best regards,
Karim Subhieh

Cup and Handle Breakout by 2025?: Bitcoin, Gold and Silver ReadyThrough meticulous analysis, the three charts displayed side by side present a captivating comparison between silver ( TVC:SILVER XAGUSD), gold ( TVC:GOLD XAUUSD), and Bitcoin ( BNC:BLX BTCUSD). Spanning from the 1970s to the present day, these charts provide a comprehensive view of the remarkable journeys undertaken by these assets.
The first two charts depict the price movements of silver and gold over the course of five decades, while the third chart illustrates the relatively short but remarkable trajectory of Bitcoin since its inception in 2010. What immediately catches the eye is the astonishing pace at which Bitcoin has achieved in just 13 years, what took silver and gold a staggering 53 years to accomplish.
However, the most striking aspect that commands attention is the unmistakable presence of a colossal "cup and handle" pattern, poised to complete its formation within the next two to four years. This pattern has been dissected into five distinct phases, revealing intriguing similarities across all three commodities.
1/ The initial phase witnessed a rapid surge in prices for all three assets, setting the stage for what was to come.
2/This was followed by a minor correction before another sharp increase in price.
3/ Subsequently, a prolonged period of slow and gradual correction ensued, testing the patience of investors.
4/ However, this was eventually followed by a steady bull phase, characterized by sustained upward momentum.
5/ As the cycle neared completion, another corrective phase emerged, followed by a steady rise once again. (Note: This phase is marked by a smaller cup and handle forming within the larger cup and handle, with completion at around the same time).
The question that naturally arises is: what lies ahead? Will there be a breakout to the upside after the completion of the cup and handle formation, expected to materialize within the next two to three years? The simultaneous indication of such a breakout across all three commodities is undeniably intriguing and warrants further exploration.
Furthermore, as we examine the intriguing cup and handle formations across silver, gold, and Bitcoin, it is crucial to take into account the profound shifts occurring in the global economic landscape. The traditional dominance of the petrodollar is facing significant challenges, with emerging trends indicating a potential end to its reign. BRICS nations, for instance, are increasingly engaging in domestic currency transactions, bypassing the need for the U.S. dollar as a medium of exchange.
The advent of Central Bank Digital Currencies (CBDCs) across numerous nations have introduced a new dimension to the evolving financial ecosystem. As these digital currencies gain traction, they have the potential to reshape the dynamics of international trade and cross-border transactions. This transition towards CBDCs further underscores the changing paradigm of global finance.
However, it is important to acknowledge the mounting tensions and conflicts that permeate the geopolitical arena. Wars, both physical and cyber, as well as potential hacking scandals between nations, have the capacity to disrupt and fracture the fabric of the current economic climate. These events have the potential to cause significant fluctuations in financial markets, including the prices of silver, gold, and Bitcoin.
When analyzing the broader financial and economic landscape, it is essential to consider the interplay between political developments, economic policies, technological advancements, and market dynamics. Geopolitical shifts and power realignments among nations can have far-reaching implications for asset valuations and investor sentiment.
In conclusion, as we explore the cup and handle formations in silver, gold, and Bitcoin, we must recognize the wider context of global transformations. The potential demise of the petrodollar, the growing influence of domestic currency transactions among BRICS nations, the rise of CBDCs, and the geopolitical tensions reshaping the world order are all factors that can significantly impact the future trajectory of these commodities. It is within this intricate interplay of forces that we seek to discern the catalysts that will drive potential breakouts and subsequent price movements. As the global economic landscape continues to evolve, adaptability and astute analysis remain essential for navigating the uncertainties and seizing opportunities in the ever-changing financial markets.
Disclaimer: Keep in mind that market predictions are about as reliable as a weather forecast in outer space. Use this analysis as a conversation starter, not as financial advice. Investing in cryptocurrencies carries risks, so do your homework and make informed decisions. Remember, no crystal balls here—just a pinch of insight and a dash of caution

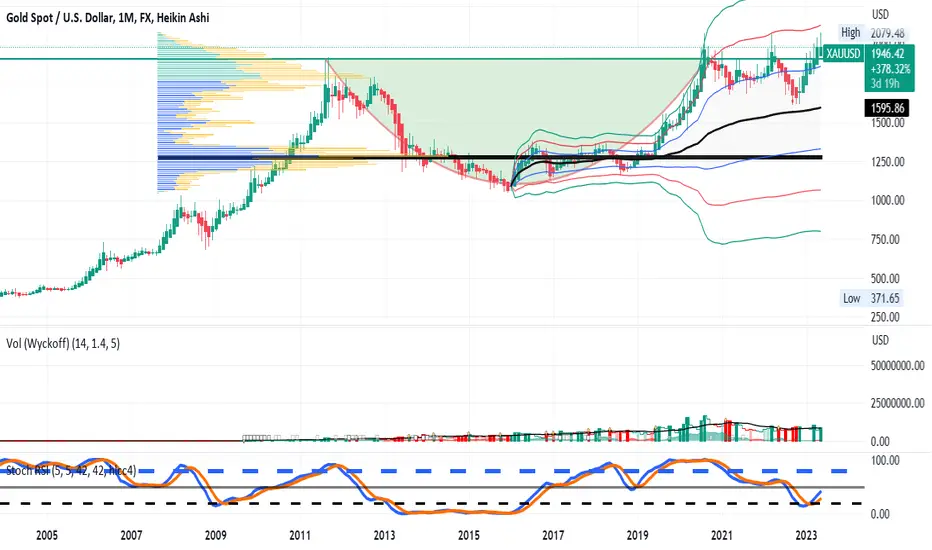
Spot Gold - Does a Chart Pattern suggest a Roadmap?On the monthly chart over the past 12-15 years, XAUUSD appears to have printed a cup and
handle pattern now with the price above the trigger for bullish continuation. Trading volumes
have persistently increased over the years but especially since COVID. Perhaps central banks
are gradually accumulating and hedging the challenges to fiat currency. Since the cup height is
about $ 850 and the width is about ten years, the pattern might predict a gold price rise from
$1950 + $850 = $2800 over a period of half the cup width or five years. Fundamentals
including geopolitical and macroeconomic events trump any technicals. The stochastic RSI
shows spot gold at the lows right now. The long-term volume profile suggests the most trading
volume was at about $1295 over the visible ( POC line) Price being well above that line is
a bullish bias overall. The long-term anchored VWAP originating at the cup base shows gold
price is currently one standard deviation above the mean VWAP band, making it high in the
fair value zone. Gold supply/mining may be fairly linear with increasing production costs
such as labor, energy, and others subject to inflation. Gold demand may be rising as the chart
shows rise rising above the POC line and into higher VWAP bands. The combination of increased
mining costs and gold demand perhaps increasing at more than linear points toward the
the potential of rising prices moving forward.
USD/JPY can ascend further🌟The USDJPY is in a Bullish phase by reaching a PRZ zone
🌟 Bullish signals are:
- Bullish Cup & Handle
- Dynamic Support zone
- Pivot R1 weekly
- Ascending Triangle
⭐ Note if the PRZ is broken downwards with the strength of Bearish candles from bottom Of the PRZ zone , this analysis of ours will be failed.
⏮️Previous Analysis⏮️
✅If this post was useful for you, like it ❤️ and if you think it is useful for your friends, be sure to send it to them.
_ _ _ _ _ _ _ _ _ _ _ _ _ _ _ _ _ _ _ _ _ _ _ _ _ _ _ _ _ _ _ _ _
🌍Thank you for seeing idea .
Have a nice day and Good luck.

LTC Long Term LTC Bullish for long term. Cup and Handle pattern is still valid in weekly chart.
Best time to enter --- Today!

CMCSA DCA - Cup and HandleCompany: Comcast Corporation
Ticker: CMCSA
Exchange: NASDAQ
Sector: Communication Services
Introduction:
Greetings, and welcome to today's technical analysis. We're focusing on the daily chart of Comcast Corporation (CMCSA), highlighting a bullish reversal pattern known as a cup and handle that has formed over 294 days.
Cup and Handle Pattern:
The cup and handle pattern is often a bullish continuation or a bullish reversal signal and is characterized by a 'U' shape (the cup) followed by a smaller, downward drift (the handle). The formation is complete when the asset's price breaks above the resistance line marking the top of the handle.
Analysis:
Comcast Corporation's price was previously in a downtrend, denoted by the blue diagonal resistance line. This downward movement appears to have been interrupted by the cup and handle pattern. The horizontal resistance line of this pattern is located at $40.94, with the price currently having a second breakthrough.
Notably, the 200 EMA is above the price, suggesting a bullish market environment.
Upon a successful breakout, the projected price target is $53.50, offering a potential rise of 30.70%. Therefore, a long position might be considered.
Conclusion:
The daily chart of Comcast Corporation presents an interesting scenario, with the formation of a cup and handle pattern suggesting a potential bullish reversal. With the successful breakout above the pattern's resistance this presents an opportunity for a long position.
As always, please bear in mind this analysis does not constitute financial advice. It's vital to conduct your own research and consider risk management strategies when investing.
If you found this analysis insightful, please like, share, and follow for more updates. Happy trading!
Best regards,
Karim Subhieh


16 year breakout Long year breakout creating new high look at chart somthing indicating cup with handle pattern


GIGM DCA - Cup and Handle PatternCompany: GigaMedia Limited
Ticker: GIGM
Exchange: NASDAQ
Sector: Technology
Introduction:
Hello everyone, today we are focusing on GigaMedia Limited (GIGM), analyzing its Daily scale chart on the NASDAQ exchange. The price chart has caught our attention due to the formation of a bottom pattern, specifically, a cup and handle, which has been developing over the past 270 days.
Cup and Handle Pattern:
The cup and handle pattern is typically a bullish reversal pattern signifying a period of consolidation followed by a breakout. As the name suggests, it resembles a cup with a handle.
Analysis:
GigaMedia's price chart has been in a downtrend, as indicated by the blue diagonal resistance line. However, the formation of a cup and handle pattern suggests a potential reversal of this trend. The price is currently attempting to surpass the 200 EMA, and the horizontal resistance stands at $1.62.
If a breakout above this resistance level occurs, a long position could be considered. Our projected price target in this case would be $2.12, which corresponds to a potential price increase of approximately 30.74%.
Conclusion:
The daily chart for GigaMedia Limited suggests a potential bottom reversal with the formation of a cup and handle pattern. A breakout above the pattern's resistance could present a viable long position opportunity.
As always, remember to conduct your own research and consider your risk management strategies before making investment decisions.
Thank you for tuning into this analysis. If you found it informative, please like, share, and follow for more updates. Happy trading!
Best regards,
Karim Subhieh

TRHC WCA - Cup and Handle Pattern Company: Tabula Rasa HealthCare, Inc.
Ticker: TRHC
Exchange: NASDAQ
Sector: Healthcare
Introduction:
Hello, traders and investors! Today we are analyzing Tabula Rasa HealthCare Inc (TRHC) on the weekly scale chart. We'll specifically be observing a classic price pattern known as a cup and handle, which may serve as a bottom reversal.
Cup and Handle Pattern:
The cup and handle is a reversal pattern that can act as bullish continuation aswell. It signifies a period of consolidation followed by a breakout. It resembles the shape of a tea cup and can indicate a strong buy signal when correctly identified.
Analysis:
Tabula Rasa's price chart was previously characterized by a clear downtrend, represented by a blue diagonal resistance line. Now, it seems to be forming a cup and handle pattern with a clear horizontal resistance at $6.51.
However, the 200 EMA is currently pointing towards a bearish environment, which raises some doubts about a bullish setup. Despite this, a breakout above the horizontal resistance could open up the possibility of a long position, albeit with a smaller position size due to the current bearish indication.
In the event of a valid breakout, our estimated price target stands at $10.80. This corresponds to a potential increase of approximately 66.24%. Thus, Tabula Rasa HealthCare qualifies as a watchlist candidate, albeit one that requires caution.
Conclusion:
The weekly chart for Tabula Rasa HealthCare Inc reveals a potential cup and handle pattern, which may serve as a bottom reversal. However, the current bearish environment suggested by the 200 EMA calls for caution. A valid breakout above the pattern's resistance could offer a long position opportunity.
As always, please conduct your own due diligence and consider risk management strategies before making any trading decisions.
Thank you for joining this analysis. If you found it useful, please like, share, and follow for more market insights. Happy trading!
Best regards,
Karim Subhieh

xauusd (gold)---> two long positionshello guys...
xauusd is in a bullish trend, why?
the cup and handle pattern
there is an ascending channel and breaking up that once
a hunting level on the opposite side (the green area)
breaking up the last higher high
now, what we should do?!
in my opinion, there are two scenarios,
the first one is to get a long position after the price breaking up the handle
the second one is when the price retraces to the green area and then get a long position, it up to you!
____________________________
always do your research.
If you have any questions, you can write them in the comments below, and I will answer them.
And please don't forget to support this idea with your likes and comment

BTC Cup & Handle with Inverse H&SWe saw a breakout candle with volume of the H&S confirming the pattern. Wide cup forming. According to O'Neil, handles should last around 4 weeks and drop up to 15%. We exceed the 15% momentarily but hey, this is Bitcoin. Handle pattern is invalidated if it breaks the pattern to the downside or essentially sees a new low. A breakout of the channel and then a breakout of the previous high around 31,000 would be extremely bullish with a price target around $44,000. Please rate this TA. Thanks.

(GRMN) DCA - A Bullish Cup and Handle BreakoutCompany: Garmin Ltd.
Ticker: GRMN
Exchange: NYSE
Sector: Technology
Introduction:
Greetings and welcome to today's technical analysis post. Today, we're looking at the daily chart of Garmin Ltd. (GRMN) on the NYSE, featuring a distinctive Cup and Handle pattern acting as a bottom reversal.
Cup and Handle Pattern:
A Cup and Handle pattern is a bullish continuation or reversal pattern that signifies a period of consolidation followed by a breakout. It looks like a cup with a handle on the right side. The 'cup' is a curved u-shape, while the 'handle' is a slight downward drift.
Analysis:
The GRMN chart presents a Cup and Handle pattern that has been forming for 276 days, and is easily recognizable to classic chart pattern analysts. The breakout from this pattern has already occurred, which suggests a potential entry point for traders. Moreover, the price is trading above the 200-day EMA, which supports a bullish setup.
Conclusion:
The Garmin Ltd. daily chart analysis highlights a clear Cup and Handle breakout, a bullish signal for the stock. As always, please remember that trading based on chart patterns should be done in conjunction with sound risk management and proper position sizing.
Please note that this analysis does not constitute financial advice. Always conduct your own due diligence when trading or investing.
If you found this analysis helpful, please consider liking, sharing, and following for more. Happy trading!
Best regards,
Karim Subhieh

I Cannot cannot Short This !!! situation+next targets.The USDJPY is in a Bullish phase by Ascending Triangle & Cup & Handle.
🌟 Bullish signals are:
- Bullish Cup & Handle
- Dynamic Support zone
- Pivot S1 weekly
- Ascending Triangle
❗ and the Upward signals of market momentum are:
- The Bottom of the Bollinger band
⭐ Note if the Triangle or cup & handle is broken downwards with the strength of Bearish candles, this analysis of ours will be failed.
✅If this post was useful for you, like it ❤️ and if you think it is useful for your friends, be sure to send it to them.
_ _ _ _ _ _ _ _ _ _ _ _ _ _ _ _ _ _ _ _ _ _ _ _ _ _ _ _ _ _ _ _ _
🌍Thank you for seeing idea .
Have a nice day and Good luck.

Cintas Corporation (CTAS) - A Cup of Potential ReturnsCompany: Cintas Corporation
Ticker: CTAS
Exchange: NASDAQ
Sector: Industrials
Introduction:
Greetings and welcome to this analysis. Today, we are analyzing the weekly chart of Cintas Corporation (CTAS), containing a potential Cup and Handle pattern, indicating a bullish continuation, has formed.
Cup and Handle Pattern:
This Cup and Handle pattern is a bullish continuation pattern that marks a consolidation period followed by a breakout. In this case, we've observed a well-defined Cup and Handle over the course of 504 days.
Analysis:
Cintas Corporation's chart shows a clear Cup and Handle pattern, with horizontal resistance at $461.58. The price seems to have breached this level, but we'll need to wait for the weekly candle's close to confirm. If confirmed, this could present an immediate buying opportunity.
All of this action is happening above the 200 EMA, indicating a bullish environment. The projected price target, should the breakout be confirmed, stands at $579.10, signifying a potential rise of 25.5%.
Conclusion:
The weekly chart of Cintas Corporation portrays a well-defined Cup and Handle pattern, suggesting potential for bullish continuation. Traders should monitor the weekly candle close to confirm the breakout above the horizontal resistance level.
As always, this analysis is not financial advice. Prioritize risk management and proper position sizing in all trading decisions.
If you found this analysis useful, please like, share, and follow for more updates. Happy trading!
Best Regards,
Karim Subhieh

