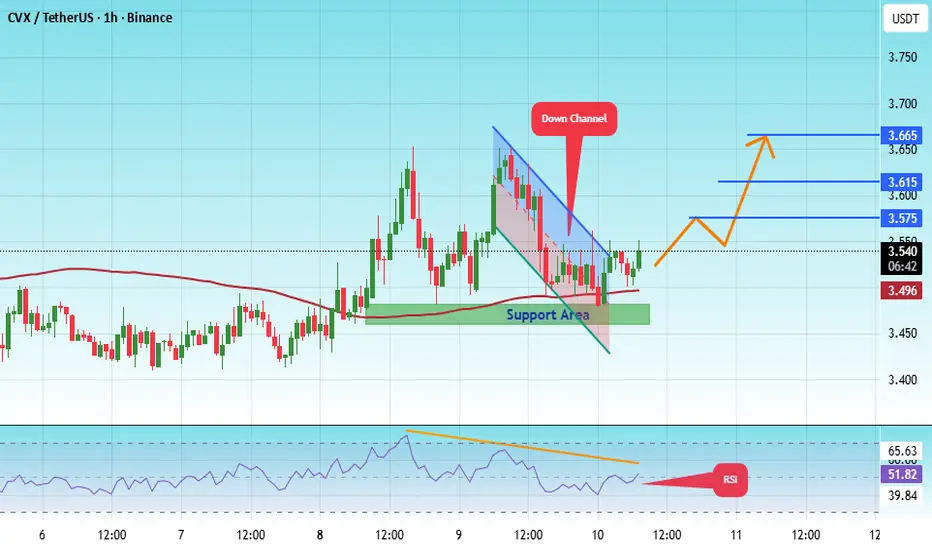
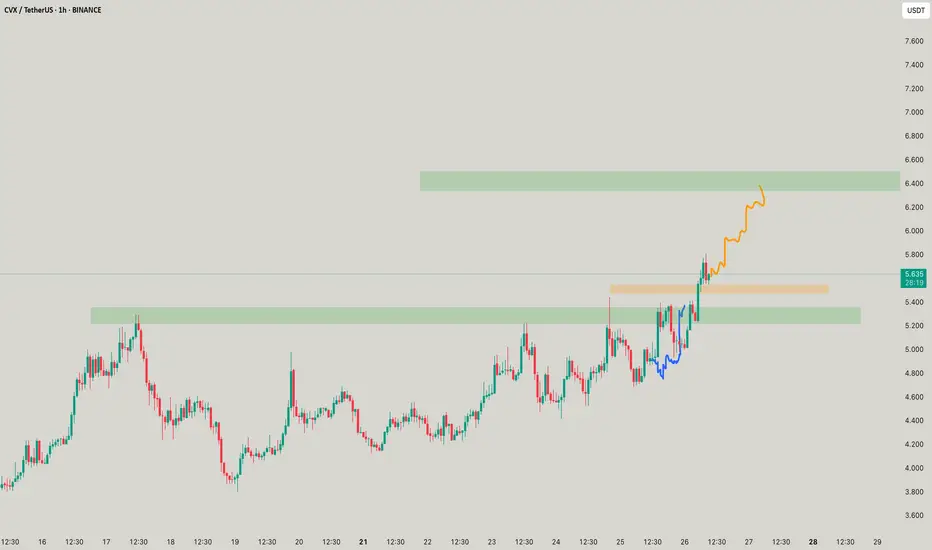
#CVX/USDT : Long-Term Breakout Signals Massive Upside Potentia#CVX
The price is moving within a descending channel on the 1-hour frame, adhering well to it, and is heading for a strong breakout and retest.
We have a bearish trend on the RSI indicator that is about to be broken and retested, which supports the upward breakout.
There is a major support area in green at 3.47, representing a strong support point.
For inquiries, please leave a comment.
We are in a consolidation trend above the 100 Moving Average.
Entry price: 3.52
First target: 3.57
Second target: 3.62
Third target: 3.66
Don't forget a simple matter: capital management.
When you reach the first target, save some money and then change your stop-loss order to an entry order.
For inquiries, please leave a comment.
Thank you.
CVX
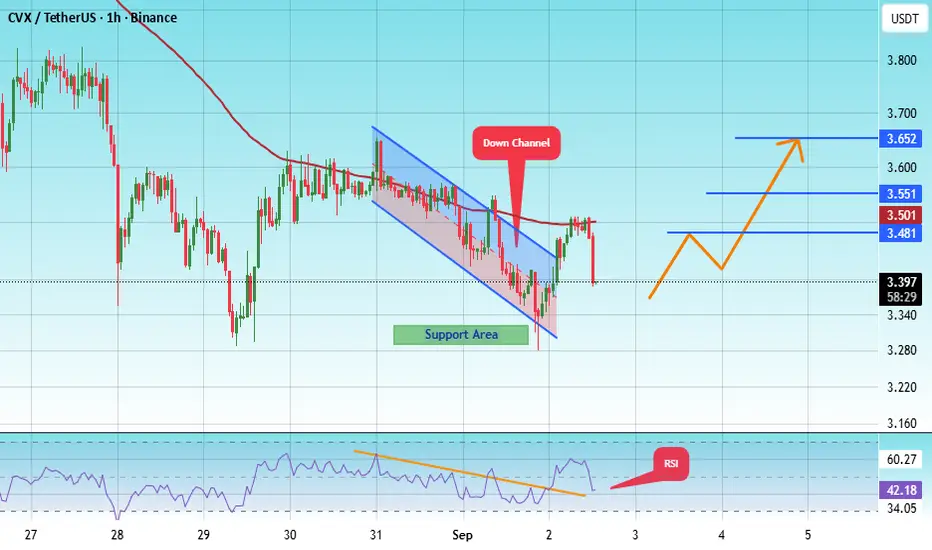
#CVX/USDT : Long-Term Breakout Signals Massive Upside Potential#CVX
The price is moving within a descending channel on the 1-hour frame, adhering well to it, and is heading for a strong breakout and retest.
We have a bearish trend on the RSI indicator that is about to be broken and retested, which supports the upward breakout.
There is a major support area in green at 3.35, which represents a strong support point.
For inquiries, please leave a comment.
We are in a consolidation trend above the 100 Moving Average.
Entry price: 3.49
First target: 3.49
Second target: 3.55
Third target: 3.62
Don't forget a simple matter: capital management.
When you reach the first target, save some money and then change your stop-loss order to an entry order.
For inquiries, please leave a comment.
Thank you.

#CVX/USDT : Long-Term Breakout Signals Massive Upside Potential
#CVX
The price is moving within a descending channel on the 1-hour frame and is expected to break and continue upward.
We have a trend to stabilize above the 100 moving average once again.
We have a downtrend on the RSI indicator that supports the upward move with a breakout.
We have a support area at the lower boundary of the channel at 3.30, acting as strong support from which the price can rebound.
We have a major support area in green that pushed the price upward at 3.27.
Entry price: 3.39.
First target: 3.47.
Second target: 3.55.
Third target: 3.65.
To manage risk, don't forget stop loss and capital management.
When you reach the first target, save some profits and then change the stop order to an entry order.
For inquiries, please comment.
Thank you.
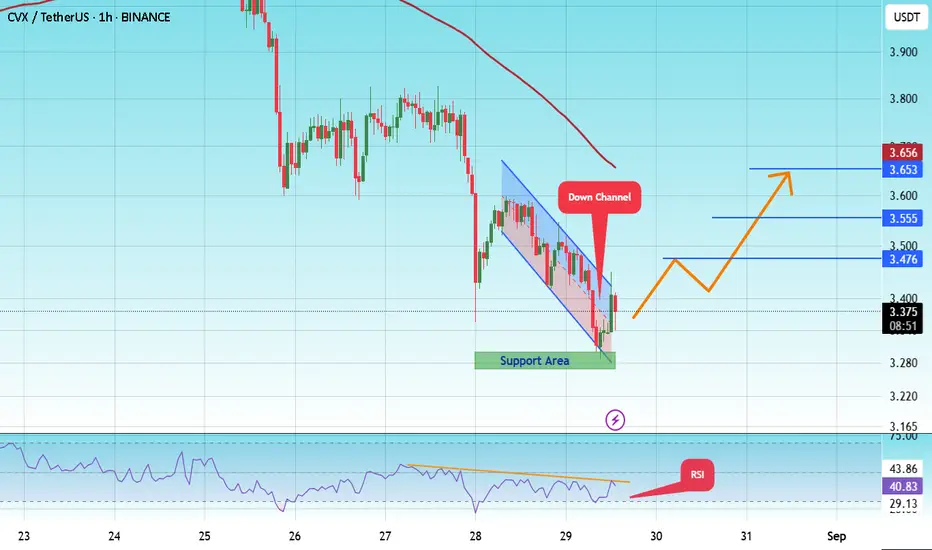
#CVX/USDT : Long-Term Breakout Signals Massive Upside Potential#CVX
The price is moving within a descending channel on the 1-hour frame and is expected to break and continue upward.
We have a trend to stabilize above the 100 moving average once again.
We have a downtrend on the RSI indicator that supports the upward move with a breakout.
We have a support area at the lower boundary of the channel at 3.30, acting as strong support from which the price can rebound.
We have a major support area in green that pushed the price upward at 3.27.
Entry price: 3.34.
First target: 3.47.
Second target: 3.55.
Third target: 3.65.
To manage risk, don't forget stop loss and capital management.
When you reach the first target, save some profits and then change the stop order to an entry order.
For inquiries, please comment.
Thank you.
#CVX/USDT - Get your civix straight again!#CVX
The price is moving within an ascending channel on the 1-hour frame, adhering well to it, and is on its way to break it strongly upwards and retest it.
We have support from the lower boundary of the ascending channel, at 3.90.
We have a downtrend on the RSI indicator that is about to break and retest, supporting the upside.
There is a major support area in green at 3.80, which represents a strong basis for the upside.
Don't forget a simple thing: ease and capital.
When you reach the first target, save some money and then change your stop-loss order to an entry order.
For inquiries, please leave a comment.
We have a trend to hold above the 100 Moving Average.
Entry price: 4.19
First target: 4.33
Second target: 4.51
Third target: 4.73
Don't forget a simple thing: ease and capital.
When you reach the first target, save some money and then change your stop-loss order to an entry order.
For inquiries, please leave a comment.
Thank you.

The key is whether it can rise above 5.886.
Hello, fellow traders!
If you "Follow" me, you'll always get the latest information quickly.
Have a great day.
-------------------------------------
I don't necessarily recommend coins (tokens) that exhibit this behavior.
However, if you have spare funds or have or can generate significant profits from other coins (tokens), I think it's worth looking into these coins (tokens) when they're ready to trade.
The key is to maintain the price above the M-Signal indicator on the 1M chart.
-------------------------------------
(CVXUSDT 1M Chart)
CVX is showing signs of rising above the M-Signal indicator on the 1M chart.
If the price remains above the M-Signal indicator on the 1M chart, the upward trend is likely to continue.
-
(1W Chart)
After a prolonged period of sideways movement, the HA-Low and HA-High indicators on the 1W chart have converged, and the price has risen above the M-Signal indicator on the 1M chart.
Therefore, the 2.862-3.412 range is considered a support area.
If it falls below the 2.862-3.412 range, you should stop trading and wait and see how things go.
The DOM (60) indicator is forming at 5.886, so a break above this level is highly likely to initiate a stepwise uptrend.
Therefore, the key question is whether it can find support near 4.116 and rise above 5.886.
-
(1D chart)
The key question is whether it can find support in the 4.418-4.902 range and rise.
You should observe the transition from the M-Signal on the 1D chart > the M-Signal on the 1W chart > the M-Signal on the 1M chart.
If the M-Signal indicators are aligned correctly, a full-scale uptrend is likely to begin.
-
Thank you for reading to the end.
I wish you successful trading.
--------------------------------------------------
- Here's an explanation of the big picture.
(3-year bull market, 1-year bear market pattern)
I'll explain more in detail when the bear market begins.
------------------------------------------------------

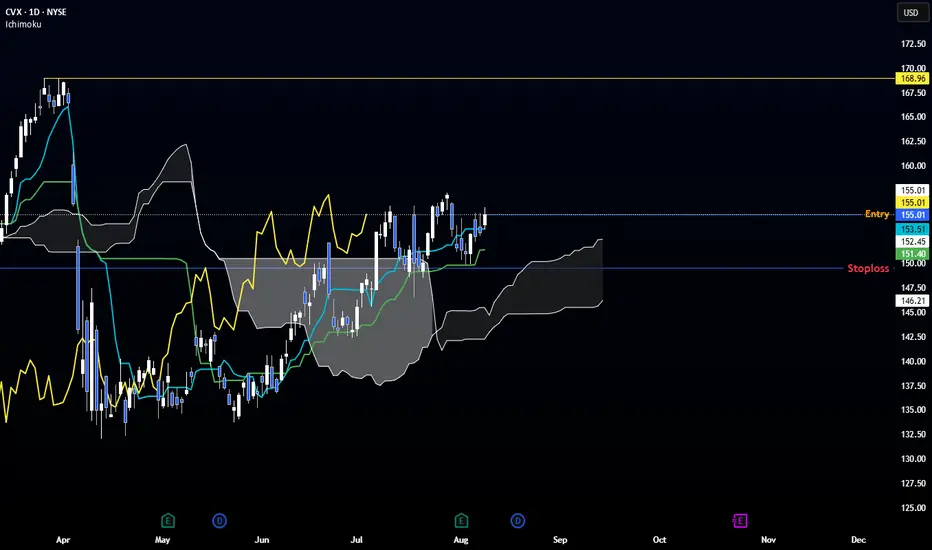
CVX – Ichimoku Bullish Setup
📈 Technical Outlook
☁ Kumo: Large & supportive. Span A flat (pause), Span B bullish.
🔹 Tekan-sen: Broken to downside.
🔹 Kijun-sen: Bounce & pointing up → trend strength.
📍 Chikou Span: Above price → bullish confirmation.
💡 Bias → High probability of upside continuation.
📊 Trade Plan
Entry: 155.01
Stop Loss: 149.55 (below last swing low)
Take Profit: None – trail SL at each new swing low
🎯 Potential Target Zone: 168.96 (major resistance)
⚠ Risk Management
This setup follows Ichimoku principles—let winners run, cut losses early.
Not financial advice. Trade at your own risk.
CVX Earnings Trade Setup — August 1, 2025
## 🚨 CVX Earnings Trade Setup — August 1, 2025 🚨
🔍 **Chevron (CVX) Earnings Analysis | High Conviction Call Play**
### 🧠 Model Consensus (Multi-LLM Blend)
* 📉 **Revenue Trend:** -1.0% TTM growth, margin pressure from falling oil
* 📈 **Analyst EPS Expectation:** \$11.04 with 26.2% YoY growth est.
* ⚠️ **Miss Rate:** 50% EPS beats w/ average surprise -2.2%
* 💬 **Consensus Sentiment:** ⚖️ *Moderate Bullish (Confidence: 60%)*
---
### 🔥 Options Heatmap
* 🟢 **Most Active Call:** \$152.50 strike, 🔥 ask volume at 152
* 🔺 **IV Rank:** 63% → *Moderate move expected*
* 🧊 **Put/Call Skew:** Defensive bias with light bullish divergence
* 🕵️♂️ **Dark Pool:** Mild accumulation hints by institutions
---
### 📉 Technical Breakdown
* 🔹 Near 50/200 MA — Neutral Pre-Earnings Drift
* 🔸 Support: \$150 | Resistance: \$155
* 🔻 Volume: 0.53x avg → *Weak conviction*
---
## 🎯 TRADE SETUP
🛠️ **Strategy:** Long Call (Pre-Earnings Entry)
💰 **Strike:** \$152.50
📅 **Expiry:** 2025-08-01
💸 **Entry Price:** \$3.70
🧠 **Profit Target:** \$11.10+ (200–300%)
🛑 **Stop Loss:** \$1.85
📊 **Risk/Reward:** \~2.5:1
🕓 **Exit Timing:** 1–2 hrs post-earnings (to avoid IV crush)
---
### 🧪 Earnings Catalyst Trade
Chevron’s setup shows a **classic low-volume/high-upside IV play**. Risk tightly managed with a defined stop, but room for explosive move if earnings surprise to upside.
---
📦 **Trade JSON Snapshot:**
```json
{
"instrument": "CVX",
"direction": "call",
"strike": 152.50,
"expiry": "2025-08-01",
"confidence": 60,
"profit_target": 11.10,
"stop_loss": 1.85,
"size": 1,
"entry_price": 3.70,
"entry_timing": "pre_earnings_close",
"earnings_date": "2025-08-01",
"earnings_time": "AMC",
"expected_move": 5.0,
"iv_rank": 0.63,
"signal_publish_time": "2025-08-01 13:05:25 UTC-04:00"
}
```
---
📈 **#OptionsFlow #CVX #EarningsPlay #TradingViewSetups #LongCall #EnergySector #IVCrushProtection #PreEarningsTrade**

CVX - Get your civix straight again!CVX i posted, did went but wasn't powerful! Now the prowess says it if moves to the red, big moves can come up in a better ways! you can expect

CVX - It asks for you to be civic!SO 6.5 ! when? soon? soon when? if it doesnt breaks the orange, though looks ripe to get the orange one
CVX/USDT Weekly Analysis — Strong Reversal Zone CouldTechnical Analysis:
1. Strong Demand Zone (Key Reversal Area)
CVX price has repeatedly tested a strong support zone around $1.43 – $2.20 (highlighted in yellow). This area has acted as a major accumulation zone, showing strong buyer interest and serving as a critical base support.
2. Potential Double Bottom Formation (Bullish Reversal Pattern)
A potential Double Bottom or Adam & Eve pattern is forming within this demand zone — a classic bullish reversal structure, indicating a possible trend shift to the upside.
3. Key Resistance Levels (Bullish Targets):
$2.90 – Minor resistance, likely to be tested in the short term.
$3.46 – Significant psychological and technical resistance.
$4.98 – Major resistance and neckline of the double bottom pattern.
$6.76 – Strong weekly resistance, a potential medium-term target.
$15.77 & $47.97 – Long-term targets if a macro bullish trend emerges.
Bullish Scenario:
If the price holds above the $2.20 support zone:
Gradual upward movement expected toward $2.90 → $3.46 → $4.98.
A confirmed breakout above $4.98 could trigger a rally toward $6.76.
Full bullish confirmation would occur if the price breaks and holds above $6.76, indicating a longer-term trend reversal.
Bearish Scenario:
If price breaks down below the $1.43 support level with a weekly close:
The double bottom structure would be invalidated.
Price could enter new price discovery territory, potentially heading below $1.00.
Market sentiment would turn significantly bearish.
Strategic Conclusion:
CVX/USDT is currently at a critical decision point. A strong historical support zone suggests a high potential for bullish reversal. Confirmation of the bullish structure requires a breakout above $4.98. However, caution is needed if price breaks below $1.43, as it may indicate structural failure.
#CVXUSDT #ConvexFinance #CryptoAnalysis #DoubleBottom #ReversalPattern #BullishSetup #AltcoinAnalysis #SupportResistance #CryptoBreakout #TechnicalAnalysis

#CVX best zone for make some money SOON ?#CVX
The price is moving within a descending channel on the 1-hour frame, adhering well to it, and is heading for a strong breakout and retest.
We are experiencing a bounce from the lower boundary of the descending channel. This support is at 2.30.
We have a downtrend on the RSI indicator that is about to be broken and retested, supporting the upside.
There is a major support area in green at 2.23, which represents a strong basis for the upside.
Don't forget a simple thing: ease and capital.
When you reach the first target, save some money and then change your stop-loss order to an entry order.
For inquiries, please leave a comment.
We are in a consolidation trend above the 100 Moving Average.
Entry price: 2.41
First target: 2.46
Second target: 2.55
Third target: 2.65
Don't forget a simple thing: ease and capital.
When you reach your first target, save some money and then change your stop-loss order to an entry order.
For inquiries, please leave a comment.
Thank you.

RIG Mega Profits SecuredRIG is a high beta oil stock. We secured profits today and looking for another entry.
With the recent breakout and upside momentum in oil, this name caught a massive bid.
Crude oil has seen a sharp rise in just the last week and shaping up for a continuation move higher.
If this breakout holds energy stocks should continue to fly.
WTI has its first major resistance level coming up within 1% from current price.
Look for pullback buys in energy if oil continue to hold the inverse head & shoulder breakout.

#CVX/USDT#CVX
The price is moving within a descending channel on the 1-hour frame, adhering well to it, and is heading towards a strong breakout and retest.
We are experiencing a rebound from the lower boundary of the descending channel, which is support at 2.644.
We are experiencing a downtrend on the RSI indicator that is about to be broken and retested, supporting the upward trend.
We are heading towards stability above the 100 Moving Average.
Entry price: 2.730
First target: 2.800
Second target: 2.860
Third target: 2.924

#CVX/USDT#CVX
The price is moving within a descending channel on the 1-hour frame, adhering well to it, and is heading for a strong breakout and retest.
We are seeing a bounce from the lower boundary of the descending channel, which is support at 2.97.
We have a downtrend on the RSI indicator that is about to break and retest, supporting the upward trend.
We are looking for stability above the 100 Moving Average.
Entry price: 3.30
First target: 3.43
Second target: 3.59
Third target: 3.77

CVXUSDT 1D AnalysisCVX ~ 1D Analysis
#CVX Buy back on retest of this support block with short term target of at least 10%+ from here.
#CVX/USDT#CVX
The price is moving within a descending channel on the 1-hour frame and is expected to break and continue upward.
We have a trend to stabilize above the 100 moving average once again.
We have a downtrend on the RSI indicator, which supports the upward move by breaking it upward.
We have a support area at the lower limit of the channel at 3.00, which acts as strong support from which the price can rebound.
Entry price: 3.14
First target: 3.26
Second target: 3.42
Third target: 3.58

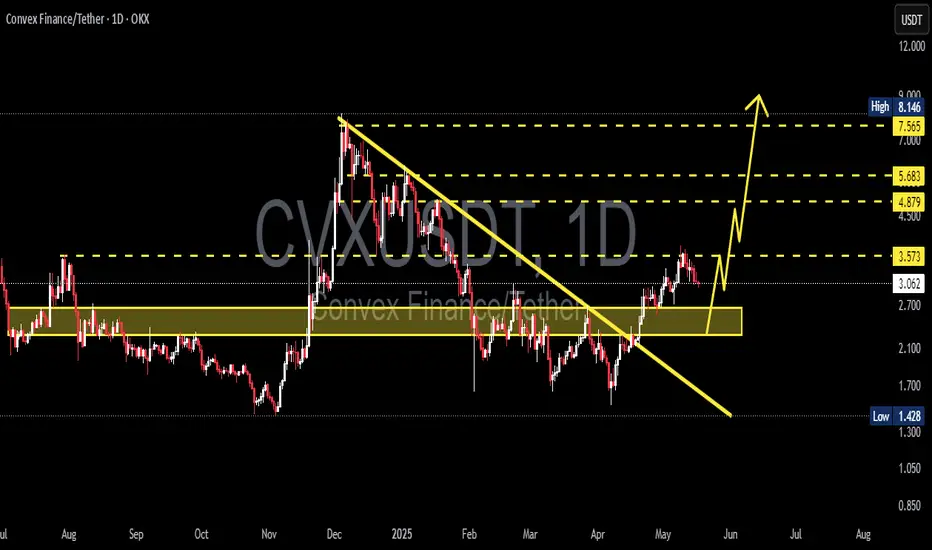
Convex Finance (CVX) Rectangle (1W)BINANCE:CVXUSDT has been trading in a rectangle with well-defined boundaries since January 2023, and it has recently reclaimed the 1-year EMA, potentially shifting the bias to bullish.
Key Levels to Watch
• $1.5-$2.0: Main demand zone and invalidation point for any bullish TA if broken
• $3.0: 1-year EMA, successfully reclaimed and retested as support
• $4.4: Rectangle midline, previously relevant as a S/R
• $6.1-$7.2: Main supply zone and upper boundary of the rectangle
• $13.0: Previous swing high and rectangle breakout target, which would be confirmed by a weekly close above $7.2 with good volume

#CVX/USDT#CVX
The price is moving within a descending channel on the 1-hour frame, adhering well to it, and is heading for a strong breakout and retest.
We are seeing a bounce from the lower boundary of the descending channel, which is support at 2.98.
We have a downtrend on the RSI indicator that is about to break and retest, supporting the upward trend.
We are looking for stability above the 100 Moving Average.
Entry price: 3.05
First target: 3.14
Second target: 3.24
Third target: 3.36

CVX demand zone!OptionsMastery:
🔉Sound on!🔉
📣Make sure to watch fullscreen!📣
Thank you as always for watching my videos. I hope that you learned something very educational! Please feel free to like, share, and comment on this post. Remember only risk what you are willing to lose. Trading is very risky but it can change your life!

#CVX/USDT#CVX
The price is moving within a descending channel on the 1-hour frame and is expected to break and continue upward.
We have a trend to stabilize above the 100 moving average once again.
We have a downtrend on the RSI indicator that supports the upward move with a breakout.
We have a support area at the lower limit of the channel at 2.72, which acts as strong support from which the price can rebound.
Entry price: 2.83
First target: 2.90
Second target: 2.97
Third target: 3.06

CVX Chevron Corporation Options Ahead of EarningsIf you haven`t sold CVX before the retracement:
Now analyzing the options chain and the chart patterns of CVX Chevron Corporation prior to the earnings report this week,
I would consider purchasing the 125usd strike price Puts with
an expiration date of 2025-9-19,
for a premium of approximately $5.55.
If these options prove to be profitable prior to the earnings release, I would sell at least half of them.
Disclosure: I am part of Trade Nation's Influencer program and receive a monthly fee for using their TradingView charts in my analysis.
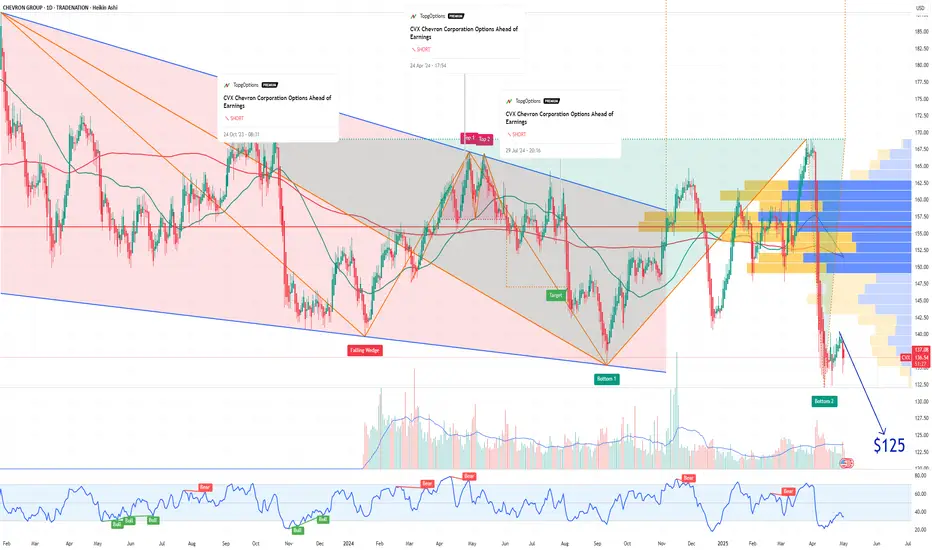
Chevron: The Chart’s Reaching a Critical PointChevron is starting to look very interesting again — but let’s be clear from the start: Chevron, like every oil giant, lives and dies by the price of oil. If oil rips higher or collapses due to global politics, supply shocks, or economic chaos, Chevron NYSE:CVX follows. No exceptions.
That said, what we’re seeing on the chart right now is increasingly pointing toward a deeper correction — specifically down to the $113–$100 zone. That would make sense structurally as a Wave 4 retracement.
But there’s a technical nuance here. Wave 1’s high sits at $103 — and depending on how strict your Elliott Wave rules are, Wave 4 dipping into Wave 1 is bad territory. Personally, I’m okay with a brief touch into that range, but I don’t want to see price hanging around below $103 for long.
From a trend perspective, we’re clearly in a downward channel. We just saw a textbook bull trap:
Chevron broke out with a solid +7% move over two weeks,
Followed immediately by a massive 22% drop,
One of the sharpest two-week declines since — yeah — March 2020, pandemic levels.
Now, price is hovering around $130, and the setup is simple:
If this level holds, great — maybe we’re bottoming.
If it breaks, I’m looking to buy between $113 and $100. That’s where the structure aligns, the volume kicks in, and risk/reward starts to make sense again.
So here’s the real question:
Do we see $200 first — or $100?
I’m leaning $100 first.
Not because I’m bearish long-term— but because that level would clean up the chart, shake out the noise, and give us a real shot at riding the next strong leg higher with conviction.
Would love to hear what you think — where’s your bet?
