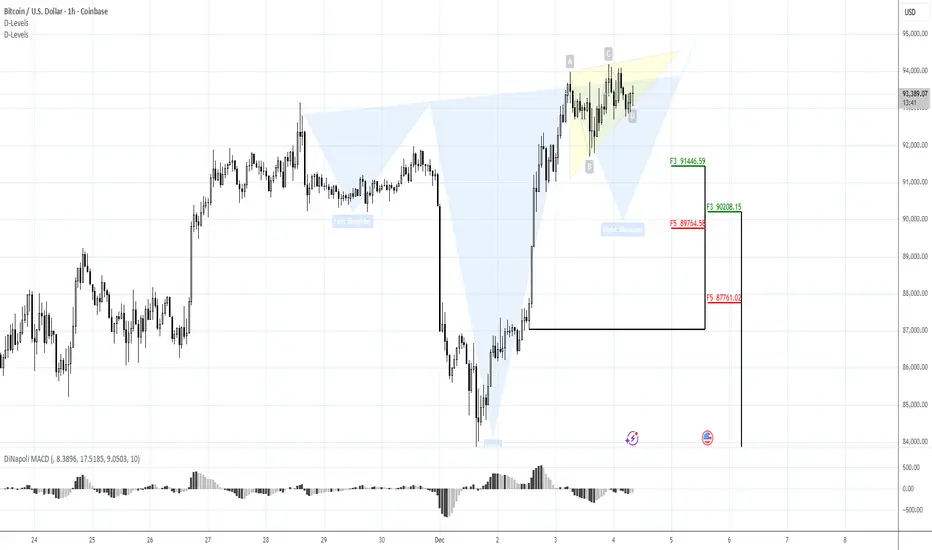
BTC 90K SEEMS INTERESTING FOR ENTRYMorning folks,
So, once our bearish trade was over, market turns to AB=CD upside shape, that we intend to follow. 97K is rather strong resistance, so we consider 96.5K as the nearest upside target. BTC shows nice acceleration, so, it has not bad chances to proceed.
For entry we intend to use reverse H&S shape on 1H chart. 90K area looks interesting now for potential long entry...
Daily Charts
SILVER - The ATH Retest Opportunity!!!🚀Silver has officially broken above its all-time high - a major milestone for the metal. But nothing moves in a straight line, and healthy trends always correct before continuing higher.
📉Price is now on its way to retest the previous ATH zone in red, which aligns perfectly with the rising trendline. This creates a powerful confluence area where buyers have historically stepped back in with strength.
⚔️As Silver taps into this intersection, we will be looking for trend-following longs, expecting the bulls to defend the zone and push toward new highs.
🏹The structure is bullish. The trendline is intact. The level is clean.
Now we wait for the reaction… will the bulls reload here? 🤔
⚠️ Disclaimer: This is not financial advice. Always do your own research and manage risk properly.
📚 Stick to your trading plan regarding entries, risk, and management.
Good luck! 🍀
All Strategies Are Good; If Managed Properly!
~Richard Nasr

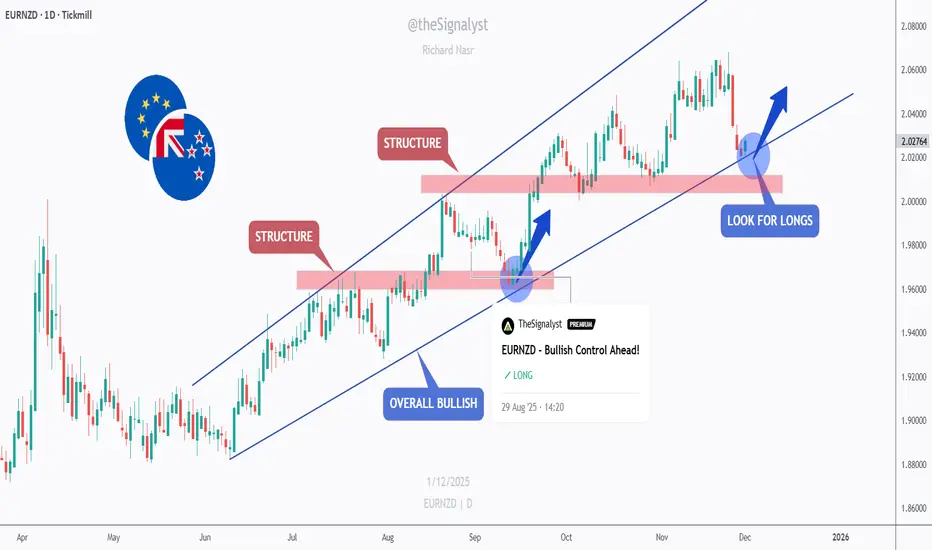
EURNZD - Bulls Eyeing the Structure Zone... Again!📈EURNZD remains overall bullish, moving cleanly inside its rising channel. Each dip toward the lower bound has acted as a strong continuation zone, with buyers consistently stepping in to drive the next upward wave.
🏹As price approaches the lower trendline and the red structure zone, we will be looking for trend-following longs. This area has served as a key support multiple times, making it a high-probability level for the bulls to re-enter the market.
⚔️As long as EURNZD holds above this structure, the bullish trend remains intact and a new push toward higher highs becomes the most likely scenario. Only a confirmed break below the structure would weaken the bullish outlook.
Now we wait for the reaction at structure… will the bulls defend it once again? 🤔
⚠️ Disclaimer: This is not financial advice. Always do your own research and manage risk properly.
📚 Stick to your trading plan regarding entries, risk, and management.
Good luck! 🍀
All Strategies Are Good; If Managed Properly!
~Richard Nasr
BTC - WATCHING FOR BULLISH HINTS AROUND 80KMorning folks,
So as we expected our downside trade from 91K is done perfect. Minimum target at 5/8 support is done. Whats next?
Market now is strongly oversold on Monthly and Weekly time frames. At least by technical reasons, it is a good chance to get solid upside bounce, at least to 104K, if we follow to idea of our weekly H&S pattern .
But, we need to wait a bit to get it clear. Hopefully it should be formed in 1-2 weeks, if our suggestion is correct. Right now we do not see worthy trading setups. Bearish action might continue as drop was fast, so BTC could stop not just at minimal target but to come closer to lows. For long entry we see no good setups as well.

Gold 4H – Liquidity Plays Ahead of Fed Minutes & PMI Data🥇 XAUUSD – Weekly Smart Money Outlook | by Ryan_TitanTrader
📈 Market Context
Gold continues to trade inside a controlled 4H consolidation as markets brace for a highly event-driven week: U.S. PMI releases, updated Fed guidance, and renewed debates over the timing of future rate cuts.
Recent data has shown mixed momentum — softer employment trends but steady business activity — keeping the dollar volatile and gold reactive near mid-range liquidity.
Institutional flows remain cautious, reducing aggressive positioning ahead of major macro catalysts. This environment typically leads to engineered sweeps on both sides of the range as Smart Money hunts liquidity before revealing direction.
Expect short-term volatility spikes, especially around U.S. session opens and PMI releases.
🔎 Technical Analysis (4H / SMC View)
• Price is navigating a minor bearish structure, forming lower highs while protecting deeper liquidity beneath 4020.
• The recent 4H BOS + corrective pullback suggests the market may generate a liquidity grab toward the discount zone before any strong bullish leg develops.
• A Premium Sell Zone at 4225–4227 sits above resting liquidity, making it an ideal region for stop hunts and short-term distribution.
• The Discount Buy Zone at 4010–4008 aligns with structural reaction points, unmitigated demand, and a liquidity shelf — ideal for accumulation.
• Mid-range liquidity around 4060–4080 may be swept before the market chooses a larger weekly direction.
🟢 Buy Zone: 4010–4008
SL: 4000
TP targets: 4085 → 4120 → 4175 → 4220
Rationale:
• Deep discount zone beneath 4H liquidity
• Confluence of demand + structural mitigation
• High probability of engineered sweep before bullish expansion
🔴 Sell Zone: 4225–4227
SL: 4235
TP targets: 4175 → 4120 → 4060 → 4015
Rationale:
• Premium supply above equal-high liquidity
• Favors stop hunt + distribution before correction
• Aligns with previous 4H rejection and imbalance fill
⚠️ Risk Management Notes
• Wait for M15 ChoCH / BOS inside each zone before entering — avoid blind entries.
• Expect spreads and liquidity manipulation around news: US PMI, Fed speeches, and data surprises.
• Avoid trading 10–20 minutes before high-impact events.
• Scale partial profits at each structural target to secure gains and let runners develop.
✅ Summary
Gold remains trapped in a structured 4H range where Smart Money is likely to sweep one side before delivering a decisive expansion.
Discounted buys at 4010–4008 and premium sells at 4225–4227 remain the highest-probability weekly setups.
Stay patient, respect liquidity, and follow confirmation.
🔔 FOLLOW @Ryan_TitanTrader for more weekly SMC setups 🚀

WATCHING FOR BTC BEARISH MOMENTUM TRADESMorning folks,
As we said on Mon - we expect the bounce up to 91K area and here we are. Now, as daily downside momentum is rather strong, it is reasonably to suggest deep downside pullback, somewhere back to 84-85K area at least.
It could start either from 91K where we're now or 95K resistance. Chances are not bad. Since we're in the Holiday and coming to weekend, it is not needed to hurry up. Just sit on the hands and watch for signs. We need some bearish patterns around mentioned areas on intraday charts. Once we get it, we discuss bearish position taking.
Peace.

Gold H1 - Can Gold reject 4167 and fall to 4133 today?🟡 XAUUSD – Intraday Smart Money Plan | by Ryan_TitanTrader (27/11)
📈 Market Context
Gold is trading inside an intraday consolidation after a strong H1 displacement. The session is now primed for liquidity engineering before the next leg.
Key narrative drivers traders must respect today:
• Stronger USD expectations continue to shape risk sentiment
• Institutional desks frequently exploit sweep zones during consolidation
• Range-bound conditions favor fakeouts → displacement → expansion mechanics
• Headlines around U.S. monetary tone amplify intraday volatility
The current chart highlights balanced liquidity both above and below structure, supporting a two-way SMC playbook.
🔎 Technical Framework – Smart Money Structure (H1)
Market is holding a rising channel, but internally ranging — a typical liquidity map scenario:
• Buy-side liquidity pocket: 4180 → 4182 (premium extreme)
• Sell-side liquidity pool: 4110 → 4133 (discount extreme / origin zone)
• Internal equilibrium zone: 4150–4170 chop region (no-trade area)
We expect this sequence:
Sweep → CHoCH/BOS → Displacement → Retest → Expansion.
🎯 Trade Plans for Today
🔴SELL GOLD 4180–4182 | SL 4190
Thesis: Premium liquidity sweep above local highs before downside displacement.
Activation rules:
• Price sweeps 4182 liquidity
• Bearish CHoCH/MSS + BOS down on M5–M15
• Imbalance retest / FVG entry after structure break
Targets:
• 4167 (nearest reaction)
• 4150 (equilibrium raid)
• 4135–4133 (discount retest)
🟢 BUY GOLD 4135–4133 | SL 4125
Thesis: Sell-side liquidity sweep into the origin zone before upside impulse.
Activation rules:
• Price taps 4133 pool (sweep below structure)
• Bullish CHoCH/MSS + BOS up on M5–M15
• FVG fill / bullish rejection wick confirmation
Targets:
• 4155+
• 4167 (reclaim zone)
• 4180+ (premium raid target)
⚠️ Risk Management
• Do NOT trade inside 4150–4170 without clear displacement
• Wait for CHoCH + BOS before execution
• Treat the upper and lower zones as liquidity traps, not trend entries
• Reduce size during news spikes unless structure confirms
• SL = wave invalidation, no averaging in chop
📝 Summary
Gold is in accumulation/redistribution mode. Desks may:
• Run buy-side liquidity at 4182, then displace down → retest discount
or
• Sweep sell-side liquidity at 4133, confirm CHoCH up → expand with impulse
Today is a liquidity session, not early trend chasing. Execute only after confirmation.
📍 Follow @Ryan_TitanTrader for daily Smart Money updates.

Gold H1 – Liquidity Plays as Hassett Leads Fed Chair Race🟡 XAUUSD – Intraday Smart Money Plan | by Ryan_TitanTrader (26/11)
📈 Market Context
Gold opens the week reacting to fresh political headlines as Kevin Hassett emerges as the frontrunner for Trump’s next Fed Chair.
This matters for gold because:
• A hawkish-leaning Fed Chair pick typically strengthens USD and weighs on gold.
• Markets may price in tighter policy expectations, increasing short-term bearish pressure.
• Political volatility ahead of the official announcement often triggers liquidity grabs on both sides.
With sentiment shifting toward a stronger USD, gold is positioned for classic SMC-style sweeps around key premium and discount zones.
🔎 Technical Analysis (1H – Smart Money Structure)
• Market Structure
Price has tapped into a minor premium zone and is showing early rejection signs.
Below, the 4140–4138 area aligns with intraday demand and the origin of recent displacement.
• Premium Sell Zone (1H Supply)
4210 – 4212
• Sits above current buy-side liquidity
• Clear premium relative to intraday structure
• High-probability sweep zone before any downside displacement
• SL region: 4220 liquidity pocket
• Discount Buy Zone (1H Demand)
4140 – 4138
• Previous CHoCH origin
• Aligns with discount retracement
• Confluence with unmitigated internal demand block
• SL region: 4130 sell-side liquidity
• Liquidity Map
• Buy-side: 4212 → 4220
• Sell-side: 4138 → 4130
Expect the typical SMC sequence:
Sweep → CHoCH → Displacement → Retest → Expansion.
🔴 Sell Setup – Premium Reaction
Entry: 4210 – 4212
Stop-Loss: 4220
Take-Profit:
→ 4160 (reaction level)
→ 4145 (mid-range liquidity)
→ 4140–4138 (discount zone retest)
📌 Only activate after a liquidity sweep + bearish CHoCH on M5–M15.
🟢 Buy Setup – Discount Reaction
Entry: 4140 – 4138
Stop-Loss: 4130
Take-Profit:
→ 4160 (intraday reaction)
→ 4185 (premium edge)
→ 4210 (liquidity sweep target)
📌 Valid only after sell-side sweep + bullish CHoCH.
⚠️ Risk Management Notes
• Headlines around the Fed Chair nomination may create sudden USD strength spikes—wait for structure shifts.
• Avoid trading inside the chop zone 4150–4180 without clear displacement.
• Treat today as a liquidity-driven session, not a directional trend day.
📝 Summary
Gold is rotating between premium and discount zones as markets digest news of Kevin Hassett leading the Fed Chair race, a development that could tilt expectations toward firmer policy.
Institutional players are likely to hunt liquidity above 4210 or below 4140 before committing to direction.
Key Levels Today (26/11)
🔴 Sell Zone: 4210–4212
🟢 Buy Zone: 4140–4138
Prepare for:
Accumulation → Sweep → Displacement → Retest → Target.
📍 Follow @Ryan_TitanTrader for daily Smart Money updates.

Gold H1 – Pre-NFP Liquidity Hunt as US–China Tone Warms🟡 XAUUSD – Intraday Smart Money Plan | by Ryan_TitanTrader (25/11)
📈 Market Context
Gold is approaching a key premium zone while markets react to fresh geopolitical headlines. Earlier today, Donald Trump confirmed he had a “very good call” with President Xi of China, highlighting strong bilateral relations and continued cooperation.
This matters for gold because:
• Warmer US–China relations often reduce geopolitical risk premiums, pressuring gold.
• The timing is critical: markets are entering NFP week, a period where institutions frequently engineer liquidity grabs.
• Traders may see a USD-supportive environment ahead of NFP, especially if risk sentiment stabilizes.
In short, gold is sitting in a zone where liquidity sweeps are highly probable before a larger move develops.
🔎 Technical Analysis (1H – SMC Structure)
• Market Structure
Price is climbing toward a major liquidity cluster around 4170–4172, aligning with previous equal highs and an unmitigated supply block.
Below, the FVG demand zone at 4102–4100 serves as today’s discount reaction zone.
• Premium Sell Zone (1H Supply)
4170 – 4172
• Buy-side liquidity sits above prior highs
• Clear premium zone relative to current swing structure
• Likely target for engineered sweep ahead of NFP volatility
• Discount Buy Zone (1H Demand)
4102 – 4100
• FVG imbalance + BOS origin
• Confluence with discount retracement levels
• Strong RR for bullish reaction after sell-side sweep
• Liquidity Map
• Buy-side: 4172 → 4180
• Sell-side: 4100 → 4092
Expect the classic SMC sequence:
Sweep → CHoCH → Displacement → Retest → Expansion.
🔴 Sell Setup – Premium Reaction
Entry: 4170 – 4172
Stop-Loss: 4180
Take-Profit:
→ 4138 (imbalance fill)
→ 4115 (mid-range liquidity)
→ 4102–4100 (discount zone retest)
📌 Must wait for liquidity sweep + bearish CHoCH on M5–M15.
🟢 Buy Setup – Discount Reaction
Entry: 4102 – 4100
Stop-Loss: 4092
Take-Profit:
→ 4135 (intraday reaction)
→ 4160 (premium edge)
→ 4170 (buy-side liquidity sweep)
📌 Valid only after sell-side liquidity is taken.
⚠️ Risk Management Notes
• Expect extra volatility as markets price in US–China optimism ahead of NFP.
• Liquidity traps are common during Asian/London sessions—wait for confirmation.
• Avoid taking positions inside the chop zone 4125–4150 without structure shifts.
• Treat both scenarios as liquidity plays, not trend continuation trades.
📝 Summary
Gold is approaching a major liquidity pocket as geopolitical sentiment improves following Trump’s positive call with President Xi.
With NFP approaching, institutions are likely to sweep liquidity above 4170 or below 4100 before establishing direction.
Key Levels Today
🔴 Sell Zone: 4170–4172
🟢 Buy Zone: 4102–4100
Prepare for the typical pre-NFP pattern:
Accumulation → Sweep → Displacement → Retest → Target.
📍 Follow @Ryan_TitanTrader for daily Smart Money updates.

Gold H1 – Will Economic Slowdown Trigger a Liquidity Sweep?🟡 XAUUSD – Intraday Smart Money Plan | by Ryan_TitanTrader (24/11)
📈 Market Context
Gold continues to move inside a tight compression range while markets react to new economic concerns raised by U.S. analysts.
According to today’s report, economists are increasingly worried about an unusual slowdown pattern in consumer behavior — spending remains high, but confidence and savings are weakening.
This mixed macro picture creates uncertainty:
🔹 Key takeaways from today’s news:
• U.S. consumers are still spending but confidence is deteriorating, a red flag for future growth.
• Economists warn this divergence could lead to slower economic momentum over the next quarters.
• Weakening sentiment → higher recession fears → typically supportive for gold after liquidity sweeps.
• However, short-term volatility remains high as markets reassess the sustainability of U.S. demand.
With uncertainty rising, institutions are likely engineering both-side liquidity grabs before committing to a directional move.
Gold is currently rotating between 4015–4100, respecting a clean SMC range structure.
🔎 Technical Analysis (1H / SMC Structure)
• Market Structure
Price is forming a descending compression pattern with repeated CHoCH signals, indicating engineered liquidity on both sides.
• Premium Sell Zone (1H Supply)
4100 – 4102
→ Overhead resting buy-side liquidity
→ Aligns with unmitigated internal supply + trendline liquidity
• Discount Buy Zone (1H Demand)
4015 – 4013
→ Inside the prior sweep zone
→ Confluence with ascending structure + BOS origin
• Liquidity Map
• Buy-side liquidity: above 4102 – 4110
• Sell-side liquidity: below 4013 – 4008
A sweep of either pocket is likely before real displacement.
🔴 Sell Setup (Premium Reaction Zone)
Entry: 4100 – 4102
Stop-Loss: 4110
Take-Profit Targets:
→ 4065 (imbalance fill)
→ 4040 (range midpoint)
→ 4018–4015 (discount retest)
📌 Execution Rule: Wait for liquidity sweep into the zone + bearish CHoCH on M5–M15.
🟢 Buy Setup (Discount Reaction Zone)
Entry: 4015 – 4013
Stop-Loss: 4008
Take-Profit Targets:
→ 4055 (short-term reaction)
→ 4080 (premium edge)
→ 4100 (sweep target)
📌 Valid only if price takes sell-side liquidity first and shows bullish displacement from discount.
⚠️ Risk Management Notes
• Market may react unpredictably to weakening U.S. consumer sentiment — reduce risk during spikes.
• Avoid trading inside the 4040–4070 chop zone unless a clean break or CHoCH forms.
• Treat both setups as liquidity–based plays, not trend continuation trades.
• Expect engineered manipulation during Asian session before London expansion.
📝 Summary
Gold remains trapped in a controlled SMC range as economic signals turn mixed.
With economists raising concerns about consumer–confidence divergence, gold may experience pre-breakout liquidity sweeps today.
Key Zones:
🔴 Sell Zone: 4100–4102
🟢 Buy Zone: 4015–4013
Expect the classic SMC sequence:
Accumulation → Sweep → Displacement → Retest → Target.
📍 Follow @Ryan_TitanTrader for more Smart Money updates.

90-91K POTENTIALLY INTERESTING FOR SELL.Morning folks,
So, our DRPO "Buy" pattern has failed. This shows is how strongly market depressed, and here we see non-market driving factors. Now we suggest that the really big game is ready to start. On weekly chart 2/3 parts of H&S is already in place. And it will be quite interesting to see what will happen in nearest 2-3 months.
In short-term, market has completed our 79K target on daily chart of the same downside AB-CD pattern. BTC is oversold now on all time frames. At the same time, the price shape here is not bullish - too slow and choppy. It's just a technical bounce. So, we think that 90-91K resistance area might be interesting for potential short entry with the minimum target around 84K - downside momentum on daily chart is rather strong.
Gold H1 – Is This Just a Range or a Break Incoming?🟡 XAUUSD – Intraday Smart Money Plan | by Ryan_TitanTrader (21/11)
📈 Market Context
Gold continues to trade inside a compressed intraday range as markets react to the latest discussion on whether the Federal Reserve is likely to cut interest rates anytime soon.
According to new reports, policymakers remain cautious, and early rate-cut expectations are fading as inflation progress slows.
This shift pushes USD stronger, increases Treasury yields, and temporarily weakens gold’s bullish momentum.
Key takeaways from the news:
• Fed officials note that inflation is “still not where it needs to be,” reducing the probability of early rate cuts.
• Markets have scaled back expectations for a Q1 cut, keeping USD supported.
• Higher yields → tighter financial conditions → gold struggles to break premium levels.
• Institutions are likely engineering liquidity grabs on both sides before committing to a new directional move.
Price is currently sitting near the 4030–4045 zone, right above discount liquidity, waiting for a catalyst to break out of the short-term compression.
🔎 Technical Analysis (1H / SMC Structure)
• Market Structure:
Gold has completed a clear CHoCH + short-term bearish sequence and is now compressing into the discount zone around 4030.
• Premium Sell Zone (4H Supply):
4128–4130 aligns with unmitigated supply + buy-side liquidity resting above internal highs.
• Discount Buy Zone:
4030–4028 sits inside the last clean demand zone where a previous sweep occurred.
• Liquidity Map:
→ Buy-side liquidity: above 4128–4135
→ Sell-side liquidity: below 4028–4020
Institutions are likely to sweep one side before delivering direction.
🔴 Sell Setup (Premium Reaction Zone)
• Entry: 4128 – 4130
• Stop-Loss: 4140
• Take-Profit:
→ 4080 (minor imbalance fill)
→ 4045 (range EQ)
→ 4030–4028 (discount demand retest)
📌 Execution rule: Wait for liquidity sweep into the zone + bearish CHoCH on M5–M15 before entering.
🟢 Buy Setup (Discount Reaction Zone)
• Entry: 4030 – 4028
• Stop-Loss: 4020
• Take-Profit:
→ 4060 (short-term reaction level)
→ 4095 (inefficiency fill)
→ 4120 (premium retest)
📌 Valid only if price sweeps the 4030–4028 pocket and shows bullish displacement from discount.
⚠️ Risk Management Notes
• USD strength may spike unexpectedly as rate-cut bets fade — reduce position size during volatility.
• Avoid trading inside the 4045–4085 chop zone unless a clean structure break forms.
• Manage trades aggressively once liquidity levels are taken.
• Expect engineered manipulation during low-volume Asian hours.
📝 Summary
Gold is compressing inside a narrow intraday range as markets reassess the likelihood of Fed rate cuts.
SMC structure suggests a two-sided liquidity sweep before a decisive move:
• Sell Zone: 4128–4130 (premium supply)
• Buy Zone: 4030–4028 (discount demand)
Expect classic accumulation → sweep → displacement patterns until macro conditions create a new trend.
📍 Follow @Ryan_TitanTrader for more Smart Money updates.

USDCHF - Bulls Preparing to Defend the Zone!⚔️USDCHF is currently trading around a key intersection zone , where the rising trendline meets the major green support area.
This confluence makes it a high-interest zone for potential bullish reactions, as the pair has respected this structure multiple times in the past.
🏹As long as the support area holds, I’ll be looking for long setups, expecting the next impulse to push price back toward the upper bound of the ascending channel.
If the support breaks, however, the bullish outlook would weaken, so patience and confirmation are key here. ⚖️
⚠️ Disclaimer: This is not financial advice. Always do your own research and manage risk properly.
📊All Strategies Are Good; If Managed Properly!
~Richard Nasr

BOUNCE TO 98-100KMorning folks,
Last time we explained in details the fundamental background, so BTC remains bearish. But now it stands at weekly oversold and around 95K Daily support area. This creates friendly background for tactical bounce.
On 4H chart we have DiNapoli DRPO "Buy" pattern, that suggests upside bounce to 98-100K area at least.
That's being said, don't take any new shorts right now - wait for the pullback. For bullish intraday position, you could try to use this DRPO pattern. Don't place too far stop, just under lows should be enough, but be aware of NFP volatility today...

Gold H1 – Sideway or Preparing for a Bigger Break?🟡 XAUUSD – Intraday Smart Money Plan | by Ryan_TitanTrader (20/11)
📈 Market Context
Gold continues to move inside a tight consolidation as markets digest fresh headlines:
Treasury markets just erased hopes for a December rate cut and now even a January cut is doubtful, following hawkish tones revealed in the latest Fed minutes.
This shift reinforces USD strength in the short term and pressures gold’s bullish momentum, keeping price trapped between well-defined liquidity zones.
Key implications from the news:
• The 6-month Treasury yield jumped back to 3.83%, aligning with hawkish expectations.
• Rate-cut bets evaporating → USD stays firm, limiting gold’s upside.
• Institutions are engineering both-side liquidity sweeps ahead of upcoming Fed speakers.
• Gold is currently hovering around ~$4,070 inside a neutral zone where no clean premium/discount imbalance exists.
Until the market receives fresh macro catalysts, price is likely to sweep liquidity at the edges of the range before choosing direction.
🔎 Technical Analysis (1H / SMC Structure)
• Structure: Price remains inside a short-term sideways distribution after the recent CHoCH + BOS sequence.
• Premium Sell Zone: 4145–4147, aligning with unmitigated supply + buy-side liquidity resting above recent highs.
• Discount Buy Zone: 4004–4002, sitting inside last clean demand with previous sell-side sweep.
• Liquidity Map:
→ Buy-side liquidity: above 4145–4150 (equal-high cluster).
→ Sell-side liquidity: below 4004–3997, where earlier long positions were cleared.
🔴 Sell Setup (Premium Reaction Zone)
• Entry: 4145 – 4147
• Stop-Loss: 4155
• Take-Profit:
→ 4085 (minor imbalance)
→ 4045 (range midpoint)
→ 4004 – 4002 (discount demand)
📌 Execution rule: Wait for liquidity sweep into zone + bearish CHoCH M5–M15 before entering.
🟢 Buy Setup (Discount Reaction Zone)
• Entry: 4004 – 4002
• Stop-Loss: 3997
• Take-Profit:
→ 4040 (short-term range high)
→ 4075 (inefficiency fill)
→ 4140 (premium retest)
📌 Valid only if price sweeps the 4000–3997 liquidity pocket and shows strong bullish displacement.
⚠️ Risk Management Notes
• Expect increased volatility as markets reposition after the sharp decline in rate-cut expectations.
• Avoid trading inside the 4030–4080 chop zone unless a clear structure break occurs.
• Reduce risk size during sudden USD spikes caused by Treasury-yield moves.
• Trail stops progressively as each liquidity level is taken.
📝 Summary
Gold is currently stuck in a clean intraday range as hawkish Fed minutes remove hopes for early rate cuts, pushing USD up and holding gold below premium supply.
SMC structure favors liquidity-sweep setups at both edges:
• Sell Zone: 4145–4147 (premium supply)
• Buy Zone: 4004–4002 (discount accumulation)
Expect classic manipulation → reaction → continuation patterns until the market resolves the new macro pressure.
📍 Follow @Ryan_TitanTrader for more Smart Money updates.

GOLD H1 – Trump’s Fed Comments Shake Market Sentiment🟡 XAUUSD – Intraday Smart Money Plan | by Ryan_TitanTrader (19/11)
📈 Market Context
Gold is trading in a tight corrective structure as markets react to breaking headlines that Donald Trump is considering removing Fed Chair Jerome Powell.
This news injects uncertainty into Fed policy expectations, causing short-term volatility in USD and positioning gold at a critical decision zone.
• Trump’s comments increase speculation about a potential policy shift, which may temporarily weaken USD sentiment.
• However, gold remains capped below the premium supply zone as institutional flows continue to engineer liquidity sweeps.
• Price is hovering near $4,080 ahead of key Fed-related discussions, keeping both sides of liquidity active.
Institutional order flow suggests controlled accumulation at the discount range while premium regions remain defended by sellers.
🔎 Technical Analysis (1H / SMC Structure)
• Structure: Price is forming a short-term distribution pattern after multiple BOS events from the 4150 breakdown.
• Premium Sell Zone: 4109–4111, aligning with unmitigated supply and internal liquidity pockets.
• Discount Buy Zone: 4009–4007, sitting inside a clean demand block + previous sell-side sweep.
• Liquidity:
→ Buy-side liquidity sits above 4111, where equal-high clusters form.
→ Sell-side liquidity rests between 4007–4000, where earlier long positions were cleared.
🔴 Sell Setup (Premium Reaction Zone)
• Entry: 4109 – 4111
• Stop-Loss: 4119
• Take-Profit:
→ 4055 (minor inefficiency)
→ 4028 (BOS retest)
→ 4009–4007 (discount demand)
📌 Execute only after a liquidity sweep into the zone + bearish CHOCH on M5–M15.
🟢 Buy Setup (Discount Reaction Zone)
• Entry: 4009 – 4007
• Stop-Loss: 4000
• Take-Profit:
→ 4040 (short-term range high)
→ 4075 (inefficiency rebound)
→ 4105/4110 (premium retest)
📌 Valid if price sweeps 4007 and shows bullish displacement.
⚠️ Risk Management Notes
• Expect volatility as traders react to Trump’s comments on Fed leadership.
• Avoid trading in the 4030–4080 chop zone without a clear structural break.
• Reduce position size during impulsive spikes around USD sentiment shifts.
• Trail stops once price clears each liquidity pocket.
📝 Summary
Gold is being influenced heavily by uncertainty around Trump’s remarks about replacing Fed Chair Powell. Liquidity is building at both extremes, offering clean opportunities at the edges of the range.
• Sell Zone: 4109–4111 (premium supply)
• Buy Zone: 4009–4007 (discount accumulation)
Expect a manipulation → reaction → continuation pattern as institutions play both sides of the current structure.
📍 Follow @Ryan_TitanTrader for more Smart Money updates.
🎁 Gifts in BIO for traders who follow daily plans.

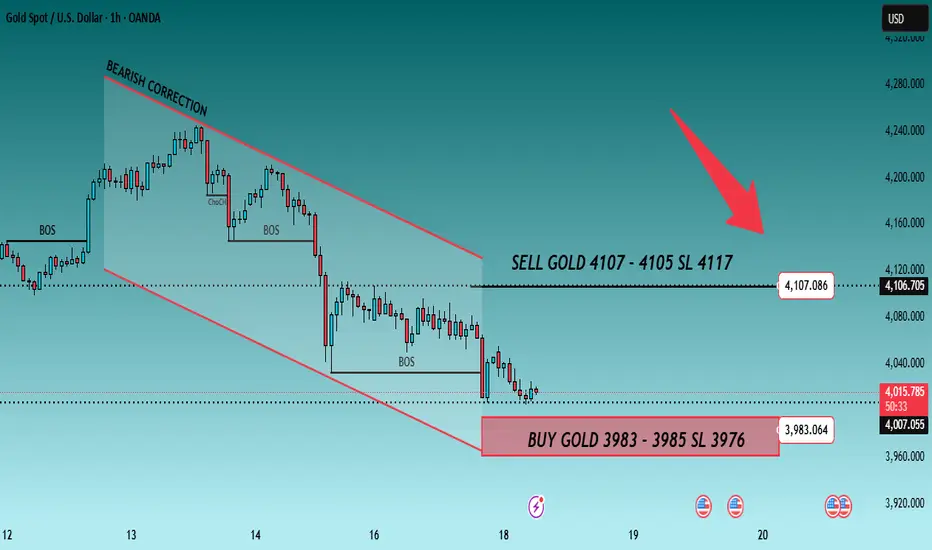
GOLD H1 – Hawkish Fed Pressure Ahead of Key NFP Data🟡 XAUUSD – Intraday Smart Money Plan | by Ryan_TitanTrader (18/11)
📈 Market Context
Gold is trading inside a bearish corrective channel as markets react to hawkish Federal Reserve commentary and positioning ahead of this week’s U.S. NFP data.
• Fed officials signaled a stronger stance against premature rate cuts, keeping USD supported and limiting gold’s upside.
• Price continues to hover near $4,080, reflecting uncertainty as traders balance Fed tone with upcoming labor-market reports.
Institutional order flow shows controlled downside pressure, with engineered liquidity sweeps forming around both channel extremes.
🔎 Technical Analysis (1H / SMC Structure)
• Structure: Price remains inside a Bearish Correction Channel, creating consecutive BOS points, confirming distribution.
• Premium Sell Zone: 4107–4105 aligns with a previous mitigation block + internal liquidity.
• Discount Buy Zone: 3983–3985 sits at the lower boundary of the channel + liquidity sweep zone.
• Liquidity:
→ Buy-side liquidity above 4107 (clean equal-high pocket).
→ Sell-side liquidity resting around 3985–3976, where prior long positions were removed.
🔴 Sell Setup (Premium Reaction Zone)
• Entry: 4,107 – 4,105
• Stop-Loss: 4,117
• Take-Profit Targets:
→ 4,060 (minor imbalance fill)
→ 4,030 (BOS retest)
→ 3,985 (discount zone)
📌 Execute only after a liquidity sweep into the zone + bearish BOS on M5–M15.
🟢 Buy Setup (Discount Reaction Zone)
• Entry: 3,983 – 3,985
• Stop-Loss: 3,976
• Take-Profit Targets:
→ 4,030 (short-term structure high)
→ 4,060 (inefficiency midpoint)
→ 4,105 (premium retest)
📌 Valid if price taps channel low + shows bullish displacement.
⚠️ Risk Management Notes
• Expect volatility as markets digest hawkish Fed remarks before NFP.
• Avoid entering trades inside the 4020–4070 chop region without clear BOS.
• Reduce position size during news hours.
• Trail stops once price clears each liquidity pocket.
📝 Summary
Gold remains pressured by Fed rhetoric, but liquidity is building at both extremes.
• Sell Zone: 4107–4105 (premium mitigation area)
• Buy Zone: 3983–3985 (discount liquidity sweep)
Price is likely to form a manipulation → reaction → continuation pattern within the channel.
📍 Follow @Ryan_TitanTrader for more Smart Money updates ⚡
🎁 More insights & gifts on my TradingView profile.
GOLD H1 – Will Retail Sales Trigger Gold’s Next Big Move?🟡 XAUUSD – Intraday Smart Money Plan | by Ryan_TitanTrader (17/11)
📈 Market Context
Gold is trading inside a corrective phase as markets anticipate today’s U.S. Retail Sales data and several Fed speeches — both crucial for assessing whether inflation momentum is slowing or rebounding.
• Weak retail numbers may hint at cooling consumer strength, supporting safe-haven bids in gold.
• Strong data could revive USD demand, prompting sell-side setups from premium zones.
Institutional flows show engineered pushes into inefficiency before a directional leg unfolds.
🔎 Technical Analysis (1H / SMC Structure)
• Structure: Gold is forming a short-term accumulation at the discount range after consecutive bearish candles and a deep liquidity sweep below 4030.
• FVG Sell Zone: 4140–4138 aligns with an unmitigated FVG + internal liquidity — ideal for sell-side reactions.
• Discount Zone: 4008–4010 is the last clean demand zone + sweep area, matching the chart’s projected bullish inducement.
• Liquidity:
→ Buy-side liquidity rests above 4140.
→ Sell-side liquidity remains exposed near 4000–3995.
🔴 Sell Setup (Premium Reaction Zone)
• Entry: 4,140 – 4,138
• Stop-Loss: 4,150
• Take-Profit Targets:
→ 4,095 (intra-day imbalance fill)
→ 4,060 (previous BOS block)
→ 4,010 (discount accumulation area)
📌 Trade only after a liquidity sweep into FVG + bearish BOS on M5–M15.
🟢 Buy Setup (Discount Reaction Zone)
• Entry: 4,010 – 4,008
• Stop-Loss: 4,000
• Take-Profit Targets:
→ 4,060 (short-term structure high)
→ 4,095 (mid-range inefficiency)
→ 4,138 (final premium reaction zone)
📌 Valid if price sweeps 4008 and shows bullish BOS + displacement.
⚠️ Risk Management Notes
• Expect volatility during the U.S. Retail Sales release.
• Avoid chasing price inside the 4060–4100 chop region.
• Lock profits at each liquidity level and trail stops.
• Keep total risk under 1–2% per setup.
📝 Summary
Gold remains in a engineered pullback phase with clear liquidity pockets at both extremes.
• Sell Zone: 4140–4138 (FVG / premium reaction zone)
• Buy Zone: 4008–4010 (discount accumulation zone)
A clean manipulation–reaction–continuation pattern is likely before the next intraday move.
📍 Follow @Ryan_TitanTrader for more Smart Money updates ⚡
Check out my TradingView profile for special gifts 🎁

BTC 95K is DONE. WATCHING FOR 100K BounceMorning folks,
So, our plan worked perfect, BTC collapsed as we suggested. Now price is at oversold as on daily as on weekly TF and at support. So, it is reasonable to expect a tactical bounce, somewhere back to 100K. And it could start from a kind of reverse H&S on 1H Chart .
If it starts at all...
But it is not interesting... today we probably can't escape some fundamental analysis. I don't believe in occasional coincidence of stock market collapse right at the eve of Thanksgiving and Xmas and appearing of Epstein compromat on D. Trump. Meantime Donny is loosing all his allies - Musk, Carlson, Now M. Taylor Greene.
I wouldn't worry too much, if I would not see a big bearish signs on BTC, suggesting drop to 80K and even 50K in perspective. As you understand, this could happen only in a case of total collapse on stock market.
Buckle up and be prepared. No longs by far. Wait for mentioned pullback to consider a new shorts.
Take care, S.

btc finds 200 ema support, whats next?As I have been posting in these "Ideas" for the past few weeks about market direction and where the price for BTC will go. It now has come to pass where the 200 EMA has been tested and support has been found, It however has not generated any relief among buyer sentiment unable to push price above the previous days close leaving the digital asset to continue to bleed out and cause positions from all the 93k Bulls to liquidate.
Its a shame people cannot make the connection that the only way price can go higher is to go lower in a market. That Is why I am going to warn people about where we may go , I believe the 200 EMA will be tested again and if support is broken it will send is into the low 70k area where there are open orders and It is possible this may happen. The Bull market support band is the 200EMA however there may be institutional money that may drive us down to cause massive liquidations and fear and panic among those holding bags while greed causes big players to push more into the fringe of where we can maintain a recovery.
Watch for a retest of the 200EMA . which is a bit of a fuzzy zone , use the high and low to denote the area for support as well as keep an eye on the RSI and CCI , we are also watching on balance volume drop off which is not a great sign that there is market confidence however this will play out over the weekly and the weekly candle will start to materialize in the next few days.

GOLD H1 – Gold Reacts to Mixed U.S. Inflation Data🟡 XAUUSD – Intraday Smart Money Plan | by Ryan_TitanTrader (14/11)
📈 Market Context
Gold continues to trade within a balanced range as investors digest the latest U.S. inflation data. The CPI report showed cooling price pressures, while producer prices (PPI) are due soon — both shaping market sentiment toward the Fed’s December rate outlook.
• Softer inflation supports a bullish bias if gold holds the discount zone.
• Renewed USD strength could trigger short setups from premium liquidity zones.
Institutional flows suggest engineered liquidity hunts before a decisive move resumes.
🔎 Technical Analysis (1H / SMC Structure)
• Structure: Gold remains in a short-term bullish correction after a strong sell-off, with recent ChoCH signaling a possible re-accumulation phase.
• Premium Zone: 4300–4298 aligns with a previous unmitigated supply and internal liquidity — ideal for sell-side reactions.
• Discount Zone: 4144–4142 overlaps with the last bullish OB and EMA100 area — a potential demand zone for continuation.
• Liquidity: Resting buy-side liquidity sits above 4300, while inducement below 4140 could lure early longs before true accumulation.
🔴 Sell Setup (Premium Reaction Zone)
• Entry: 4,300 – 4,298
• Stop-Loss: 4,310
• Take-Profit Targets:
→ 4,178 (previous BOS zone)
→ 4,144 (discount retest)
→ 4,110 (deep liquidity pocket)
📌 Valid only after a liquidity sweep and bearish BOS confirmation on M5–M15.
🟢 Buy Setup (Discount Reaction Zone)
• Entry: 4,144 – 4,142
• Stop-Loss: 4,135
• Take-Profit Targets:
→ 4,185 (minor structure high)
→ 4,210 (liquidity void fill)
→ 4,300 (final premium reaction zone)
📌 Valid if price reclaims structure with bullish BOS confirmation.
⚠️ Risk Management Notes
• Stay patient until U.S. PPI data confirms direction.
• Avoid trades between 4175–4250 (low R/R consolidation area).
• Scale out partials near liquidity pools and trail stops after confirmation.
• Maintain disciplined risk exposure under 2%.
Summary
Gold is in an engineered equilibrium phase — liquidity pools are forming at both extremes.
• Sell zone: 4300–4298 (premium reaction zone)
• Buy zone: 4144–4142 (discount accumulation zone)
Expect manipulation around mid-range levels before a clean directional move unfolds.
📍Follow @Ryan_TitanTrader for more Smart Money updates ⚡

GOLD H1 – Gold Awaits U.S. PPI Data for Directional Clarity🟡 XAUUSD – Intraday Smart Money Plan | by Ryan_TitanTrader (13/11)
📈 Market Context
Gold is consolidating after a strong impulsive leg, with intraday traders now focused on the upcoming U.S. Producer Price Index (PPI) release — a key inflation metric that often shapes Fed expectations.
• A hot PPI reading could strengthen the USD and trigger a sell-off from premium levels.
• A softer print may weaken the dollar, encouraging another liquidity grab above 4250.
Institutional order flow shows potential for engineered liquidity sweeps around both extremes before the next directional push.
🔎 Technical Analysis (1H / SMC Structure)
• Structure: Still bullish overall, but showing early distribution near the 4250 handle.
• Premium Zone: 4255–4253 aligns with an unmitigated supply and prior buy-side liquidity pool — a prime short setup if price reacts after a liquidity sweep.
• Discount Zone: 4168–4166 sits within the recent FVG and above EMA100 — a valid area for re-accumulation and continuation if price corrects deeper.
• Liquidity: Equal highs at 4255 and lows near 4156 signal potential stop-hunt traps before a decisive move.
🔴 Sell Setup (Premium Reaction Zone)
• Entry: 4,255 – 4,253
• Stop-Loss: 4,265
• Take-Profit Targets:
→ 4,182 (previous BOS zone)
→ 4,148 (mid-range equilibrium)
→ 4,110 (discount reaction zone)
📌 Valid only if price sweeps buy-side liquidity and confirms bearish BOS on M5–M15.
🟢 Buy Setup (Discount Reaction Zone)
• Entry: 4,166 – 4,168
• Stop-Loss: 4,156
• Take-Profit Targets:
→ 4,210 (short-term liquidity pocket)
→ 4,248 (imbalance fill zone)
→ 4,255 (final liquidity target)
📌 Valid only if price mitigates the FVG and reclaims structure with bullish BOS confirmation.
⚠️ Risk Management Notes
• Wait for PPI volatility before entering trades.
• Avoid trading mid-range (4180–4210) – low R/R zone.
• Scale out partials near liquidity points and trail stops post-confirmation.
• Maintain disciplined risk: 1–2% max per setup.
Summary
Gold is in pre-news equilibrium, with both buy- and sell-side liquidity pools clearly defined:
• Sell zone: 4255–4253 (premium reaction area)
• Buy zone: 4168–4166 (discount re-entry area)
Expect engineered liquidity grabs before a decisive move — patience and structure confirmation remain key.
📍Follow @Ryan_TitanTrader for real-time Smart Money updates ⚡

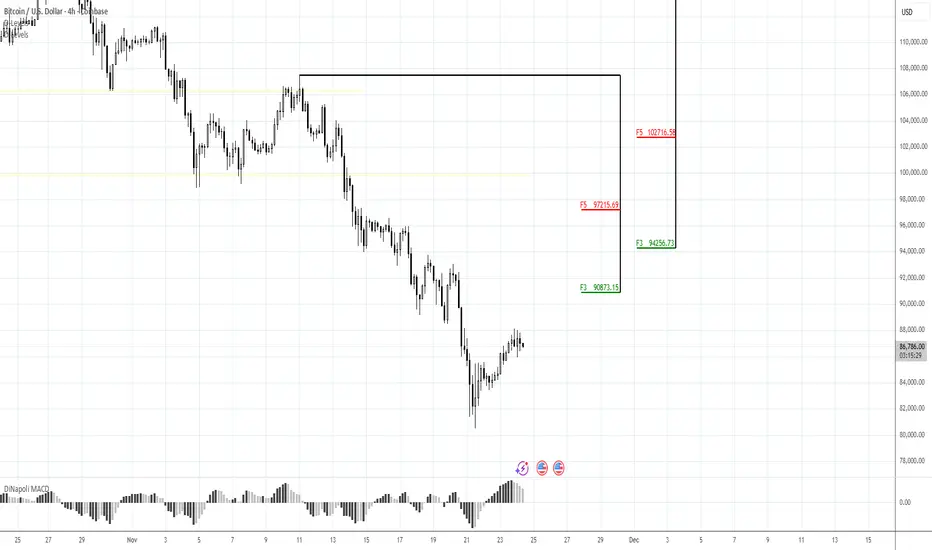
#BTC 95-96K 3-DRIVE IS NOT EXCLUDEDMorning folks,
So, as we suggested BTC has shown healthy downside action out from 106K resistance area. Despite good news around shutdown, BTC shows limited reaction. Even more, I would say that 3-Drive pattern on daily chart is not excluded, down to 94-96K area.
This pattern fits well to idea of weekly H&S pattern ... On 4H in a few hours we could get a bearish grabber as well .
So, I wouldn't be too fast on long entry right now and prefer to wait for confirmation. It might be upside breakout of 108K area at least, just to erase all "bearish suspicions" around...
For short entry, if you want - try to catch the grabber or take position as close to 108K local top (and 2nd Drive top) as possible. This is invalidation point for bearish scenario.
Take care.
S.
