LRC: BULLISH divergence on daily chartBullish Divergence Confirmed:
Both the RSI (Relative Strength Index) and MACD (Moving Average Convergence Divergence) are showing bullish divergence on the daily chart. While the price has made a lower low, the RSI and MACD have formed higher lows, indicating weakening downward momentum and a potential trend reversal.
Low Market Cap Potential:
Given the coin’s low market capitalization, it has the potential for significant price appreciation if buying momentum accelerates, as low-cap assets are often more volatile and responsive to positive sentiment.
As always, monitor the trade closely and adjust your strategy as needed based on market conditions.
Daily Charts

88K is not excluded but not granted as wellMorning folks,
So, we set for 85K sell and it worked. Downside reaction happened, but still, we call you to move stops to breakeven for some case.
The problem that we see is the market behavior. We see it not natural for normal bearish market. BTC stands stubbornly around K-resistance, not showing normal downside extension.
Our scenario of downside continuation from ~85K area is not broken yet, it is valid, and maybe everything will happen as we've suggested initially.
But we see the risk in the way of market behavior. It could lead to more extended upside bounce in the way of upside AB=CD pattern right to 88k resistance .
It means that if you already have bearish positions - move stops to breakeven. If you don't - do not take the new once for awhile. Or, at least, you could take but not more than 25-30% of your normal lot.
Our bearish scenario remains valid until market stands under 85.1K spike (because this is bearish reversal session on daily chart) and below 85.5K resistance in general. Upside breakout means an action to 88K.
Since we do not have the breakout it, I mark our update as "bearish", but we warned you... Take care.

BTC Monthly AnalysisMy current perspective is simple.
The market flips supply into demand
OR
The market taps into demand.
——————————————————
While there can be trades taken between levels with proper risk management, these zones should provide the best setups.
It’s okay to swing and miss; again with proper risk management.
I am long term bullish & short term bearish.

Selling?Morning folks,
So, Monday's plan has worked perfect, we're at 85K. Today we have to keep an eye on daily chart, where bearish grabber pattern might be formed and trigger downside action.
In general upside action is rather slow, so bearish context stands intact. We see only one risk for it - non-market driving factors, such as a D. Trump flood on X. But, this is out of our control.
That's why we keep everything as it is - 85K is considered for short entry. If we get daily bearish grabber also - all the better.
Next target stands around 74K

@ Important Support LevelDouble Bottom Formation on Daily TF.
45.50 if Sustained on Weekly basis,
Next Targets can be around 47 initially.
It may test 41.90 - 42 again, prints a
double bottom on Shorter TF & then bounce.
However, 41.50 should not be broken.

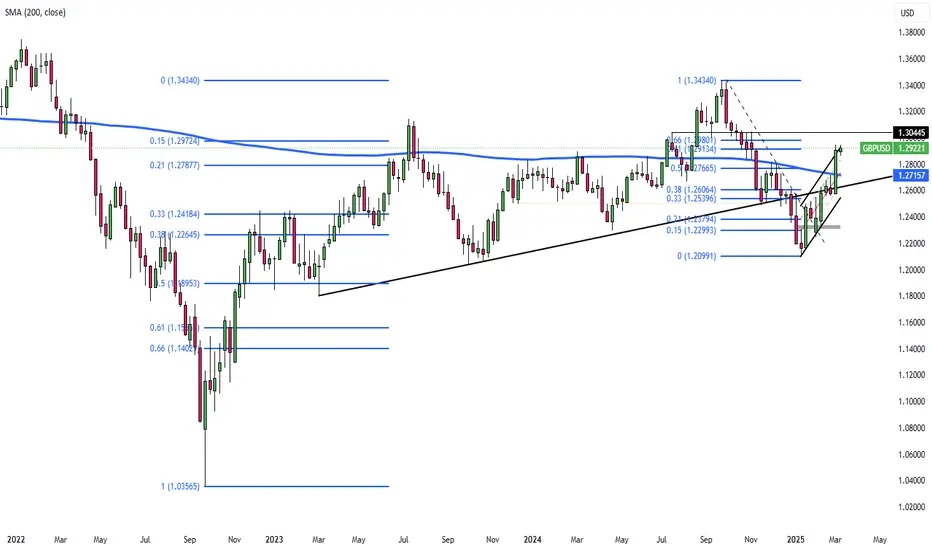
UK Budget Forecasts and GDP Data Set to Shape Pound’s Next MoveThe pound hovered around $1.29, staying near a four-month high as dollar weakness persisted amid U.S. economic concerns and tariff risks. Sterling remained supported by expectations that UK interest rates will stay high, with traders adjusting BoE rate cut forecasts to 52 bps for 2025. Investors now await January GDP data for economic insights, while the UK’s budget watchdog will release updated economic and borrowing forecasts on March 26, potentially influencing market sentiment.
If GBP/USD breaks above 1.2920, the next resistance levels are 1.2980 and 1.3050. On the downside, support stands at 1.2860, with further levels at 1.2760 and 1.2660 if selling pressure increases.
Pullback to 85K for sellingMorning folks,
So, everything goes with the plan - nothing to change on major picture. We keep our bearish view on BTC and now consider 68-74K area as the next destination point. But this could take a few weeks.
In fact, previous 68K top also will be a big test. Downside break will open road to 52-55K. While if BTC will be able to stay in 70-80K range, it will keep long term bullish context. It should be interesting...
Meantime, BTC once again hits oversold areas as on weekly as on daily charts. As we promised - D. Trump verbal boost lasted just 2 days and was reversed down. We see some intention market manipulations from D. Trump administration but this is not the subject for this update.
In short-term - 2-3 days BTC needs to relief oversold pressure, so minor bounce is quite possible. For example, based on "222" pattern on 1H chart we could see attempt to bounce up from 79K and up to 84-85K area.
Those who wants to sell - that might be the chance.
For now I mark this update as bullish, because of suggested bounce. But our longer term view remains bearish still.

Yen Benefits from Dollar's Broad RetreatThe Japanese yen held around 149 per dollar, its strongest in five months, benefiting from the dollar’s decline on a stronger euro and Trump’s tariff policies. His selective tariff exemptions and retaliatory measures weakened the dollar further.
Domestically, BOJ Deputy Governor Shinichi Uchida suggested possible rate hikes if economic projections align but emphasized that Japan’s monetary conditions remain highly accommodative, with only minimal reductions in government bond holdings.
Key resistance is at 152.00, with further levels at 154.90 and 156.00. Support stands at 147.10, followed by 145.80 and 143.00.

Bearish until 98-100K Morning folks,
So, Old Donny euphoria was over on the next day, as we've suggested. ETH was even worse than BTC...
And we're skeptic on coming Crypto Summit tomorrow. What could happen in three days? A lot of speech and empty promises definitely will sound, but where the real deals? Recently. S. Lummis said that BTC Reserve issue is still under question and no guarantees that it will be formed. That's it... Nothing is prepared for BTC Reserve forming. Coming D. Trump talks could shake the market, but that will be only emotions.
Speaking practically, we suggest that until BTC stands under 98-100K area - context remains bearish. We see a few patterns, and this butterfly one of them. If you want to go short - this is the point that you have to think about. Based on the butterfly, the risk is not too big.
If even we will get "222" Sell - setup remains bearish, because upside AB=CD agrees with daily Fib resistance level. Only upside breakout of 98-99K will give BTC theoretical chances to start wobbling in 100-108K range.
Thus, for now we're not ready to speak about BTC buying. Albeit you want to make a bet on Summing euphoria tomorrow.

AUDUSD sell setupOANDA:AUDUSD
Overall bias is bearish, with the previous Daily candlestick closing below the Daily AOI, currently awaiting a retest to the DAILY AOI around the price of 0.62400 to look for sells with entry signals/confirmation of course

Verbal intervention was great but what's on the back?Morning folks,
So, the pullback that we were waiting for is done. Although we thought that it will be driven by some natural forces and reasons. The way how it has happened and by what factors make us to be caution on its perspectives.
Indeed, it was just verbal intervention from D. Trump. It had bad week - scandal in White House with Zelensky, stocks are falling, crypto are falling, inflation expectations are raising, March debt ceil and shutdown is almost here, EU "allies" do not want to work together... So, to say couple of words and pump the market is not a bad idea at all.
But, what is on the back? Nothing. Special Committee will make Reserve report only by July. I'm sure on crypto Summit this week we also will hear a lot of bravery speeches, but this is just words.
This is a reason why we do not want to buy BTC now and prefer to watch for reversal signs around our resistance 96-97K area. Sooner or later but fundamentals should return control over the market.
I do not have yet the specific picture but, since we have strong upside momentum - it should fade and appearing, say H&S or butterfly pattern, together with completion upside XOP target seems as great combination. Once this patterns will be formed, we could try to use it for short entry.

Bitcoin (BTC/USDT) DAILY MAKE IT OR BREAK IT?With volatility increasing, the next move could set the tone for the coming weeks. Will BTC break out and push higher, or face rejection and retrace? Watch closely! 👀
What’s your bias? Bullish or bearish? Let me know in the comments!

70K doesn't look impossible nowMorning folks,
So, our trading plan worked just great - DRPO on weekly in fact hit 81-82K, so it's minimal target is done.
In fact, BTC, as a Gold now are victims of massive sell-off on stock market. Investors meet margin calls and urgently need cash to fill it back to initial level. That's why they sell everything that they could to get the money. While this process will be underway - BTC remains under pressure. Not occasionally as insiders as Buffett were sitting on cash bags.
Today BTC is oversold. So we do not consider any new shorts and prefer to get the rally to sell into. Supposedly 92.50-92.85 resistance looks interesting for this.
As market probably will close below Dec lows, this is bad for long-term picture and former 70K top might be re-tested in perspective of a few weeks.


btc finds 200 ema support, whats next?As I have been posting in these "Ideas" for the past few weeks about market direction and where the price for BTC will go. It now has come to pass where the 200 EMA has been tested and support has been found, It however has not generated any relief among buyer sentiment unable to push price above the previous days close leaving the digital asset to continue to bleed out and cause positions from all the 93k Bulls to liquidate.
Its a shame people cannot make the connection that the only way price can go higher is to go lower in a market. That Is why I am going to warn people about where we may go , I believe the 200 EMA will be tested again and if support is broken it will send is into the low 70k area where there are open orders and It is possible this may happen. The Bull market support band is the 200EMA however there may be institutional money that may drive us down to cause massive liquidations and fear and panic among those holding bags while greed causes big players to push more into the fringe of where we can maintain a recovery.
Watch for a retest of the 200EMA . which is a bit of a fuzzy zone , use the high and low to denote the area for support as well as keep an eye on the RSI and CCI , we are also watching on balance volume drop off which is not a great sign that there is market confidence however this will play out over the weekly and the weekly candle will start to materialize in the next few days.

NZDCAD Buy setupOANDA:NZDCAD Overall bias on NZDCAD is bullish. Entry is based on the 4H bullish engulfing at the Daily AOI, with the 4H simultaneously rejecting the 0.81654 Daily AOI area.

CADJPY SELL SETUPOANDA:CADJPY Overall bias on CADJPPY is bearish. The previous daily candlestick closed below the daily AOI. Price is making a retest at the daily AOI, currently waiting for an entry signal (bearish engulfing) on the 4H or 1H timeframe to go bearish on CADJPY

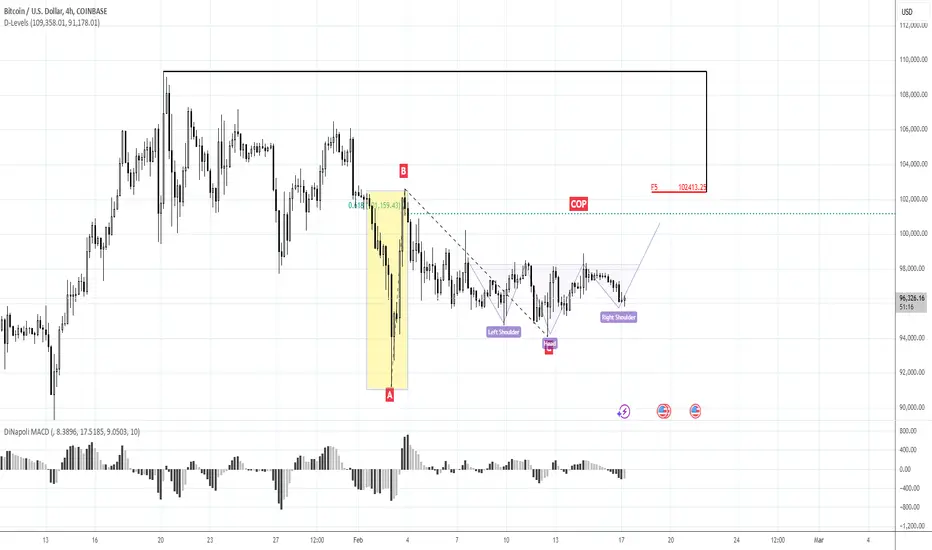
Pain or gainMorning folks,
So, everything goes accurately with the plan - our 1H H&S is ready to start. Even small "222" Buy already has been formed on the bottom.
So, if you would like to buy - this is the point where you have to decide. Upside target is 100.5-101.2K.
At the same time - don't forget that the H&S has to be considered in context of our big bearish weekly DRPO Sell pattern.
If H&S will be completed at 101K - we consider it as a chance to get the short position at better price. Conversely, if BTC starts dropping and H&S start failing. It could mean that downside action starts immediately.
Other words speaking, if BTC will show upside action at all - it has to start it right now. Otherwise, be prepared for collapse.
I mark this setup as a bullish, because of H&S. But in general we have mid term bearish view.
H&S is just a retracement step before downside action.

Another attempt for the 101-102K bounceMorning folks,
So market stands in the narrow range for the 3rd week already and not leaving hopes to show the bounce up to 101-102K area. Last attempt (in the way of cup pattern that we've discussed last time) has failed.
We don't care about it because mostly stay focused on weekly bearish DRPO pattern. Thus, any bounce here we consider first as a chance to Sell. And only second as a possible upside continuation.
For now BTC is trying to make an another attempt and form reverse H&S pattern on 1H chart. So target remains the same 101-102K. We have no intention to go long right now. But, if you trade intraday or just search chances to buy - maybe be this setup might be useful to you.
Supposedly 96K is an area where decision on position taking has to be made.
I keep the "bearish" mark for this setup. But, as now as last time - the bounce to 101-102K area are not excluded.

Bearish context holds. Pullback to 101-102KMorning folks,
A recent few sessions have rather narrow range, so we have little changes since our last discussion.
We have confirmed DRPO "Sell" pattern on weekly chart, so we keep bearish general view on BTC, with potential downside target around 80-81K. This also makes us to not consider any long positions. If even upside bounce will happen - we try to use this rally for short entry later.
Still for intraday traders, if you want to buy BTC, here is some thoughts. First is, and actually why we stay away from longs for now - take a look, after impressive jump BTC stands too long in sideways action. This is not good for bullish scenario.
Now it seems that something like "Cup" or reverse H&S pattern is still forming here. So if you finally will decide to buy - currently is the point where you have to make a decision on entry. Because BTC has to start upside action right now, right from this point or it will not start it at all and drop. We suggest that 101-102K is an area where it would be better to out.
I mark this update as bearish in a row with our major view, but as we've said 101-102 pullback is not excluded.
CHFJPY SELL SETUPOANDA:CHFJPY Overall bias is bearish. Price making a retest at the daily AOI. Waiting for entry confirmation to go short on CHFJPY.

CADJPY buy setupOANDA:CADJPY
Overall bullish bias on CADJPY. 4h bullish structure made a retest at the Daily AOI. Waiting for a 4H or 1H bullish engulfing candlestick to go long on CADJPY

No longs by far. 90-92K stands in focusMorning folks,
Last time we were speaking about possible upside bounce to ~102.5K area. But BTC has failed three attempts to move out from support level where it stands. Despite that upside momentum was not bad.
With the recent high CPI on the table and weekly DRPO "Sell" pattern on the back, we suggest that downside action could start at any time. First target will be ~90-92K area just because this is daily oversold. Weekly pattern suggest target around 80-81K.
By this reason we do not consider any new intraday longs by far. Besides, on daily chart today we could get bearish grabber that supports adea of 90-92K lows level.
