ATOMEUR 'D' - Sat on Support? Or a Drop Incoming?Crypto Tipster v2 sent us a Sell signal on Atom / Eur on the daily chart, and it has proved itself to be quite a reliable indicator with Atom recently! Should we follow this signal? The current price does seem to be sat on nice little ledge of support, but if this was to break down the next support isn't until after a near 30% drop - that could prove to be quite a trade! Keep your stops tight on this one if you do decide to trade, and aim for at least a 20% drop.
Daily Charts

17.15-17.25K for short entryMorning folks,
So, downside action was even sharper than we thought, BTC collapsed without any H&S shape. Now it stands at local support area. We do not consider any long positions by far. For short entry 17.15-17.25 K-resistance area (and former trend line) looks interesting.
Alternatively, if, still, it will be the H&S of a bit larger scale, BTC could climb to 17.40-17.45K to form the right arm, but it doesn't break the context. So, whatever scenario you will choose and if you want to sell - it would be better to place initial stop above 17.5K for some case, or even slightly higher...

EURCAD Update I What to Expect This Week!Welcome back! Let me know your thoughts in the comments!
**EURCAD Analysis - Listen to video!
We recommend that you keep this pair on your watchlist and enter when the entry criteria of your strategy is met.
Please support this idea with a LIKE and COMMENT if you find it useful and Click "Follow" on our profile if you'd like these trade ideas delivered straight to your email in the future.
Thanks for your continued support!

EURUSD TO 1.0750! (Longs)Nice little swing trade on EU here. Could take some time, may not. SL highlighted just under the boxed zone, TP at the base of the highlighted box above. Higher lows consistently being made, and this is based on H4 higher low + bullish retracement on daily before another continuation of bearish cycle.
EU SLs are around 1.0200 zone.
TRADING IDEA --- NOT AN INVESTMENT OPPORTUNITY!

Daily review of BTC interval 4HHello everyone, let's look at the BTC to USDT chart on a 4-hour time frame. As you can see, the price has fallen below the local uptrend line.
Let's start with the support line and as you can see the first strong support is at $17199, if the support is broken then the next support is $17044 and $16924.
Now let's go from the resistance line, as you can see the first resistance is $17702, if you manage to break it, the next resistance will be $17919, $18097 and $18276.
Looking at the CHOP indicator, we see that in the 4-hour interval, the energy begins to gain strength, the MACD indicator confirms the local downtrend, while the RSI shows a rebound, but we are still around the middle of the range, which may indicate a continuation of the correction.

17.9K seems interesting for short entryGood morning,
So, the bullish "Wild card" discussed last time has worked and BTC has completed 17.8-18.2K targets that we've discussed. Does it change something? No. Overall context remains bearish. Recent Fed statement, although has matched to expectations but still was slightly hawkish as just two members voted for the terminal rate below 5%. Market now stands at solid resistance area and we do not see any attractive decisions for bulls by far.
Bears have two options, either try to go with this minor H&S pattern on 1H chart, and take position around Fib levels with stop above the high. Or - watch for the same H&S pattern but of larger scale on 4H chart. If ECB fails to provide hawkish statement today EUR turns down sharp and major downside action could start across the board, like on Gold market right now.

Daily review of BTC interval 4HHello everyone, let's look at the BTC to USDT chart on a 4-hour time frame. As you can see, the price is moving above the local downtrend line.
Let's start with the support line and as you can see the first support in the near future is $16960, if the support is broken then the next support is $16900, $16852 and $16804.
Now let's move on to the resistance line, as you can see the first resistance is $17032, if you manage to break it, the next resistance will be $17130, $17210 and $17292.
Looking at the CHOP indicator, we see that in the 4-hour interval some of the energy has been used, the MACD indicates that we are moving in a downtrend.

Bullish wild card Morning folks,
Well, technical picture, no doubts, stands bearish. We've warned you about it within recent few weeks, and since the beginning of 2022 in a scale of monthly and weekly time frames. Now, if we wouldn't have CPI and Fed I would call for short entry. But, due coming important data we need to wait and get more confirmation.
At the same time, CPI and Fed could provide the "wild card" if CPI will be weak and Fed will be dovish. In this case all markets across the board could show short-term action, and it could be more or less strong. That's why we show you all scenarios that potentially you could follow, depending on your view.
First is a bullish "wild card' Scenario. You could consider this butterfly with placing stop just under its lows. Target might be either 17.7, or even XOP target around 18.2K. Features of this trade are - low chances on success, but low potential loss and huge reward if "wild card" will be given.
Second is bears - you need to keep an eye on 16.5-16.6K support and its downside break. Once it will happen, it is possible to consider short entry. Theoretically you could use Stop "Sell" entry order somewhere under 16.5K.
Finally, you could combine both scenarios.... if you brave enough ;)

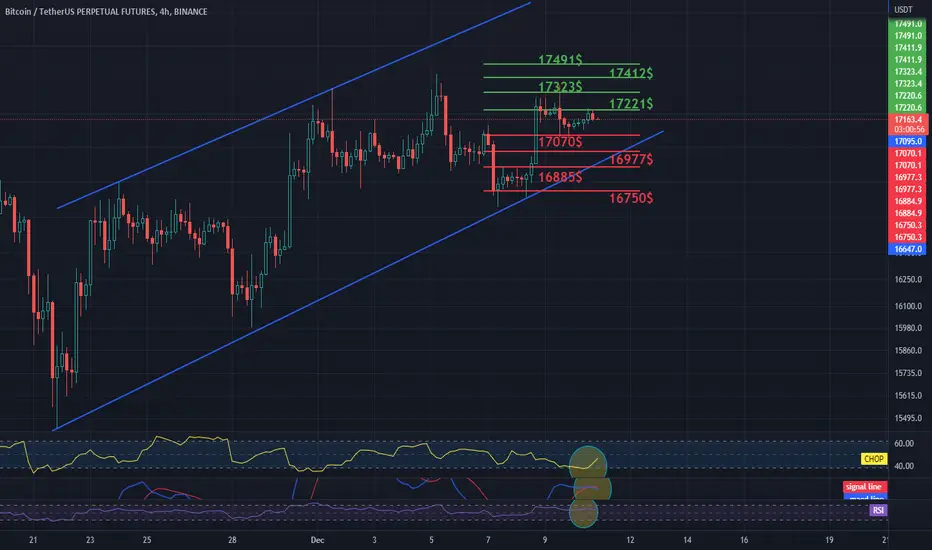
Daily review of BTC interval 4HHello everyone, let's look at the BTC to USDT chart on a 4-hour time frame. As you can see, the price has been moving in an uptrend channel for almost twenty days, which we have marked with blue lines.
It is now worth checking what supports we should consider in the coming hours or days and as you can see the first support is $17070, if the support is broken then the next support is $16977, $16885 and $16750.
Now let's go from the resistance line, as you can see the first resistance that the price has to overcome and positively test is $17221, if you manage to break it the next resistance will be $17323, $17412 and $17491.
Looking at the CHOP indicator, we see that in the 4-hour interval, the energy begins to gain strength, the MACD indicator indicates that we have entered a local downtrend, while the RSI shows that we are quite high and we should consider hedging the position in case of a correction.
Daily review of BTC interval 4HHello everyone, let's look at the BTC to USDT chart on a 4-hour timeframe. As you can see, the price is moving above the local uptrend line.
Let's start with the support line and as you can see the first support in the near future is $17132, if the support is broken then the next support is $17080, $16997 and $16897.
Now let's move to the resistance line, as you can see the first resistance is $17217, if you manage to break it, the next resistance will be $17319, $17403 and $17480.
Looking at the CHOP indicator, we see that almost all energy has been used in the 4-hour interval, the MACD indicator indicates that we are maintaining a local uptrend, and the RSI is very high, which may indicate a price correction.

Price Action - (Defined Low)We have a defined low that comes in at 681.58
The previous low @ 772.95 was traded below. The sell stops that were protecting those long positions were traded into with this new low (681.51)
After this new low was created price action impulsively moved away in bullish momentum, to do what?....
Hit the buy stops that were created @ the previous short term high @ (1031.95)
That short term high (1031.95) was traded through eventually (which is highlighted with the shaded circle) and price starts trading higher
I'll leave the purple shaded area open for comment, let me know if you see the clues the market left behind!
Thank You

16.5-16.6K area is vitalMorning folks,
BTC looks weak. Maybe coming PPI numbers tomorrow and CPI + Fed on Tue could support market in short-term, but data release can't change the fundamental background that is vitally hurt by FTX tragedy. Confidence in crypto market is lost now.
Speaking about our technical setup - market has failed to stay above 17060 level that was crucial for the bulls, we've discussed it last time. Now we see signs of weakness and think that there are few chances on upside continuation. In fact, if 16.5-16.6K level will be broken - price starts action back to 15.5K lows first and even lower in longer perspective.
So, if you would like to take the short position - watch for downside breakout of this level. We do not see good context for long entry now.

AUDUSD a move to the 0.66?🦐AUDUSD on the 4h chart is trading inside an ascending channel.
The market is now testing the lower trendline and a possible break can be expected during this week.
How can i approach this scenario?
I will wait for a potential break of the dynamic support and IF the price satisfy the condition i will apply a nice short order according to the Plancton's strategy rules.
–––––
Follow the Shrimp
Keep in mind.
🟣 Purple structure -> Monthly structure.
🔴 Red structure -> Weekly structure.
🔵 Blue structure -> Daily structure.
🟡 Yellow structure -> 4h structure.
⚫️ Black structure -> <4h structure.
Here is the Plancton0618 technical analysis , please comment below if you have any question.
The ENTRY in the market will be taken only if the condition of the Plancton0618 strategy will trigger

17.6-17.7 K seems the ceil nowMorning folks,
So, let's keep going with our reverse H&S and its targets. As we've said, the first one was hit last week. Once OP is done, BTC has formed minor triangle consolidation which is broken up now. Next H&S target is XOP around 18.15K. But the problem is 17.5-17.7K strong resistance area, that includes Fib level and previous daily lows.
As you know we're skeptic on any upside action on BTC and have not taken longs since the beginning of 2022. And we're not going to do it now, although it could climb a bit more. Mostly we're considering 17.6-18.15K area as potential for selling. Before major reversal happens, all markets could climb a bit higher - EUR (to 1.0595-1.0610), Gold (to ~1825) but everywhere, the background for reversal is growing. So the same on BTC.
If you still would like to buy - you could consider 17.15K Fib support and keep an eye on 16.95K area - market should not break it down. If it will - the bullish party probably is over.

GBPNZD Short (Daily)Lower high formed, and a nice rejection from the 36ema. We are headed back down to the daily lows, 2R trade, given an intraday SL.
TRADING IDEA -- NOT AN INVESTMENT OPPORTUNITY

18-18.2KMorning folks,
So, our 1H H&S pattern that we've discussed last time is started well. In fact, as all other markets, BTC has got the same boost from J. Powell. Since this is external factor, hardly it will last too long. But positive NFP numbers should let BTC to complete 18-18.2K extended AB-CD target.
Once this will be completed, BTC hits strong daily resistance area, that hardly will be broken as overall sentiment remains negative here. We sure that markets wrongly understand Fed comments, accepting what they want to hear but ignoring all the other information. Our suggest that Fed slows the pace of rate hike because it is frightened with possible disaster consequences but not because inflation is defeated and the US economy is returning back to growth. Absolutely not, but particularly in this way markets understand the recent comments.
That's being said, we suggest that BTC could climb slightly higher, but hardly it will break 18-18.5 resistance area.

everything could have just changedif we see downside in semiconductors and rotation between sectors tha is slower and more masured leading to slower losses in indices, and the countertrend movement breaks out into a larger rebound i would call this the beginning of a broader market recovery. the inverse is that we traverse slightly lower, and extend backwardation with resistance around estimate (we are now below) and not seeing support till lower envelope. basically the trend is threatening to reverse in short and in long term, and if sss signal stays green index could be a buy. top of channel is not out of the question.

15.95-15.97KMorning folks,
Last time we've discussed this H&S pattern, it was just on a starting stage. Now it is almost completed. You know our position, we're skeptic on any bullish performance as there are now fundamental background for it. And we mostly are watching for this H&S failure.
But... those who have bullish view, could consider 15.95-15.97 support area, where the lows of right arm are likely to be formed. This is Agreement of downside 1.618 AB-CD pattern and major 5/8 support. This area doesn't guarantee you success, but definitely it gives you minimal potential loss as you could hide your stop very close.
Bears should watch for downside breakout of this area. And, somewhere around 15.55-15.6K it is possible to consider using of Stop "Sell" entry orders.

Skeptic on bullish potentialMorning folks,
BTC is taking pause and delays downside action to 14.8 and 13K target due to external factors. Mostly due to short-term dollar weakness that we suggest should last until the end of November. We keep valid mentioned targets and think that they will be completed, but a bit later than we initially thought.
We're skeptic on any bullish performance on BTC and do not intend to take the long position. If BTC appears to be strong enough, it could try to complete this reversed H&S pattern with ~17.5-17.8K target. So, the choice is up to you whether to trade it or not. We intend to use it for short entry at better price, if it still will reach the target.

NAS 100 I It will rise from support Welcome back! Let me know your thoughts in the comments!
**NAS 100 - Listen to video!
We recommend that you keep this pair on your watchlist and enter when the entry criteria of your strategy is met.
Please support this idea with a LIKE and COMMENT if you find it useful and Click "Follow" on our profile if you'd like these trade ideas delivered straight to your email in the future.
Thanks for your continued support!
Brian & Kenya Horton, BK Forex Academy

14.8 and 13.9KGood morning,
BTC mostly accurately completed our Thu analysis, showing just minor upside action to 17K and then has turned down again. We expect hawkish Fed minutes on Wed and consider no long position. Nearest standing targets are 14.8K and 13.9K of potential downside butterfly pattern.

EURUSD DailyCan I just say WOW at the rejection at the 200MA ?!? Honestly this is playing out how I would like to see the market.
I recognize a price action candle, the shooting star. The shooting star often occurs when the market is buying and begins to react at some level of resistance. I am identifying my level of resistance as the 200MA.
I would like to see todays candle (11/16) to close as an engulfed candle. ONLY IF todays candle close with momentum, the market is likely to continue to sell…
But as of right now, I am going to sit on my hands and continue to watch the market form.

16-16.1K is a vital areaMorning folks,
BTC performance looks weak, price is forming triangle consolidation after solid drop, which has more chances on downside continuation. Last time we have considered long entry on a pullback, and in general setup has worked nice. If you still keep longs - move stops to breakeven. If you do not have longs - do not take it by far. BTC could show minor upward action, and maybe re-test 17K area, but we're skeptic of extended bullish performance. Usually upward trend looks different.
For the bears - watch for 16-16.1K support area. Downside breakout will be the vital point of short-term tendency turn into bearish and puts odds in favor of downside triangle breakout.
