DASH keeps trending down, short entry investment signalAfter testing the top trend line of the downtrend channel where the crypto pair has been moving within the last days, DASH continues showing a bearish mood, which indicates short entries are the way to make money with this Cryptocurrency during the day.
Dashbtc

DASHTechnically speaking it could pump, but it is all dependent on which way BTC will decide to go. Seeing momentum switch from Larger caps to Mid-cap coins, so although this setup looks good, I'm staying cautious with a tight stop on this one.

Dashing to MA200*** THIS IS NOT AN ADVICE, DO YOUR RESEARCH AND TRADE WITH YOUR OWN RESPONSIBILITY***
Dash is interesting here.
Symmetrical Triangle breakout, literally text-book.

DASH/BTC in a falling wedge, short-term.DASH has been in a falling wedge since Feb 19, if it manages to do a breakout the price will rise to 0.021850, if the price drops bellow 0.02060 the price will test the 0.020000 support.
Instructions:
Buy DASH at 0.021050
Take profit at 0.022100 or 0.023050
Stop loss at 0.020550 or 0.019850


DASH/BTC flagging up ready to make a decisionDash has had a good steady increase in volume on the daily and after the last push its had a nice healthy retrace forming a descending wedge and respecting the fib levels with a nice bounce off the 50% and now holding onto the 38%
have entered here between the 38 and 50 but have laddered buys down to the 618 incase we get a lucky dip or this wedge takes a little longer to play out, stops below the 618 but have plenty of room for a wick out.
shooting for the 1.272 extension which i can see a supply block there thats been respected and rejected there a few times already, playing it safe for a 12-15% push.

A trading opportunity to buy in DASHBTCTechnical analysis:
. DASH/BITCOIN is in a range bound and the beginning of uptrend is expected.
.The price is above the 21-Day WEMA which acts as a dynamic support.
. The RSI is at 54.
Trading suggestion:
. There is a possibility of temporary retracement to suggested support zone (0.02092000 to 0.01772000). if so, traders can set orders based on Price Action and expect to reach short-term targets.
Beginning of entry zone (0.02092000)
Ending of entry zone (0.01772000)
Entry signal:
Signal to enter the market occurs when the price comes to "Buy zone" then forms one of the reversal patterns, whether "Bullish Engulfing" , "Hammer" or "Valley" in other words,
NO entry signal when the price comes to the zone BUT after any of the reversal patterns is formed in the zone.
To learn more about "Entry signal" and the special version of our "Price Action" strategy FOLLOW our lessons:
Take Profits:
TP1= @ 0.02589200
TP2= @ 0.02822700
TP3= @ 0.03294000
TP4= @ 0.04231000
TP5= @ 0.04986000
TP6= @ 0.05745000
TP7= @ 0.06824000
TP8= @ 0.08202000
TP9= @ 0.09200000
TP10= Free


DASH-BTC Long Trade PlanCommodity : DASH
Trade Type : LONG
Trading Against : BITCOIN
Entries : Double-UP Entries throughout the Buy Zone
Profit Taking : 25% at each TP point
Profit Locking : Move SL to break even once TP1 is hit, to TP1 once TP2 hits, to TP2 once TP3 hits and so on
Duration - 1-2 weeks
Investment in trade : 10% of the total Trading Balance.
Prospective Profit : 3.55% to 13.25%
Prospective Loss : 2.14%
RRR : SL to TP1 is 1.66, SL to TP2 is 2.83, SL to TP3 is 4.28.4 and SL to TP4 is 6.2
Buy Zone/TPs/SL price points are marked in the chart as follows
Greens - Profit Targets (TPs)
Blue - Buy Zone (Entries)
Red - Stop Loss (SL)


Dash ($DASH) - up to 468% PPT! Long term trade.$DASH is one of the top currencies on crypto market.
It has a great community support and great team.
Green - buy. Red - sell.
I do not recommend to use this chart for margin trading.
It's not a financial advice.
Trade carefully and good luck!


Dash Bullish ReversalDash Bullish Reversal
Dash in Daily Shows Bullish Trend After Re-Pentrated at 0.020776
This Is Good News To Buy A Dash
Buy Under 0.022
TP 1: 0.023
TP 2: 0.025
TP 3: 0.027
SL: 0.018999


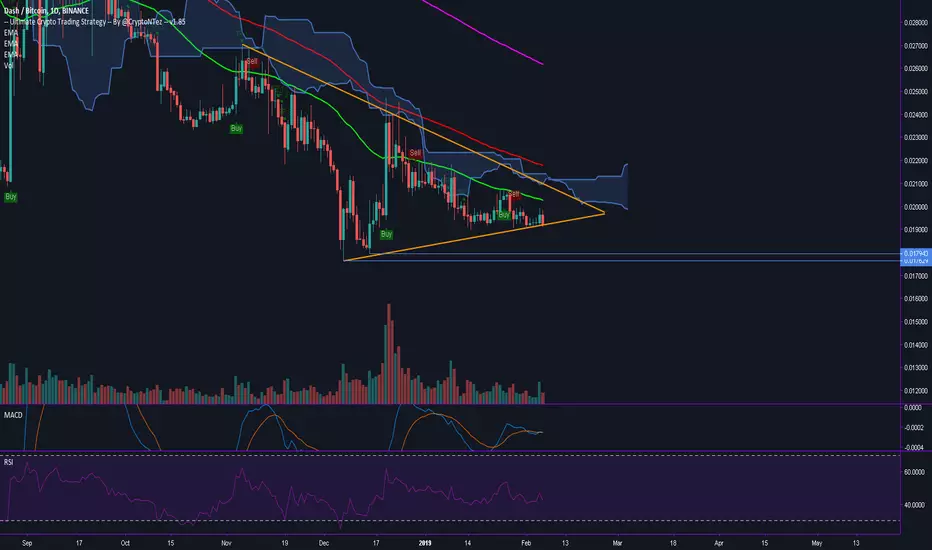
Not looking very good... overall picture Symmetrical triangle. RSI bearish, MACD flat, and a several time rejected EMA50 resistance keep pushing the price down. (Volume decreasing...)....
Moving into the 6H chart, Sell signal from the Ultimate Crypto Trading Strategy indicator, MACD about to do a bearish cross, RSI falling. If the trendline from the triangle doesnt hold we can go retest all time lows (warning) #DASH Stay safe
DASH Longterm BUY
DASHBTC is situated into a huge falling wedge since 13 november 2017 untill today. At this market stage we need to be patience,so i get some Dash for long term.I don t know when will broke this downtrend BUT it will broke out because a falling wedge is a reversal pattern(from bearish to bullish)
RSI is below 40 on the weekly timeframe which means dash is currently into a bear market from 11 june 2018 untill now.Above 40 RSI weekly timeframe DASH will turn into BULLISH MODE
We have a weekly bullcross at stochastic but with this volume i didn t expect any breakout
Macd is below neutral (0) zone
If you are buy here Dash and you have patience,you can make more then 200% from here. In my opinion the BOTTOM of DASH is NEAR at 0.0150. It s a long term investment!

DASH - looking similair to BTC right now. Pattern looks decent and the ABC correction lining up with the imbalance zone.
Keeping an eye on this one.

DASHBTC [Daily] 25% down from here, then short squeeze ?Bears are dominating here… If my way of thinking is correct still 25% down from here possible towards 0,015 and maybe below before real short squeeze….

