DAX, FTSE 100 Technical OutlookThe DAX is on the ropes and considering a break of support. If bears succeed, it could signal a deeper pullback for the FTSE 100.
Matt Simpson, Market Analyst at City Index
DAX Index

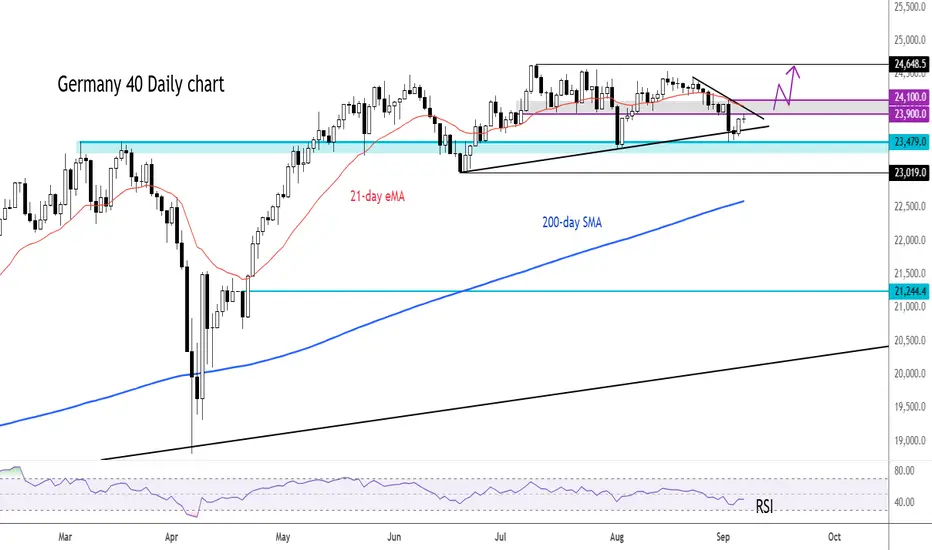
DAX gearing up for a breakout?The lengthy consolidation on the DAX means the German index is no longer technically overbought on the weekly and lower time frames. The monthly is still above 70.0 but with other global indices looking strong, the DAX could be about to break higher again.
For confirmation i would like to see a break above the bearish trend line and ideally a move above the next band of resistance between 23,900 to 24,100. If and when the DAX clears this area, any rounded retest of this zone from above could potentially offer a decent bounce trade, targeting new record highs.
Meanwhile key support continues to remain near the old highs of around 24,480 or so (shaded in blue).
By Fawad Razaqzada, market analyst with FOREX.com
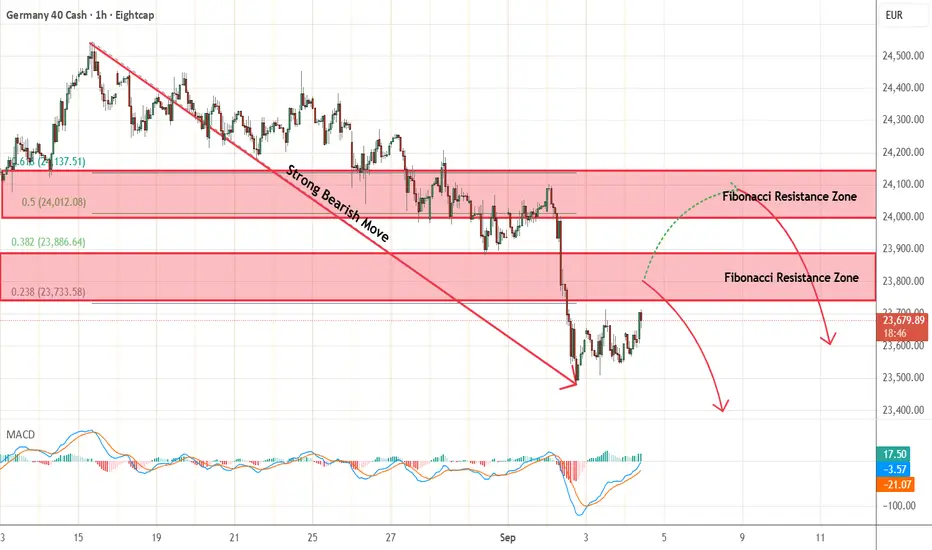
Dax - Short Term Sell IdeaH1 - Strong bearish move.
No opposite signs.
Currently it looks like a pullback is happening.
Expecting bearish continuation until the two Fibonacci resistance zones hold.
If you enjoy this idea, don’t forget to LIKE 👍, FOLLOW ✅, SHARE 🙌, and COMMENT ✍! Drop your thoughts and charts below to keep the discussion going. Your support helps keep this content free and reach more people! 🚀
-------------------------------------------------------------------------------------------------------------------
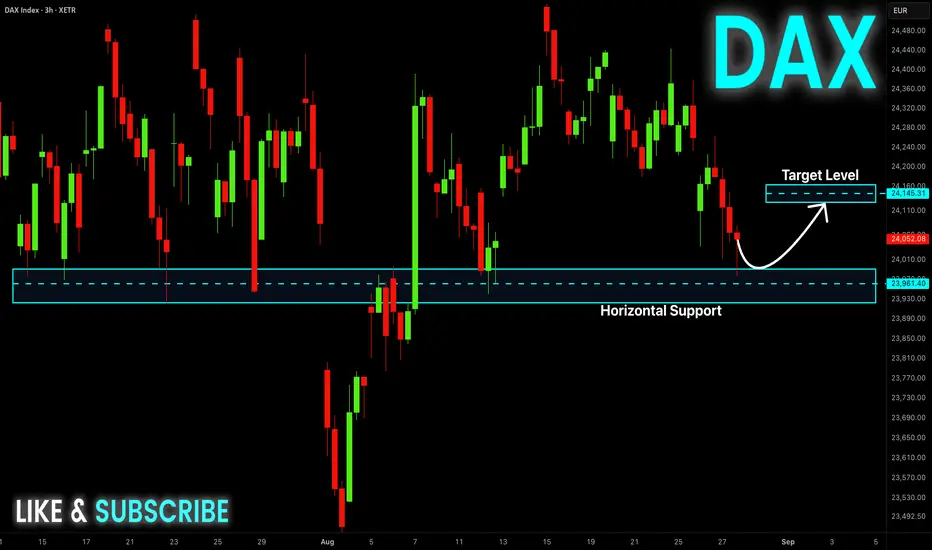
DAX consolidation suported at 23950The DAX remains in a bullish trend, with recent price action indicating a potential oversold rally within the broader uptrend.
Support Zone: 23400 – a key level from previous consolidation. Price is currently testing or approaching this level.
A bullish rebound from 23400 would confirm ongoing upside momentum, with potential targets at:
23950 – initial resistance
24116 – psychological and structural level
24250 – extended resistance on the longer-term chart
Bearish Scenario:
A confirmed break and daily close below 23400 would weaken the bullish outlook and suggest deeper downside risk toward:
23250 – minor support
23094 – stronger support and potential demand zone
Outlook:
Bullish bias remains intact while the Dax40 holds above 23950. A sustained break below this level could shift momentum to the downside in the short term.
This communication is for informational purposes only and should not be viewed as any form of recommendation as to a particular course of action or as investment advice. It is not intended as an offer or solicitation for the purchase or sale of any financial instrument or as an official confirmation of any transaction. Opinions, estimates and assumptions expressed herein are made as of the date of this communication and are subject to change without notice. This communication has been prepared based upon information, including market prices, data and other information, believed to be reliable; however, Trade Nation does not warrant its completeness or accuracy. All market prices and market data contained in or attached to this communication are indicative and subject to change without notice.

DAX: Move Down Expected! Short!
My dear friends,
Today we will analyse DAX together☺️
The in-trend continuation seems likely as the current long-term trend appears to be strong, and price is holding below a key level of 23,552.71 So a bearish continuation seems plausible, targeting the next low. We should enter on confirmation, and place a stop-loss beyond the recent swing level.
❤️Sending you lots of Love and Hugs❤️
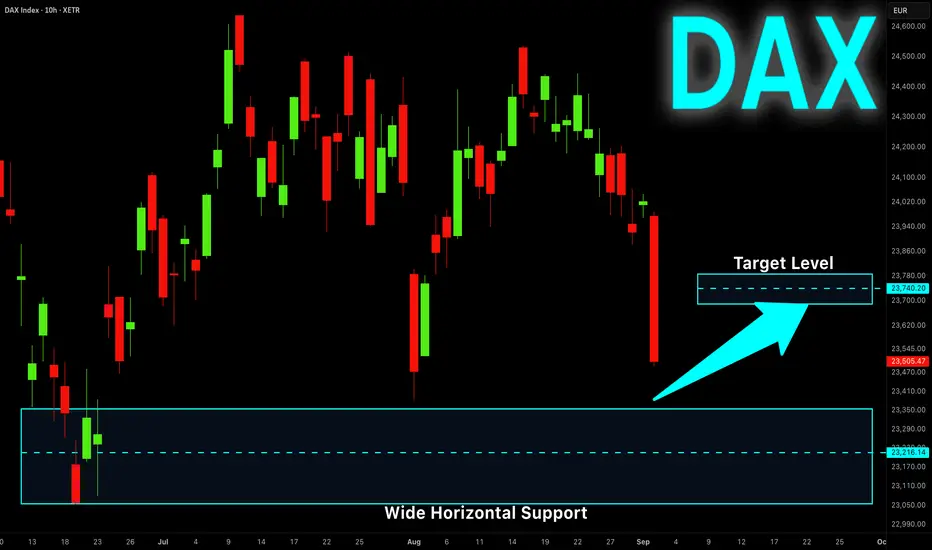
DAX Strong Support Ahead! Buy!
Hello,Traders!
DAX is making a nice
Bearish correction but
The index is generally
In the uptrend and as
The strong horizontal
Demand area is below
Around 23110 from where
We will be expecting a
Bullish rebound and
A move up
Buy!
Comment and subscribe to help us grow!
Check out other forecasts below too!
Disclosure: I am part of Trade Nation's Influencer program and receive a monthly fee for using their TradingView charts in my analysis.
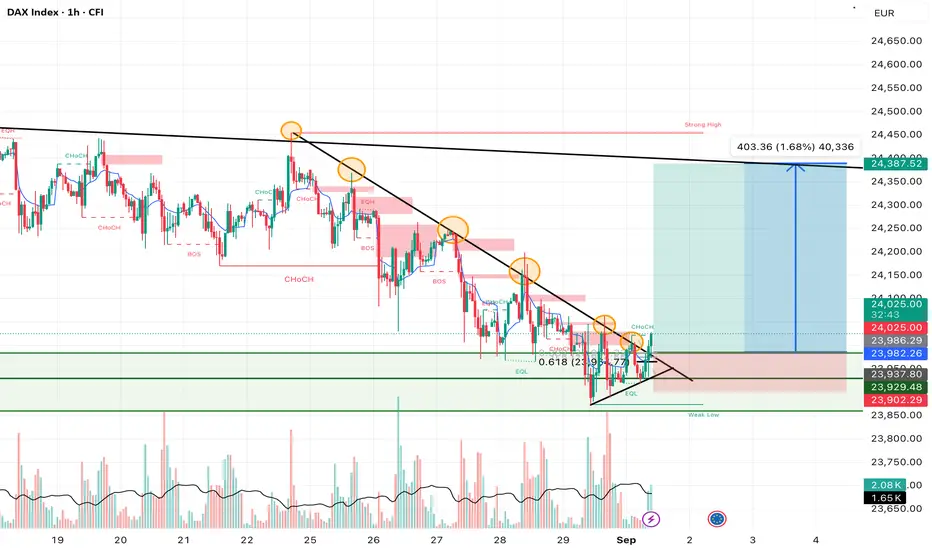
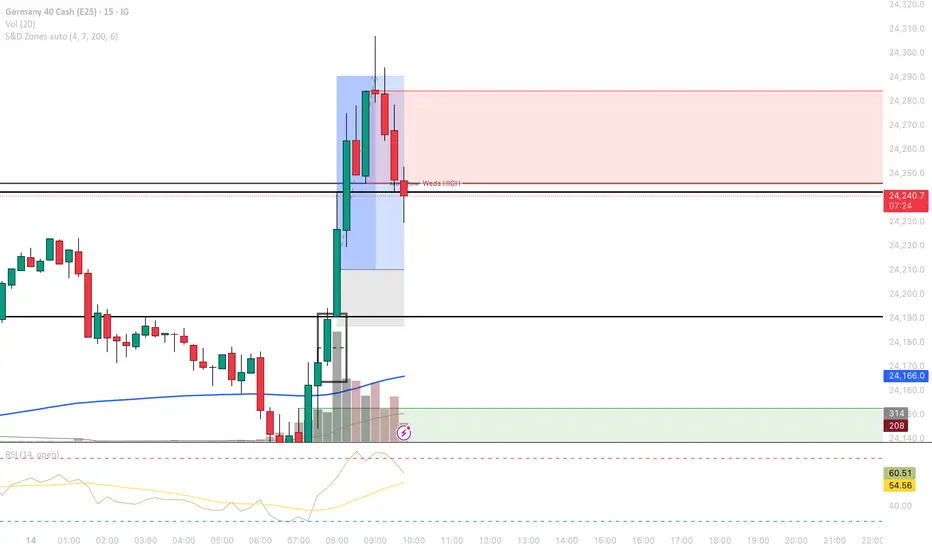
DAX 1H — Clean break of the descending trendline from 22–29 Aug.Context
• Price has been capped by a well-defined descending trendline (orange-tagged lower highs) since last week.
• Into month-end, the selloff lost momentum and compressed into a falling wedge/descending triangle against a 23,93x–23,94x demand (marked by EQL/“weak low”).
• We’ve now impulsed through the local trendline and into the prior 1H supply band, flipping it to potential support.
Structure & confluence on the break
• Multiple BOS/CHoCH prints inside the wedge signaled absorption/basing before the break.
• The breakout occurs around the 0.618 pullback area of the last minor leg, with a neat cluster of equal lows below (liquidity left behind), and room to the upside until the next heavy area: the higher, older trendline / “Strong High” zone.
• Measured from the wedge height, the projection aligns with ~24,387 (shown on chart).
Plan (not financial advice)
• Bias: Long on breakout and/or retest of the broken trendline / prior supply.
• Entry zone: 23,970–23,986 (retest/acceptance above the break).
• Invalidation: 1H close back below 23,930–23,937 (back inside the wedge and under the micro base).
• Protective stop: 23,902 (beneath the “weak low” and wedge base).
• Targets:
• TP1: 24,060 (first 1H supply & dashed mid-range).
• TP2: 24,180–24,220 (prior EQH/dashed line).
• TP3: 24,300 (round number & prior reaction).
• Final: 24,387 (confluence with the higher trendline; your blue arrow).
• R:R guide: From ~23,980 entry to 23,902 stop is ~78 pts risk; to 24,387 is ~+407 pts → ~5.2R if full target prints.
• Management: Once price accepts above ~23,986, consider moving to BE; trail under each new 1H swing low as we stair-step up. Failure to hold 23,970 on the retest = stand aside and reassess.
Alt (bearish) scenario
• A sharp rejection from 24,06x–24,18x and a close back under 23,930 would turn the break into a fake-out, exposing 23,880 → 23,840 and, if that fails, the deeper demand around 23,80x.
Heads-up (event risk this week)
• Eurozone/Germany PMIs (Mon–Tue), Euro area flash HICP (Tue), Germany Factory Orders (Fri), and US NFP (Fri) can all inject volatility—size appropriately and be wary around release times. CFI:GER30
DAX GER40 Technical Analysis: Advanced Weekly Forecast# DAX GER40 Technical Analysis: Comprehensive Multi-Timeframe Trading Strategy & Weekly Forecast
Current Price: 23,939.4 (As of August 30, 2025, 11:54 AM UTC+4)
Asset Class: GER40 / DAX Index
Analysis Date: August 30, 2025
---
Executive Summary
The DAX Index (GER40) continues to showcase remarkable resilience, trading near historic highs at 23,939.4 points. Our comprehensive technical analysis reveals the index has achieved significant milestones, with recent data showing the DE40 reaching 24,084 points on August 28, 2025, despite a monthly decline of 0.55%. The index maintains an impressive 27.35% year-over-year gain, positioning it as one of Europe's strongest performers. Technical confluence suggests potential for further upside toward the 24,500-25,000 zone, contingent on ECB policy support and improving macro conditions.
---
Multi-Timeframe Technical Analysis
Elliott Wave Analysis
The DAX appears to be progressing through a complex corrective pattern within a larger degree bull market:
Primary Count: Wave 5 of (5) within a Grand Super Cycle
Alternative Count: Expanding diagonal formation in final stages
Target Zone: 24,500-25,200 for primary wave completion
Critical Support: 22,800 (Wave 4 low invalidation level)
Long-term Projection: Extension toward 26,000-27,000 in 2026
Wyckoff Market Structure Analysis
Current price action aligns with Wyckoff's Re-accumulation Phase:
Phase: Late Stage Re-accumulation transitioning to Markup
Volume Analysis: Institutional accumulation evident on pullbacks below 23,500
Price Action: Higher lows formation with narrowing consolidation ranges
Composite Operator Activity: Large player absorption at key support levels
W.D. Gann Comprehensive Analysis
Square of 9 Analysis:
- Current price 23,939.4 positioned near critical Gann square resistance
- Next major Gann level: 24,649 (significant 360-degree rotation)
- Time and price confluence: September 21-28, 2025 (Autumn Equinox influence)
- Cardinal squares active at 24,000 and 24,321
Angle Theory Application:
- 1x1 Rising Angle Support: 23,400-23,500
- 2x1 Accelerated Angle: 24,200-24,400 (next resistance cluster)
- 1x2 Support Angle: 22,800-23,000 (major correction target)
Time Cycle Analysis:
- 90-day cycle completion due: Mid-September 2025
- Seasonal Gann Pattern: September-October strength historically favors DAX
- Next major time window: October 15-25, 2025
Price Forecasting:
- Immediate target: 24,200-24,400
- Extended target: 24,800-25,200
- Correction target (if triggered): 22,400-22,800
---
Japanese Candlestick & Harmonic Pattern Analysis
Recent Candlestick Formations (Daily Chart)
Doji Formation: August 28-29 showing indecision at resistance
Long Lower Shadows: Indicating strong buying support below 23,800
Hammer Patterns: Multiple occurrences near 23,500-23,600 support zone
Volume Confirmation: Bullish divergence with increasing volume on rallies
Harmonic Pattern Recognition
Bullish Gartley Pattern: Completion zone 23,200-23,400 (recent support test)
ABCD Extension: Active pattern targeting 24,480-24,650
Butterfly Pattern Potential: Watching for completion near 24,800-25,000
Fibonacci Harmony: 1.618 extension projects to 24,756 from recent swing low
Advanced Pattern Confluence
Three Drives Pattern: Currently in third drive toward 24,200+
Cypher Pattern: Potential reversal zone at 24,500-24,800
Bat Pattern Setup: Monitoring for completion signals above 24,000
---
Ichimoku Kinko Hyo Analysis
Current Cloud Structure (Daily Chart)
Price Position: Solidly above Kumo cloud (strongly bullish)
Tenkan-sen (9-period): 23,847 (short-term trend line)
Kijun-sen (26-period): 23,712 (medium-term trend support)
Senkou Span A: 23,780 (leading span A)
Senkou Span B: 23,445 (leading span B - key support)
Chikou Span: Positioned above price action confirming bullish momentum
Future Kumo (26 periods ahead):
- Thick ascending cloud structure indicating continued bullish bias
- Cloud support zone: 24,200-24,400 (future support levels)
- Kumo twist anticipated: Mid-October 2025
Ichimoku Trading Signals
TK Cross: Tenkan above Kijun (bullish signal active)
Price vs Cloud: Above cloud with strong momentum
Chikou Span: Clear above price history (confirmation signal)
---
Technical Indicators Deep Dive
RSI (Relative Strength Index) Analysis
Daily RSI: 64.8 (healthy bullish momentum, not overbought)
Weekly RSI: 58.3 (room for further upside)
4H RSI: 67.2 (approaching overbought but sustainable)
RSI Divergence: No bearish divergence detected, momentum intact
Bollinger Bands Analysis
Current Position: Price testing upper band resistance
Band Width: Expanding, indicating increasing volatility
BB Squeeze: Recent breakout from squeeze formation
%B Indicator: 0.78 (strong but not extreme reading)
VWAP Analysis (Volume Weighted Average Price)
Daily VWAP: 23,876 (current support level)
Weekly VWAP: 23,654 (key support zone)
Monthly VWAP: 23,423 (major trend support)
Volume Profile: High volume acceptance above 23,500
Moving Average Structure
10 EMA: 23,789 (immediate dynamic support)
20 EMA: 23,712 (short-term trend support)
50 SMA: 23,534 (intermediate support)
100 SMA: 23,287 (key trend support)
200 SMA: 22,845 (major trend support)
Moving Average Signals:
- All major EMAs in bullish alignment
- Golden Cross intact (50/200 cross maintained)
- Price above all key moving averages
---
Support & Resistance Analysis
Primary Resistance Levels
1. R1: 24,000 (psychological and Gann resistance)
2. R2: 24,200-24,400 (2x1 Gann angle cluster)
3. R3: 24,500-24,650 (Harmonic completion zone)
4. R4: 24,800-25,000 (Major extension target)
5. R5: 25,200-25,500 (Long-term Elliott Wave target)
Primary Support Levels
1. S1: 23,712 (Kijun-sen support)
2. S2: 23,500-23,600 (recent swing low zone)
3. S3: 23,200-23,400 (Harmonic support/Weekly VWAP)
4. S4: 22,800-23,000 (1x2 Gann angle/100 SMA)
5. S5: 22,400-22,600 (Major correction target)
Volume-Based Support/Resistance
High Volume Node: 23,400-23,600 (strong support zone)
Low Volume Gap: 24,100-24,300 (potential fast move zone)
Volume Resistance: 24,500+ (historical selling pressure)
---
Multi-Timeframe Trading Strategies
Scalping Strategy (5M & 15M Charts)
5-Minute Timeframe Approach:
Entry Signals: Pullbacks to 10 EMA with RSI <35
Profit Targets: 30-50 points per trade
Stop Loss: 20-25 points maximum risk
Volume Filter: Require above-average volume on entries
Time Window: Focus on 9:00-11:00 AM and 2:00-4:00 PM CET
15-Minute Scalping Strategy:
Range Trading: Current range 23,850-24,050
Breakout Method: Volume spike above 24,050 for continuation
Mean Reversion: Fade moves beyond 2.5 standard deviations from VWAP
Risk Management: Maximum 3 trades per session, 1:2 risk-reward minimum
Intraday Trading Framework (30M, 1H, 4H)
30-Minute Chart Strategy:
Trend Following: Long above 20/50 EMA confluence (23,750)
Pattern Trading: Flag and pennant formations near resistance
Target Methodology: Initial 24,100, extended 24,300
Risk Parameters: 40-60 point stops, 2.5:1 reward-to-risk
1-Hour Chart Approach:
Momentum Trading: MACD bullish crossovers above signal line
Support Bounces: Long positions from 23,650-23,750 zone
Resistance Testing: Monitor price action at 24,000 level
Session Management: European session focus (8:00 AM - 5:00 PM CET)
4-Hour Swing Setup:
Cloud Trading: Long positions on Ichimoku cloud support tests
Elliott Wave: Ride Wave 5 extensions toward 24,500+
Fibonacci Levels: Use 38.2% and 50% retracements for entries
Hold Duration: 2-5 days typical position holding period
Swing Trading Strategy (Daily, Weekly, Monthly)
Daily Chart Methodology:
Breakout Strategy: Long on sustained breaks above 24,000
Pullback Entries: Accumulate on tests of 23,400-23,600
Target Progression: 24,200 → 24,500 → 24,800
Position Sizing: Scale in on multiple time frame confirmations
Weekly Chart Analysis:
Primary Trend: Remains strongly bullish above 23,000
Swing Targets: 24,500-25,000 zone for major profit-taking
Risk Management: Weekly closes below 22,800 signal major reversal
Monthly Chart Perspective:
Long-term Trajectory: Multi-year uptrend intact
Secular Bull Market: Target zones 26,000-28,000 by 2026-2027
Major Support: 21,500-22,000 zone (not expected to test)
---
Day-by-Day Trading Plan: September 2-6, 2025
Monday, September 2, 2025
Market Status: Full trading session (US markets closed - Labor Day)
European Focus: Increased volatility potential due to US absence
Key Levels:
Resistance: 24,000, 24,150
Support: 23,780, 23,650
Trading Strategy:
Morning Session (9:00-12:00 CET): Range trading likely, fade extremes
Afternoon Session (13:00-17:30 CET): Reduced US influence, European-driven moves
Setup Focus: Long 23,750-23,850, Short above 24,100 without volume
Risk Management: Reduced position sizes due to holiday conditions
Tuesday, September 3, 2025
Market Outlook: Full global participation returns
Key Events: German economic data releases, ECB officials speeches
Strategy Framework:
Breakout Focus: Monitor 24,000 level for volume-confirmed breaks
Economic Data: German manufacturing PMI and employment data impact
Entry Zones: Long 23,800-23,900 on pullbacks
Target Areas: 24,150-24,300 on breakout scenarios
Risk Considerations:
- ECB policy communication sensitivity
- German economic data deviation impact
- Post-holiday volume normalization
Wednesday, September 4, 2025
Market Outlook: Mid-week momentum session with ECB focus
Key Events: Potential ECB policy signals, European inflation data
Trading Approach:
Trend Continuation: Above 23,850 favors further upside
Policy Sensitivity: ECB dovish signals bullish for DAX
Technical Setup: Watch for 1-2-3 reversal patterns at resistance
Volume Analysis: Require institutional participation for sustained moves
Thursday, September 5, 2025
Market Outlook: Pre-weekly close positioning
Focus Areas: Technical level respect, institutional flows
Strategy Elements:
Resistance Testing: 24,200-24,400 zone critical
Support Validation: 23,650-23,750 area strength
Pattern Completion: Monitor harmonic pattern developments
Risk-Off Scenarios: Safe-haven flows could pressure DAX
Friday, September 6, 2025
Market Outlook: Weekly close dynamics, position squaring
Key Considerations: NFP impact on global sentiment, weekly technical levels
Trading Framework:
Weekly Close: Above 23,900 maintains bullish structure
Profit-Taking: Expect some long position liquidation
Gap Risk: Prepare for weekend news flow impact
Setup Preservation: Maintain positions with weekly support above 23,700
---
Macroeconomic & Policy Considerations
European Central Bank Policy Impact
The ECB's monetary policy stance remains crucial for DAX performance. Recent ECB decisions show the Governing Council decided to lower the three key ECB interest rates by 25 basis points in March 2025, with domestic price pressures continuing to ease, with wages growing more slowly. This dovish stance supports equity valuations and German corporate profitability.
German Economic Outlook
The German economic environment presents mixed signals. While economic activity is expected to broadly stagnate in 2025 and trade tensions are set to significantly weigh on exports, there are positive factors including Germany's fiscal stimulus supporting better growth prospects.
Eurozone Growth Projections
The broader eurozone context shows Real GDP projected to grow by 0.9% in 2025, 1.1% in 2026 and 1.3% in 2027, with EA GDP growth to average 0.9% in 2025 and accelerate to 1.3% in 2026.
Key Risk Factors
1. Trade Policy Uncertainty: Trade policy uncertainty over recent months is expected to reduce global growth
2. Global Trade Tensions: Ongoing US-China trade dynamics affecting European exports
3. ECB Policy Divergence: Potential policy normalization pressures
4. Geopolitical Risks: Eastern European tensions and energy security concerns
---
Sector Analysis & DAX Components
Best Performing Components
Current analysis shows the champion of GERMAN STOCK INDEX (DAX) is XETR:ENR — it's gained 265.49% over the year, indicating strong sectoral divergence within the index.
Sector Rotation Implications
Technology Sector: Leading performance driving index higher
Industrial Sector: Mixed performance due to export pressures
Financial Sector: Benefiting from ECB policy normalization expectations
Consumer Discretionary: Supported by potential wage growth and consumer spending
---
Risk Management Framework
Position Sizing Guidelines
Scalping Positions: 0.5-1% account risk per trade
Intraday Trades: 1-2% account risk maximum
Swing Positions: 2-3% account risk per position
Maximum Exposure: 8% total DAX-related risk at any time
Stop-Loss Protocols
Scalping: 20-30 points maximum loss
Intraday: 50-80 points based on volatility
Swing Trading: Below key support levels (23,400 for current longs)
Technical Stops: Below major moving averages and pattern invalidation levels
Profit-Taking Strategy
Scaling Approach: Take 40% at first target, 35% at second target, hold 25% for extensions
Trailing Stops: Implement after 2:1 favorable movement
Time-Based Exits: Close positions before major ECB announcements
Pattern-Based Exits: Honor harmonic pattern completion zones
---
Weekly Outlook Probability Analysis
Bullish Scenario (Probability: 65%)
Catalysts:
- ECB maintains dovish policy stance
- German economic data shows stabilization signs
- Technical breakout above 24,000 with volume
- US-Europe trade tensions remain contained
Price Targets:
- Initial: 24,200-24,400
- Extended: 24,500-24,800
- Optimistic: 25,000+
Neutral/Consolidation Scenario (Probability: 25%)
Characteristics:
- Range-bound trading between 23,600-24,200
- Mixed economic signals from Germany
- ECB policy uncertainty
- Technical indecision at resistance levels
Trading Range:
- Upper Bound: 24,100-24,200
- Lower Bound: 23,500-23,600
- Strategy: Range trading, fade extremes
Bearish Scenario (Probability: 10%)
Risk Factors:
- Significant deterioration in German economic data
- ECB hawkish surprise or policy error
- Major geopolitical shock
- Technical breakdown below 23,400
Downside Targets:
- Initial: 23,000-23,200
- Extended: 22,600-22,800
- Crisis: 22,000-22,400
---
Advanced Trading Techniques
Correlation Analysis
EUR/USD Impact: Strong positive correlation (0.72)
US500 Relationship: Moderate correlation (0.58) with divergence potential
Bond Yields: German Bund yields inverse relationship
Commodity Exposure: Energy prices correlation through industrial components
Options Market Insights
Put/Call Ratio: Currently neutral, no extreme positioning
Options Skew: Slight put premium indicating downside hedging
Gamma Exposure: Positive gamma above 23,800, negative below
Key Strike Levels: 24,000 calls, 23,500 puts show high open interest
Institutional Flow Analysis
Foreign Investment: Positive European equity flows from US institutions
Pension Fund Activity: Rebalancing flows supporting DAX components
Hedge Fund Positioning: Net long but not extreme levels
ETF Flows: Consistent inflows into German equity ETFs
---
For individuals seeking to enhance their trading abilities based on the analyses provided, I recommend exploring the mentoring program offered by Shunya Trade. (Website: shunya dot trade)
I would appreciate your feedback on this analysis, as it will serve as a valuable resource for future endeavors.
Sincerely,
Shunya.Trade
Website: shunya dot trade
---
*This analysis is for educational purposes only and does not constitute investment advice. Always implement proper risk management and consult with qualified financial professionals before making investment decisions.* Disclaimer: This post is intended solely for educational purposes and does not constitute investment advice, financial advice, or trading recommendations. The views expressed herein are derived from technical analysis and are shared for informational purposes only. The stock market inherently carries risks, including the potential for capital loss. Therefore, readers are strongly advised to exercise prudent judgment before making any investment decisions. We assume no liability for any actions taken based on this content. For personalized guidance, it is recommended to consult a certified financial advisor.
---
DAX: Strong Growth Ahead! Long!
My dear friends,
Today we will analyse DAX together☺️
The recent price action suggests a shift in mid-term momentum. A break above the current local range around 23,988.61 will confirm the new direction upwards with the target being the next key level of 23,061.08 and a reconvened placement of a stop-loss beyond the range.
❤️Sending you lots of Love and Hugs❤️

DAX Move Up Ahead! Buy!
Hello,Traders!
DAX is etching closer
Towards the horizontal
Support 23,930 so after
The retest we will be
Expecting a bullish move up
Buy!
Comment and subscribe to help us grow!
Check out other forecasts below too!
Disclosure: I am part of Trade Nation's Influencer program and receive a monthly fee for using their TradingView charts in my analysis.
DAX: Will Go Down! Short!
My dear friends,
Today we will analyse DAX together☺️
The recent price action suggests a shift in mid-term momentum. A break below the current local range around 24,174.74 will confirm the new direction downwards with the target being the next key level of 24,103.39 and a reconvened placement of a stop-loss beyond the range.
❤️Sending you lots of Love and Hugs❤️
#202534 - priceactiontds - weekly update - dax futures Good Day and I hope you are well.
comment: Neutral. I do think this could become a giant bull trap but confirmation is only below 24200. For now it’s best to be neutral since we are in the middle of the triangle. Not much more to read into this so don’t try looking at this for hours and make stuff up. I’d be surprised if we go above 24600.
current market cycle: trading range
key levels for next week: 24000 - 24750
bull case: Bulls need a higher high to open the possibility of re-testing 24700+. Bulls can argue it’s a two-legged pullback (ABC correction) on the daily chart but that’s a tough argument since the market has basically gone nowhere since early June.
Invalidation is below 24200ish
bear case: Bears need something below 24200, until then it’s above two trend lines, daily ema and bears have not made lower lows since start of August.
Invalidation is above 24600
short term: As neutral as can be. Only interested in shorts really but not after Friday. Need to see this becoming a bull trap and bigger selling pressure again.
medium-long term from 2025-08-24: 23000 is my target for the next weeks but for that the market has to stay below 23600.

DAX is forming an interesting short-term patternLooking at the technical picture of DAX, we can see that the German index seems to be preparing for a breakout. Maybe Powell's speech could be that catalyst? Let's find out.
XETR:DAX
MARKETSCOM:DE30
Let us know what you think in the comments below.
Thank you.
75.2% of retail investor accounts lose money when trading CFDs with this provider. You should consider whether you understand how CFDs work and whether you can afford to take the high risk of losing your money. Past performance is not necessarily indicative of future results. The value of investments may fall as well as rise and the investor may not get back the amount initially invested. This content is not intended for nor applicable to residents of the UK. Cryptocurrency CFDs and spread bets are restricted in the UK for all retail clients.

DAX: Move Up Expected! Long!
My dear friends,
Today we will analyse DAX together☺️
The recent price action suggests a shift in mid-term momentum. A break above the current local range around 24,325.95 will confirm the new direction upwards with the target being the next key level of 24,372.55 and a reconvened placement of a stop-loss beyond the range.
❤️Sending you lots of Love and Hugs❤️
DAX: Strong Growth Ahead! Long!
My dear friends,
Today we will analyse DAX together☺️
The recent price action suggests a shift in mid-term momentum. A break above the current local range around 24,246.92 will confirm the new direction upwards with the target being the next key level of 24,297.37 and a reconvened placement of a stop-loss beyond the range.
❤️Sending you lots of Love and Hugs❤️
DAX/GER30 SHORT/LONG sequence Swing Trade +500/+500 points 🔸Hello traders, let’s review the 2hour chart for GER30/DAX. Strong recovery from recent lows, however price testing key resistance and support zones where major reactions are expected.
🔸Speculative setup defined by resistance at 24,500 and key S/R demand zone at 24,000. Both zones have recently been validated with +500 point reactions.
🔸Currently both resistance and support levels are respected and price action remains technical around these areas.
🔸Recommended strategy for DAX traders:
Short Sell at Market from resistance 24,500
SL above resistance, TP 24,200 / 24,100 / 24,000.
Buy & Hold Long from key S/R 24,000
SL below support, TP 24,300 / 24,400 / 24,500.
🎁Please hit the like button and
🎁Leave a comment to support our team!
RISK DISCLAIMER:
Trading Futures, Forex, CFDs and Stocks involves a risk of loss.
Please consider carefully if such trading is appropriate for you.
Past performance is not indicative of future results.
Always limit your leverage and use tight stop loss.

Technical Analysis for GER40 (DAX) Closing Price: 23,372.80 (15th Aug 2025, 11:50 PM UTC+4)
Analysis Methods: Japanese Candlesticks, Harmonic Patterns (ABCD, M/W), Elliott Wave, Wyckoff, Gann Theory (Time/Square of 9/Angles), Ichimoku, RSI, Bollinger Bands, VWAP, Moving Averages (MA/EMA/SMA/WMA).
---------------------------------------------------------------------------------------------
1. Long-Term Trend (Weekly/Monthly)
Elliott Wave:
GER40 is likely in Wave 3 of a broader bull cycle (Wave 1 peak: 22,800, Wave 2 dip to 21,500).
Wave 3 Target: 24,000–24,500 (1.618 extension of Wave 1).
Gann Price Forecasting:
Square of 9: √23,372.80 ≈ 152.90 →
Resistance: 153² = 23,409 (immediate), 154² = 23,716 (swing target).
Support: 152² = 23,104 (daily pivot), 151² = 22,801 (Wyckoff accumulation zone).
Ichimoku (Monthly):
Tenkan/Kijun: Bullish (Tenkan: 22,900 > Kijun: 22,400).
Cloud: Price above thick Senkou Span (22,000–22,500) – structural bullishness.
Moving Averages:
Weekly SMA(100): 22,200 (major support).
Swing Outlook: Bullish. Wave 3 rally targets 24,000–24,500.
2. Medium-Term Swing (4H/Daily)
Harmonic Patterns:
Bearish ABCD on Daily:
A: 23,800 → B: 23,100 → C: 23,550 → D: 23,380–23,420 (1.272 BC extension).
Bullish Crab (W Pattern) forming near 23,100 (0.886 XA retracement).
Wyckoff Phase:
Testing at 23,400:
Upthrust rejection at 23,450 (15th Aug) on low volume.
Spring potential near 23,100 (accumulation signal).
Gann Theory:
Time Window: Aug 18–20 (Square of 9 date cluster) for breakout/reversal.
Price-Time Squaring: 23,372 aligns with Aug 15 – consolidation expected.
Gann Angle: 1x1 angle at 23,300 – close below accelerates selling.
Indicators:
RSI(14) + Bollinger Bands (Daily):
RSI: 64 (neutral, no divergence).
Price testing upper BB(20,2) at 23,450 – expansion hints at volatility.
VWAP (Weekly): 23,250 (swing support).
Swing Trade Setup:
Short near 23,400 (ABCD target) → Target 23,100. Stop-loss: 23,500.
Long near 23,100 (Crab + Gann 151² support) → Target 23,800. Stop-loss: 22,950.
3. Intraday Outlook (5M–4H)
Key Levels:
Resistance: 23,400 (Gann 1x1), 23,450 (weekly high).
Support: 23,300 (VWAP), 23,200 (Ichimoku cloud), 23,100 (psychological).
Indicators:
Ichimoku (1H):
Tenkan: 23,360, Kijun: 23,330 → Price above both (short-term bullish).
Cloud: Bullish (23,280–23,320) – strong support zone.
RSI + Bollinger Bands (4H):
RSI(14): 58 (neutral).
Price near mid-BB(20,2): 23,350 – break below signals bearish momentum.
VWAP + MAs:
VWAP: 23,340 (intraday pivot).
EMA(50): 23,310 (dynamic support).
Candlestick Patterns:
4H Shooting Star at 23,450 (15th Aug) → Bearish reversal confirmed.
1H Bearish Engulfing below 23,380 – adds downside pressure.
Gann Intraday Squaring:
Time Cycle: 8:00–10:00 AM CET (European open) for volatility.
Price Harmony: Close below 23,350 targets 23,300 → 23,250.
Intraday Trade Plan:
Sell below 23,350 → Target 23,300 (VWAP) → 23,250 (Ichimoku cloud).
Buy above 23,400 only with RSI <60 → Target 23,450.
Stop-Loss: 25–30 points risk.
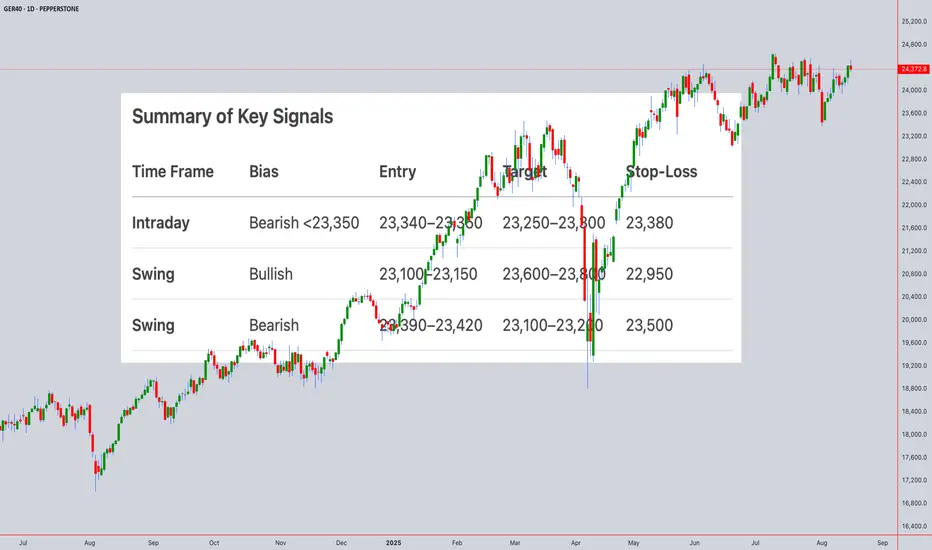
Summary of Key Signals
Time Frame Bias Entry Target Stop-Loss
Intraday Bearish <23,350 23,340–23,350 23,250–23,300 23,380
Swing Bullish 23,100–23,150 23,600–23,800 22,950
Swing Bearish 23,390–23,420 23,100–23,200 23,500
Critical Events Ahead:
Gann Reversal Window: Aug 18–20 (watch for Eurozone CPI/GDP data).
Daily Close >23,450 invalidates bearish ABCD and targets 23,716.
Risk Note: GER40 is sensitive to EU political/energy risks. Use tight stops during news events.
Disclaimer: Technical analysis is probabilistic and based on historical patterns. Fundamental drivers (e.g., ECB policy, German industrial data) may override technical signals. Always use risk management.
For those interested in further developing their trading skills based on these types of analyses, consider exploring the mentoring program offered by Shunya dot Trade . (world wide web shunya dot trade)
I welcome your feedback on this analysis, as it will inform and enhance my future work.
Regards,
Shunya.Trade
world wide web shunya dot trade
⚠️ Disclaimer: This post is educational content and does not constitute investment advice, financial advice, or trading recommendations. The views expressed here are based on technical analysis and are shared solely for informational purposes. The stock market is subject to risks, including capital loss, and readers should exercise due diligence before investing. We do not take responsibility for decisions made based on this content. Consult a certified financial advisor for personalized guidance.
German / DEU40 / GER 40 - Heading SouthThe DAX (GER40) is hovering just around 24500 – not far from recent highs – but momentum is fading and Friday’s typical “profit-taking weakness” is already setting in.
From a technical perspective, the index is stuck near VWAP with flat RSI and decreasing volume. Price has failed to convincingly break higher this week and is starting to roll over. Buyers look tired, and Friday is not usually their strongest day.
Fundamentally, things aren’t looking too solid either:
- European data continues to underwhelm.
- Global risk sentiment is shaky as everyone waits for potential fallout from the Trump–Putin meeting today.
- Inflation ghosts are creeping back in, and central banks remain as noncommittal as ever.
Conclusion for me:
I’m leaning short into into the day. If we start slipping below 24,400 with volume, I expect some acceleration.
T1: 24,410
T2: 24,300
T3: 24,100
The one unpredictable variable? Again - The world's leaders. Their random decisions can obliterate any setup in seconds. Markets follow structure... until a politician wakes up and chooses violence. Today is a special day with the upcoming Meeting - Be careful. On the other hand, - one negative news regarding this upcoming event can nuke all the high expectations that are already priced in, which, in my opinion, strenghtens this trade!
No trading advice – just how I see it.

DAX ORBAnother beautiful dax ORB moment. Dax continues to impress with its amazing ORB movement and rarely fails, allowing good rr and high win rate. Easiest strategy EVER!
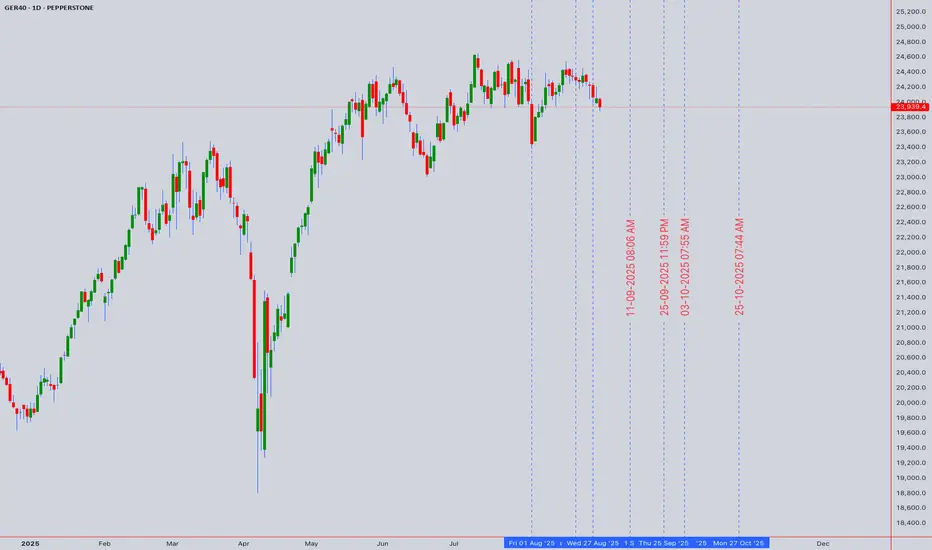
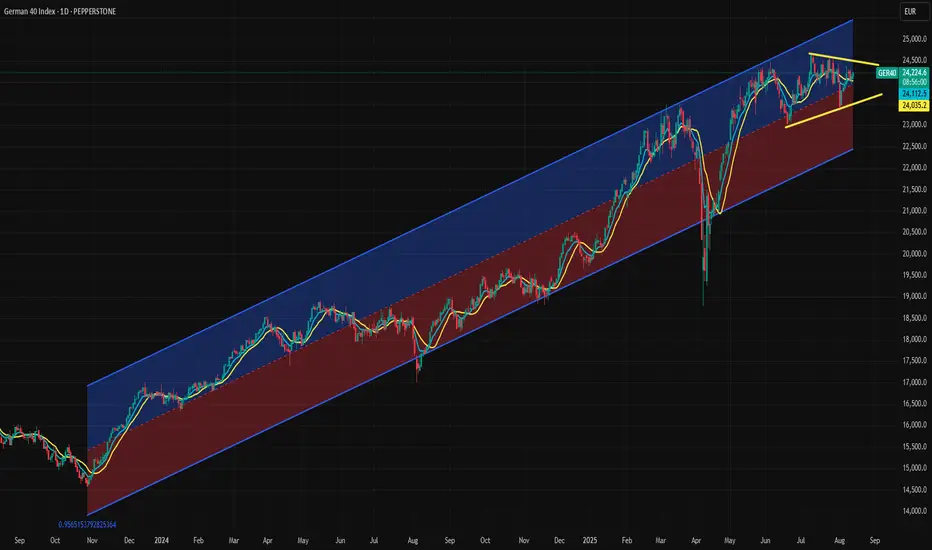
Both Technical and Valuation Signals Points Incoming VolatilityThe DAX has been moving sideways since May, with this flat movement evolving into a triangle formation since June. Price action is contracting, and the index appears to be waiting for a catalyst to determine its next direction.
The DAX is currently near the regression line from the November dip, which keeps both upward and downward possibilities open, consistent with the neutral signal from the triangle pattern.
From a valuation perspective, the DAX’s forward P/E ratio stands at 16.95x, roughly one standard deviation above its 2009-to-date regression line, making it relatively expensive compared to its own history. The S&P 500 trades at a much higher forward P/E of 24.25x, but that figure is near its own long-term regression line. Since early June, the DAX/S&P 500 ratio has fallen by nearly 10%, significantly reducing the DAX’s relative overvaluation and potentially giving it room for another leg higher.
Ultimately, the triangle formation may be the deciding factor. The current upper boundary is at 24,500, and the lower boundary is at 23,490. A break of either could bring volatility back to the DAX, with momentum likely to follow the breakout direction. An upward break could target the 24,400–24,500 zone.
DAX: Will Go Up! Long!
My dear friends,
Today we will analyse DAX together☺️
The recent price action suggests a shift in mid-term momentum. A break above the current local range around 24,048.10 will confirm the new direction upwards with the target being the next key level of 24,154.31 and a reconvened placement of a stop-loss beyond the range.
❤️Sending you lots of Love and Hugs❤️
GER40As mentioned before, dax is going to go down, then recover. So far on the 4H chart we can see it has already started its move down.

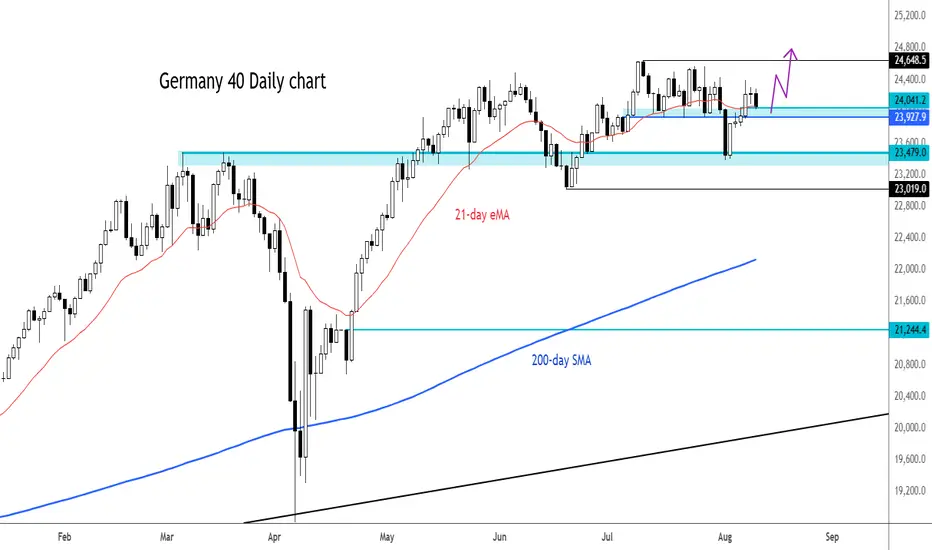
DAX testing supportCould the DAX bounce back here after starting the day lower?
At the time of writing, the German benchmark index was testing key short-term support between 23,928 to 24,041. This area was previously resistance while the 21-day exponential average also comes into play here.
if we see a bounce here then a new all-time high could be on the cards. Else, a potential break down could target the old support and resistance range around 23,500.
By Fawad Razaqzada, market analyst with FOREX.com