Sun TV: Critical Levels Setting Up the Next MoveThis is the 1-hour timeframe chart of Sun TV.
The stock is forming a Descending Broadening Wedge pattern with a support zone near ₹515–525 and resistance around ₹565–575.
The trend is currently negative, but if the price breaks above the resistance zone, the stock may move toward the
pattern target near ₹620.
Thank you.
Descending Broadening Wedge

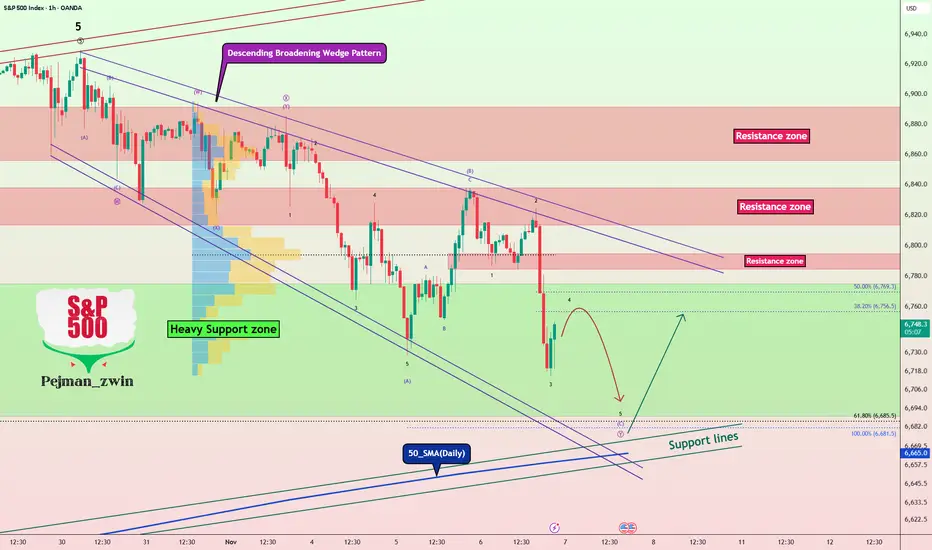
S&P 500 at Make-or-Break Level – Bulls’ Last Chance!As I expected in the previous idea , the S&P 500 index ( SP:SPX ) has reached its target.
Given that the S&P 500 index has a strong correlation with other financial markets, especially Bitcoin ( BINANCE:BTCUSDT )—sometimes even tracking them candle-by-candle—it's a good idea to pay extra attention to the S&P 500 index these days.
Currently, the S&P 500 index is moving in a Heavy Support zone($6,775_$6,689) , although it entered this zone with a lot of downside momentum.
From a classic technical analysis perspective, there's still a chance that the descending broadening wedge pattern will hold. As long as this pattern isn't invalidated, we can still hope for at least a short-term bullish move.
From an Elliott Wave perspective , it seems like the S&P 500 index is completing the microwave 4 of the microwave C of the main wave Y within the descending broadening wedge.
I expect that after the next small dip, the S&P 500 index will start rising again from near the lower boundary of the wedge, the 50_SMA(Daily) , and Support lines .
Note: If the S&P 500 index falls below about $6,650, we should expect further downside. So let's keep an eye on that level.
Please respect each other's ideas and express them politely if you agree or disagree.
S&P 500 Index Analyze (SPX500USD), 1-hour time frame.
Be sure to follow the updated ideas.
Do not forget to put a Stop loss for your positions (For every position you want to open).
Please follow your strategy and updates; this is just my Idea, and I will gladly see your ideas in this post.
Please do not forget the ✅' like '✅ button 🙏😊 & Share it with your friends; thanks, and Trade safe.
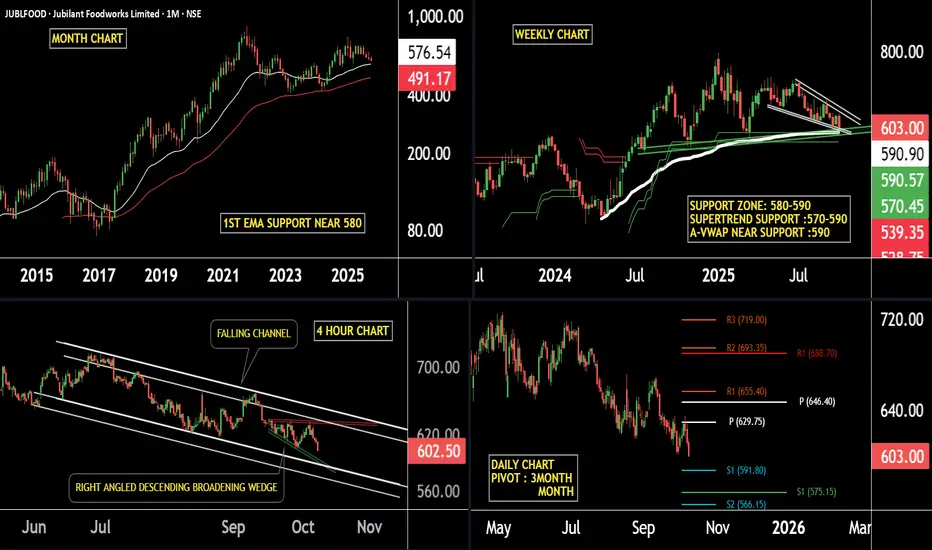
JUBLFOOD Strength at Support Indicates a Potential Rally AheadJUBLFOOD — Multi-Timeframe Technical Analysis
Monthly Timeframe:
JUBLFOOD is showing strong support on the EMA, with the first key support area positioned near the 580 level. This zone has historically acted as a major demand area, suggesting potential accumulation.
Weekly Timeframe:
The stock is currently trading near the 570–590 support zone, where the Supertrend indicator is also providing confirmation of support. Sustaining above this zone could trigger a potential reversal or upward momentum.
Daily Timeframe:
Both the quarterly and monthly pivot levels indicate strong support between 575–591, reinforcing this area as a crucial price base from a pivot-point perspective.
4-Hour Timeframe:
On the lower timeframe, JUBLFOOD is moving within a falling channel and forming a descending broadening wedge pattern near the 580 support zone. This structure suggests a possible bullish reversal if the price holds and breaks above the upper trendline.
if this level is sustain then we may see higher prices in stock.
thank you!!
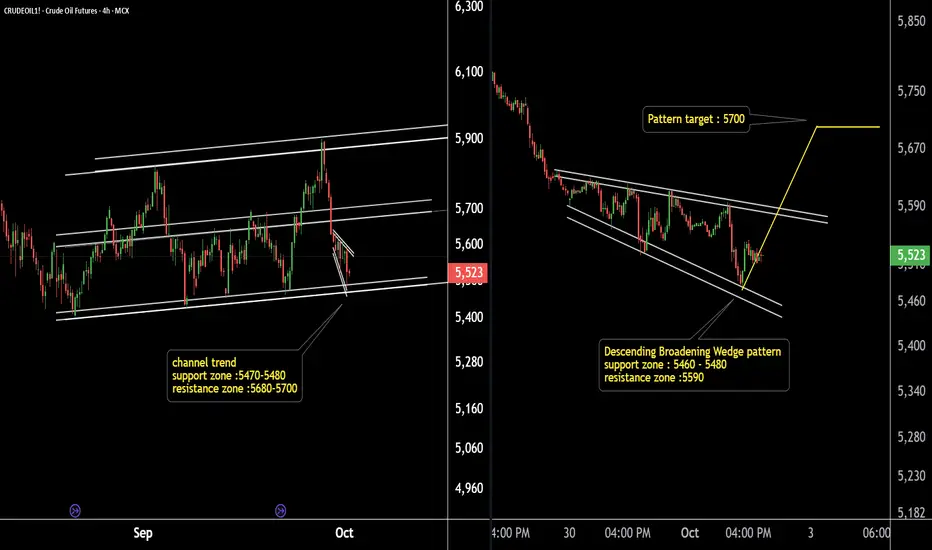
Crude Oil Ready to Explode ? Watch This Key Support Pattern!Crude Oil (4H & 15Min Chart) Analysis:
Crude Oil is moving within a well-defined parallel channel on the 4-hour timeframe, with a strong support zone at 5480–5490.
On the 15-minute chart, a descending broadening wedge is forming, with the pattern support zone also near 5480–5490 and pattern resistance around 5600.
Potential breakout target: 5700.
If the support zone holds, we may see higher prices in Crude Oil.
Summary: Key support at 5480–5490 is critical. Watch for a breakout above 5600 for a potential upside move toward 5700.
Thank you !!
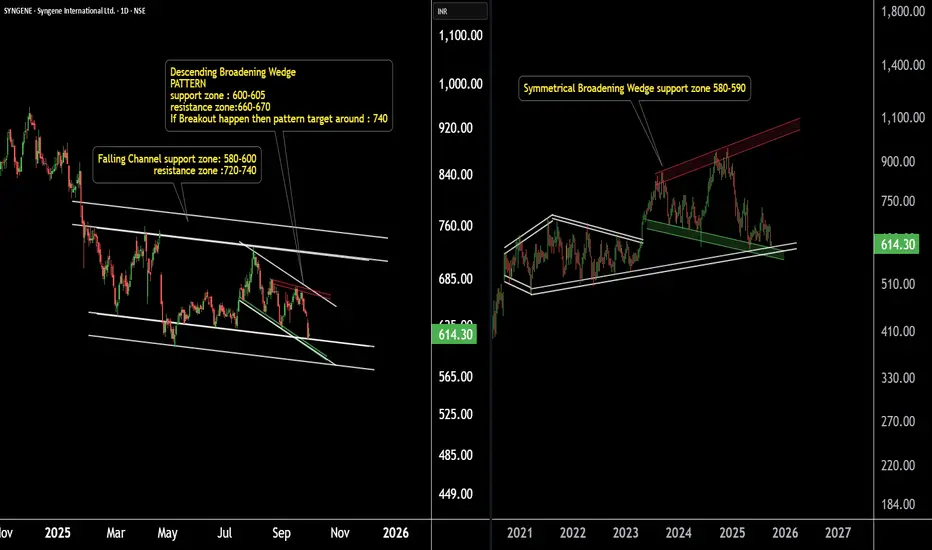
Big Move Loading in Syngene International.Pattern on Support.Syngene International – Daily & Weekly Chart Analysis
Syngene International is exhibiting a confluence of patterns across multiple timeframes, all aligning near a strong support zone.
On the weekly chart, the stock is forming a broadening wedge pattern, with a key support zone around ₹580–590.
On the daily chart, Syngene is trading within a well-defined falling channel, with support again placed near ₹580–590.
Additionally, the price structure is also shaping into a descending broadening wedge, with support around ₹590–600.
Key Insight:
The presence of multiple patterns converging near the same support zone highlights the significance of this level. Sustaining above ₹580–600 could pave the way for a strong reversal move in the coming sessions.
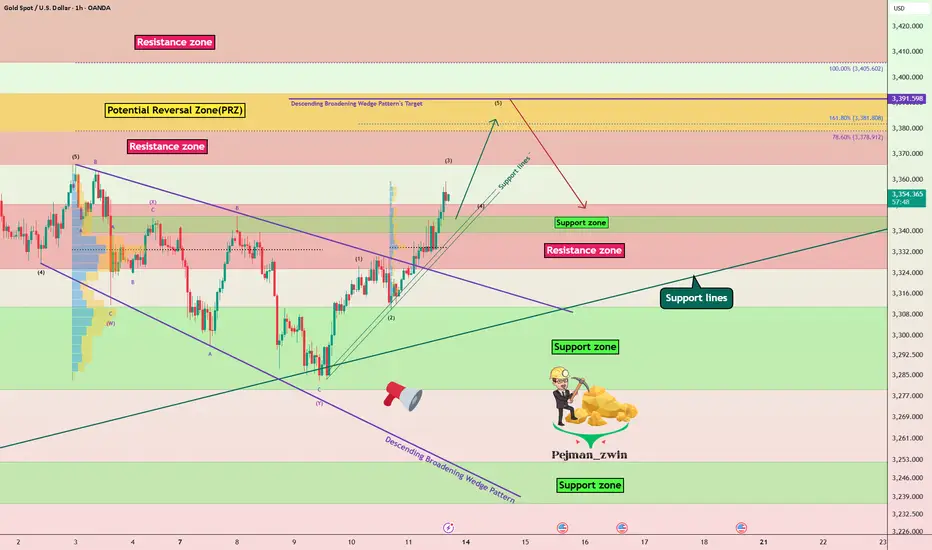
Gold Roadmap=>Short termGold ( OANDA:XAUUSD ) currently appears to have broken through the Resistance zone($3,350-$3,325) .
The Resistance zone($3,350-$3,325) was broken with the help of the Descending Broadening Wedge Pattern , the upper line of this classic pattern having served as an important resistance line for us in previous ideas .
In terms of Elliott wave theory , Gold has completed the Double Three Correction(WXY) within the Descending Broadening Wedge Pattern . It is currently completing the next five impulse waves . Wave 5 of these waves could end in the Potential Reversal Zone(PRZ) .
I expect Gold to rise to the Potential Reversal Zone(PRZ) , and of course, given the momentum of gold approaching PRZ , we can also look for Short positions in PRZ .
Note: Stop Loss (SL) = $3,329
Gold Analyze (XAUUSD), 1-hour time frame.
Be sure to follow the updated ideas.
Do not forget to put a Stop loss for your positions (For every position you want to open).
Please follow your strategy; this is just my idea, and I will gladly see your ideas in this post.
Please do not forget the ✅ ' like ' ✅ button 🙏😊 & Share it with your friends; thanks, and Trade safe.
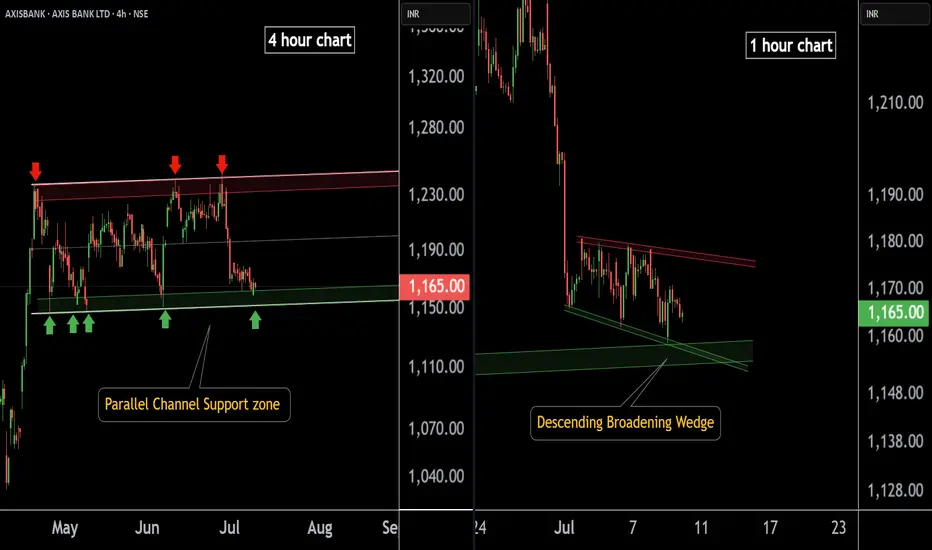
AXIS BANK at Best Support !!Here are two charts of Axis Bank — one in the 4-hour timeframe and the other in the 1-hour timeframe.
4-Hour Timeframe Chart:
In this chart, Axis Bank is moving within a parallel channel, with the support zone lying in the 1150–1160 range.
1-Hour Timeframe Chart:
Axis Bank is forming a descending broadening wedge pattern, with support near the 1150–1155 zone.
If this level is sustain ,then we may see higher prices in Axis Bank.
Thank You !!
SJVN 's Key level for Swing .This is the 4 hour chart of SJVN.
SJVN is forming a broadening pattern with support near at 90 range.
SJVN is forming a descending broadening pattern within a larger ascending broadening structure with support at near 91 range.
If this level is sustain then ,we may see higher prices in SJVN.

Descending broadening wedge after peak BTC/USD 4hCurrently BTC/USD is in a descending broadening wedge after a peak.
This means high chance of upward breakout. Price increase from breakout point is usually the difference from pattern top to pattern bottom, which would mean a price of $123000.
Not financial advice. There is a chance of this not playing out, even though the chance is small.

Failed Wedge, New Setup. Is SUI About to Break Out?In my previous post about BYBIT:SUIUSDT , I mentioned a potential falling wedge pattern. However, the breakout above the 4.0040 resistance turned out to be a false breakout, and the price eventually dropped to the invalidation level at 3.5868. This made the setup invalid.
But despite the failed wedge breakout, BYBIT:SUIUSDT remains in a bullish trend overall. During the current consolidation, the price appears to be forming a new bullish pattern — a Descending Broadening Wedge (DBW).
This pattern typically starts with low volatility and gradually widens. Once price reaches its lower boundary, it often experiences a strong breakout to the upside.
Let’s break down the key price action in this DBW setup:
Price is moving within a Descending Broadening Wedge and is currently near the lower boundary of the pattern.
It’s also sitting around a key support level at 3.4833.
A rejection candle formed right at 3.4833, showing the market’s response to this support area.
A reversal confirmation would come if the price breaks above 3.6102.
A bullish divergence is also visible — price is forming lower lows, while the stochastic indicator is forming higher lows.
Based on these five price action signals, it seems that buyers are still in control, even though short-term volatility has created a series of lower lows.
That’s why I still believe BINANCE:SUIUSDT has more room to go up. What’s your take on this?

Ethereum ... Don't miss this train!The Ethereum season has arrived, and in the coming days, we'll be focusing on Ethereum and the tokens built on its network.
The chart shows a descending broadening wedge pattern, which has been broken on the daily timeframe.
Don’t wait for a retest or any major corrections—this train won’t wait for you.
The target for this pattern is $6,600.
Best regards Ceciliones🎯

Crucial Level to Watch on BTC.DWe can see that CRYPTOCAP:BTC.D is still in a bullish trend and is currently testing a crucial level, which will determine whether it continues to make a higher high or starts weakening towards its previous low.
The influence of CRYPTOCAP:BTC.D on the crypto market is simple: if CRYPTOCAP:BTC.D moves higher, it means more money is flowing into Bitcoin. For example, if CRYPTOCAP:BTC.D is at 64%, it means 64% of the total crypto market capitalization is in Bitcoin, and the remaining 36% is spread across altcoins like CRYPTOCAP:ETH , CRYPTOCAP:SOL , CRYPTOCAP:DOGE , CRYPTOCAP:PEPE , etc.
Conversely, if CRYPTOCAP:BTC.D moves lower, it means more money is shifting into altcoins.
Strategy when CRYPTOCAP:BTC.D is rising:
You can allocate more into Bitcoin rather than altcoins. Alternatively, you can find altcoins that are outperforming Bitcoin.
How to find altcoins that outperform Bitcoin?
Look for altcoin/BTC pairs, for example: BINANCE:WIFBTC , BINANCE:NEARBTC , or $BINANCE:TAOBTC.
If the price of BINANCE:WIFBTC is going up, it means SEED_WANDERIN_JIMZIP900:WIF is gaining more value compared to $BTC. If it's going down, it means Bitcoin is performing better than $WIF.
Back to CRYPTOCAP:BTC.D :
Currently, CRYPTOCAP:BTC.D is testing the 64.19% – 64.10% zone.
This area will determine whether CRYPTOCAP:BTC.D continues upward or starts to weaken.
To get early confirmation, you can zoom into the 1-hour chart and look for signs of bullish divergence.
If bullish divergence appears on the 1-hour chart, it often leads to a bounce on the 4-hour chart and a potential continuation of the bullish trend, possibly breaking the previous high.
However, if there's no bullish divergence confirmation, or if there's a strong rejection at the support level, CRYPTOCAP:BTC.D is likely to weaken and move towards its previous low.

Will This Descending Wedge Push HYPE to 22.5?If we take a closer look at the price structure, the orange and blue arrows show that BITGET:HYPEUSDT is in an overall uptrend. Meanwhile, the white arrow represents a minor pullback—just a ripple within the bigger trend.
When we connect the orange to the white, and then the white to the blue arrow, we can spot a descending broadening wedge formation. Given the current bullish structure, this pattern is more likely acting as a continuation rather than a reversal.
After the pattern is completed, the key level to watch is the resistance around 16.62, which comes from the white arrow's high. This level will decide whether price can break through and continue its bullish momentum toward the target zone at 20.52 – 22.55, or if sellers will step in and cause a rejection.
In case of a rejection, we might see some sideways movement as the market consolidates before making the next move.

XAUUSD Weekly Analysis – Bearish Correction ExpectedGold (XAUUSD) has recently broken above a rising wedge resistance on the weekly timeframe but is now showing early signs of potential exhaustion. Price action is currently hovering around the $3,024 level after a strong bullish rally. However, historical patterns and structure suggest a possible bearish correction ahead.
📊 Key Technical Observations:
Rising Wedge Pattern: Price has been following an ascending channel with a sharp parabolic curve. The structure hints at overextension, making it vulnerable to a pullback.
Previous Corrections: Two notable corrections (-8.89% and -8.15%) provide a historical benchmark, reinforcing the possibility of a similar retracement.
Bearish Scenario :
A potential double-top formation and rejection zone is developing around the $3,050 area.
Target Zones:
TP1: $2,935.95 – first major support/resistance flip zone.
TP2: $2,782.94 – deeper retracement aligned with previous corrective structure.
🧠 Trading Bias:
Bearish bias in the short to medium term as gold may seek to correct before any continuation of the bullish trend.

Bitcoin Roadmap: Breaking the Broadening Wedge – A Buy Signal?After the tariffs that Donald Trump approved for the European Union and China , Bitcoin ( BINANCE:BTCUSDT ) received a shock with each approval. Otherwise, Bitcoin should have returned to the upward trend, at least in the short term.
Bitcoin seems to have failed to break 200_SMA(Daily) , and most of the time the invalid break is accompanied by the opposite movement of that break with high momentum. Also, Bitcoin seems to have broken the Resistance zone($83,530_$82,250) and is pulling back to this zone .
In terms of Classic Technical Analysis , it seems that Bitcoin has succeeded in completing the Descending Broadening Wedge Pattern .
According to the theory of Elliott waves , Bitcoin seems to have completed five downward waves and we should expect Bitcoin to rise .
Also, we can see the Regular Divergence(RD+) between Consecutive Valleys .
I expect Bitcoin to rise AFTER breaking the upper line of the Descending Broadening Wedge Pattern up to the targets I specified on the chart.
Do you think Bitcoin correction is over?
Note: If Bitcoin goes below the 200_SMA(Daily), expect more dumps.
Please respect each other's ideas and express them politely if you agree or disagree.
Bitcoin Analyze (BTCUSDT), 1-hour time frame.
Be sure to follow the updated ideas.
Do not forget to put a Stop loss for your positions (For every position you want to open).
Please follow your strategy and updates; this is just my Idea, and I will gladly see your ideas in this post.
Please do not forget the ✅' like '✅ button 🙏😊 & Share it with your friends; thanks, and Trade safe.

BTC/USDT ! HOUR DESCENDING BROADENING WEDGE LONG TARGET 105KIn this idea I have a clean descending broadening wedge that is about to take off to 105k. Target is clearly marked and should hit that no problem. If you agree throw me a like and follow me for more setups that keep you in the money. Much love - ND

BTCUSD | 95K Target 1:1 Move | BullishThis will be the first big trade at the start of the exponential cycle we're about to witness for the 5th time in BTC history.
Considering the descending broadening wedge pattern, a 1:1 move into the pattern gives a price target of roughly $95k.
It can also been seen as a flag pattern which also reads a $95k impulse target as seen below:
If you want to look at more longer-term targets and analysis of CRYPTOCAP:BTC , I've attached 3 of the charts I've made which will satisfy that long term bullish outlook.
Best of luck to you all out there involved in this space and remember, manage your risk appropriately.

Bitcoin Roadmap!!!(New ATH)Bitcoin( BINANCE:BTCUSDT ) started pumping after it was almost certain that Donald Trump was the future president of the United States because Donald Trump announced his support for cryptocurrency during the last year .
In terms of Classic Technical Analysis , Bitcoin started pumping with the help of the Descending Broadening Wedge Pattern . ( Educational ).
Bitcoin has already managed to break the Heavy Resistance zone($73,900-$70,900) , but it has entered an important Potential Reversal Zone(PRZ) ; we have to see how long it can continue.
According to the Elliott wave theory , Bitcoin succeeded in completing the Double Three Correction(WXY) and is currently completing wave 4 .
I expect Bitcoin to start rising again from one of the Targets I have identified on the chart and at least rise to the upper line of the ascending channel . It probably needs Bitcoin correction to create another New All-Time High(ATH) .
⚠️If Bitcoin goes below the Heavy Resistance zone($73,900-$70,900), we should expect more dumps.⚠️
Bitcoin Analyze (BTCUSDT), 1-hour time frame⏰.
🔔Be sure to follow the updated ideas.🔔
Do not forget to put Stop loss for your positions (For every position you want to open).
Please follow your strategy and updates; this is just my Idea, and I will gladly see your ideas in this post.
Please do not forget the ✅' like '✅ button 🙏😊 & Share it with your friends; thanks, and Trade safe.

DYM Descending Broadening Wedge Breakout Confirmed!We've just seen a strong breakout of DYM from its descending broadening wedge structure. This is a key bullish reversal signal! 📈
The price action indicates momentum building up, with the next target zone being around $7-$8, representing the top of the broadening wedge structure.
🔸 Key Levels: As the price surges, we’re watching the $7-$8 range for potential resistance.
🔸 Support Re-test?: A possible re-test of the breakout level could present a strong entry point if the momentum holds.
🔸 Volume Confirmation: The breakout is supported by a surge in volume, reinforcing the potential for a strong move upward.
Keep an eye on the market dynamics, and remember to manage your risk, especially as we approach key resistance levels.
#DYM #Breakout #BroadeningWedge #SwingTrade #CryptoTrading #TechnicalAnalysis
🚨 Disclaimer: This is not financial advice. Always conduct your own analysis or consult with a professional.

BTC: Descending broadening wedge=Bear TrapEveryone is running around with their heads on fire over a textbook bullish descending broadening wedge pattern.
Which I’d say is pretty damn bullish.
If we’re lucky, the negative sentiment will trigger a short squeeze, to shake out the leveraged degenerates out of the market, before the bull run.
Don’t be a bitch, buy the dip.

BTC Broadening Descending Wedge 4HBTC moving inside a broadening descending wedge on the 4H chart.
This shape has a bullish outcome more often than not.
Price action has touched major support twice.
BTC Price is back above the 50 SMA which is a good sign.
Keep an eye on this structure.
NFA
Do your own DD

PEOPLE/USDT: POTENTIAL DESCENDING BROADENING WEDGE!!Hey everyone!
If you enjoy this analysis, a thumbs up and follow would be greatly appreciated!
PEOPLE look good here. Breaks out from the descending broadening wedge-like structure and currently retesting it. Long some here and add more in the dip.
Entry range:- $0.075-$0.08
Targets:- $0.0865/$0.098/$0.11/$0.126
SL:- $0.07
Lev:- Use low leverage (2x-4x)

$AMC Descending Broadening Wedge FormationOverview:
NYSE:AMC is currently exhibiting a classic descending broadening wedge formation, a bullish reversal pattern that suggests potential upward movement. This setup is characterized by two diverging trendlines, with the price making lower lows and lower highs within the pattern.
Long-Term Target:
Based on the wedge formation, our long-term target is a move back to the top of the descending broadening wedge, around the ~$300 level. This target aligns with historical price action and significant resistance areas.
Short-Term Targets:
Before reaching the long-term target, NYSE:AMC is expected to hit several key resistance levels. Our short-term targets are in the $10-$15 range, where the price is likely to encounter the major resistance trendline.
Trade Strategy:
Entry Point: Look for entry opportunities near the lower boundary of the wedge, ideally around current support levels.
Short-Term Profit Taking: Consider taking partial profits as NYSE:AMC approaches the $10-$15 resistance zone.
Stop Loss: Set a stop loss below the recent swing low to manage risk.
Technical Indicators:
RSI: Monitoring for oversold conditions that could indicate a potential reversal.
Volume: Increased volume near support levels can confirm buying interest and potential breakout.
Conclusion:
The descending broadening wedge on NYSE:AMC suggests a potential bullish reversal, with significant upside targets in both the short and long term. Traders should watch for breakouts above resistance levels and manage risk accordingly.
