Descending Broadening Wedge

ICX in a descending wedge - looks like a possible break upwards You can see the descending wedge in the chart which it has been respecting and within the next 24 hours or so it will make a decision on where it wants to go outside of the wedge. Generally these wedges see a break up. Volume is decreasing as it's consolidating as you can see from the light red arrow on the volume bars.
Initially from the jump it was forming a bull flag which looks to have changed into a wedge. The jump might not be as high as my target there - it may only reach halfway up since bitcoin is nearing resistance. I'm going to set a stop loss at entry if/when the breakout happens
Like the analysis if you found this useful.

GJ make money following the trendHi my fellows pros
These are the 2 levels to watch
Plans are draw
Follow the plan and make money
Have a nice week

BCH/USD LongBCH is forming a descending broadening wedge
We have to wait for a close above resistance trend line to place a buy order
Though i expect a rejection here followed by the formation of a partial decline which would be even more interesting to buy since partial declines predict the breakout direction (upward) and works 79% of the time
TP as shown in the graph

BTC/USD LONGI see descending broadening wedge on BTC and it might be forming the partial decline which would trigger a long position
We have to wait for reversal candle in the buy zone
TP as mentioned in the graph

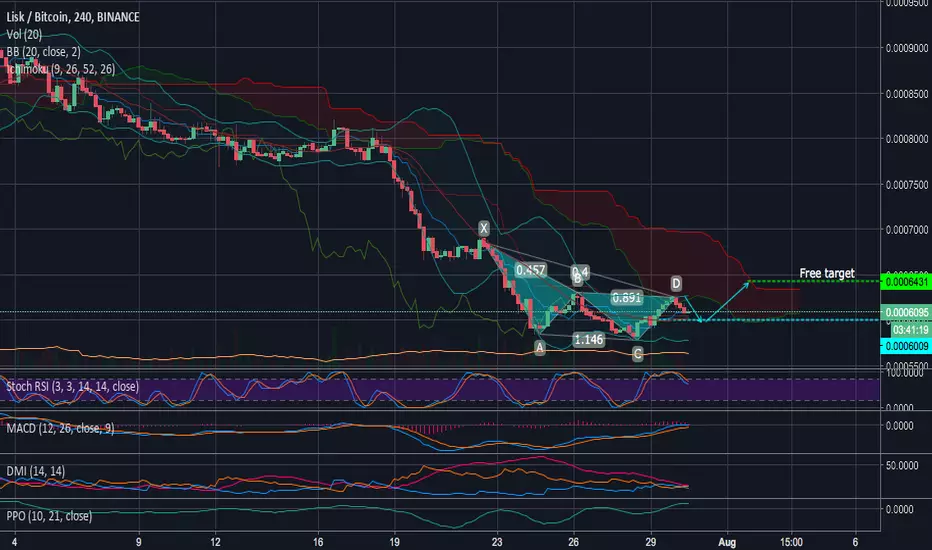
LSKBTC a bit more consolidation before new growth waveAfter an impulse breakthrough in the beginning of the year, Lisk started a downtrend forming a corrective pullback. At the moment the price has fallen to the safe buy zone where the last time a growth wave was started.
The price should decrease a bit due to bearish XABCD formation at the chart. however up from the level drawn at the chart there should be a rebound.
The market forms a descending wedge, breaking through the upper edge of it will give an opportunity for further growth.
If the resistance of 0.00062 will be too strong then the price will go lower till the next support level where it should consolidate and bounce back. in case of this scenario you should buy more in parts around 0.00058.
The final stop loss is located around 0.00055 in case of such negative scenario stay tuned to our updates where we will present the best moment to reenter till the breakeven point.
Overall, the coin looks stable according to DMI and full of strength to start a growth wave
Bitcoin is being very difficult but here's another ideaIt looks like there is a descending wedge (light blue) that occurred with a 4 hour bullish divergence that occurred at around 7300. The bulls did a really good job defending 7300, and the bears were showing a lot of weakness, however, it was on the fence if the bulls could recover from that drop, but they did and right now the bulls control the field. The movements down got rejected by the yellow support line which should be an extremely strong support, extremely strong, because that has been the resistance like for the past 8 months, and the orange line which used to be the support of the symmetrical triangle is now the resistance, and this descending wedge has a price objective that shoots right under, right under 7850. Depending on whether the bulls can dominate the area, depends on whether this recent breakout was a false one or not, because if the bulls get rejected at 7800 or something lower than that, then it is most likely going to be the head and shoulder topping pattern I have been talking about in the last idea. The bulls are trying on this one with a solid possible reversal, and a possible reversal on the daily with a nice bullish hammer candle stick.
Key Points:
1.) Daily candle stick shows several bullish reversal candle stick patterns, the first one is a 5 count fractal reversal, the second one is a really superb, strong bullish hammer. It bounced off of the yellow trendline, with a bullish divergence on the 4 hour candle sticks and the bulls have been doing a good steady job at keeping this price up.
2.) There is a bullish continuation pattern, the descending wedge, and it looks legitimate and it is confirmed on the daily with volume; it is also confirmed on the smaller time frames, however on the smaller time frames the descending wedge is much larger. The main problem is that patterns have been failing because we are moving sideways at the moment and we are technically trendless right now, also the market is in a strange place right now as this is a huge decrease in total market cap with some coins virtually at zero and others on the brink of it.
3.) If the descending wedge succeeds then then it is up to the bulls break 7850 with significant strength and penetration for me to say we are in bullish territory, a failure to break through the 7850 levels would mean it would be the right shoulder of the inverse head and shoulder with the neckline (readjusted from before) in purple.

BTC USD Double combo correction with ending diagonal?Maybe this correction is almost over and BTC 0.21% is printing a double combo ending in a diagonal. If so I'd expect one more run down here to stop at the lower trendline and then probably flat for a while before starting the next bull market.
I'm waiting to see if we break out here and complete what could be a bull flag . If so I might buy the breakout. If we don't break out, I'll wait to buy at slightly above the lower trendline of the descending wedge .

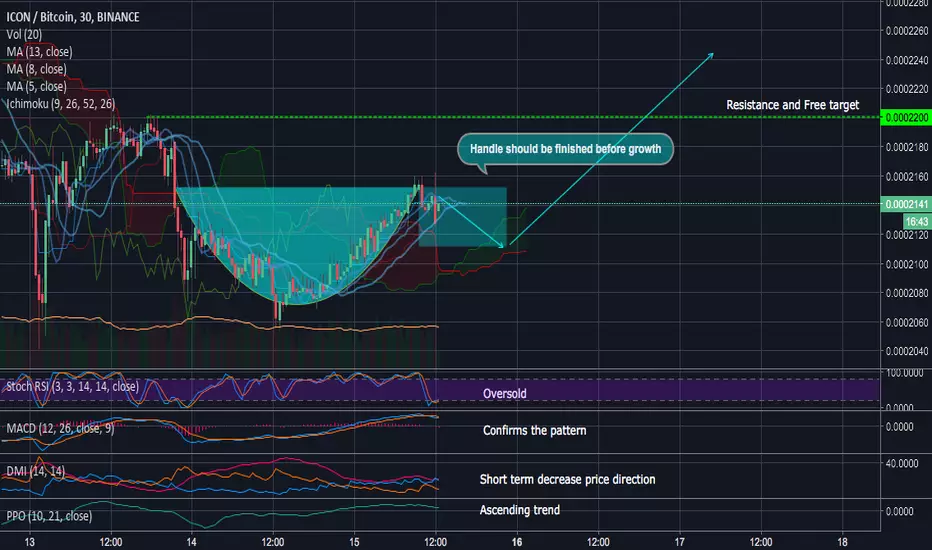
ICXBTC Cup&Handle and Descending wedge breakoutICX has been oversold for a long time, the indicators show a high rebound probability.
On a 30-minutes timeframe there is a bullish reverse indicators and cup&handle formation which is going to be finished soon.
On a 1-day scale, you can see the formation of a descending wedge, a pattern indicating the end of a downtrend and the possibility of breaking through resistance via a strong bounce which opens a way for further growth.
From current levels, we can jump to the resistance, which is marked on the chart. This will finish the pattern and will indicate a bullish breakout from the long term descending channel.
When this happens a regular correction will occur and we will start a swing trade strategy. Once the price consolidates around Fib 0.618 - Fib 0.5, it will be possible to open long position according to the rest targets which are in the Premium channel.
We remind you that under the current state of the global crypto market, each position carries a high level of risks. Although this trade recommendation has low risk according to our classification scheme, do not follow emotions and "animal spirit", open only the position you are able to manage and track, use a stop loss. If the market goes below support, then the correct decision will be selling on the rebound and then buy again at lower levels, this will provide an opportunity to sell at previous entry order with profit. Be careful and keep tracking BTC and your opened alt positions.
TRON IN BULLISH TERRITORY AGAIN - 30% PROFIT - CryptoManiac101Enjoy this trade advice my Crypto Maniacs, but remember to invest only what you can afford to lose or you're going right back to poverty on drop. We are not your financial advisors.

WTC/BTC Huge Descending WedgeHuge descending wedge on the WTC/BTC 1D. Looks like convergence will be around early August. Just in time for the $BTC ETF? Setting some buy orders around 92k sats and having a tight mental stop if it is a counter-to-anticipated breakout. However, the chart is somewhat bearish. The Tenkan sen is pretty far from the Kijun sen which suggests we are decently oversold. We are trading well below the Kumo and although the MACD flipped, it is still below the signal line. If you are an investor now is a good time, with all the great June news that was released (www.reddit.com), but I would wait for BTC to break down to set a lower low to begin to accumulate.

BCH/USD LongBCH is in a broadening descending wedge, price touched the bottom trendline 3 times and is now forming a partial decline so we can expect an upward breakout
SL and TP as mentioned in the graph

BNB_Descending Broadening WedgeHello everyone, looking at the 1 day chart we can see a risky trade setup that involves some decent returns.
The overall trend has been bearish, but, there is a large potential for a broadening ascending wedge (Bullish formation.) The catalyst? The upcoming BNB coin burn. The entry point will be anywhere in this blue box support zone, especially inside the descending green trend lines.
The set up:
Buy 1 = $12.10
Buy 2 = $11.80
SL $11.50
Profits 1 - $13.20
Profits 2 - $14
Profits 3 - ???
Risk/Reward Ratio
With $12.10 buy : 1:83 and 1:3.1
With $11.80 buy : 1:4.67 and 1:7.33
I know it sounds crazy, but we have some indicators and support levels to support this:
1) The blatant large blue support zone. This has acted as strong support in the past previous runs all the way upto $18.
2) The 1 day Stoch RSI has reached a triple oversold position before reaching above the overbought, and currently sits in the oversold position.
3) The 1 day momentum shows a slight slowdown in sell pressure.
4) MACD sell pressure appears to be lesser than when the price was at $14.50.
5) RSI is very low, around 30ish?
Counter arguments to buying:
1) Volume has been declining.
2) MA 100 and 7 bearish cross.
3) MA 25 getting closer to closing below the MA 100.
4) The overall trend has been bearish.
5) BTC uncertainty and crazy volatility.
I've bought in the first buy zone and have a second one set up. I'm doing so because the R/R is VERY good here. I'm not saying that we will make a bull run and reach all time highs, but there is a very good chance of at least a temporary reversal here. With that said...
*Disclaimer, this is not financial advice. Any positions you choose to buy is 100% your responsibility. What I mean is that you take on all the financial risk as well as all the financial rewards.
-May BTC reach mars before Elon Musk

GBPUSD - Daily Update for June 28th, 2018.The GBPUSD 2-hour chart is corresponding to the Daily Update for June 28th, 2018.

ETHUSD 1H DESCENDING WEDGEWedge pattern breakout long
Enter with a 15 m break-hook-go
Take Profit previous high

XAUUSD - Descending broadening wedge bullish breakoutA few days back I posted analysis on a bullish reversal flag pattern that had formed in gold. At the time I said to be watching to see if price would stay broken out or if bears while push is back down inside the pattern. Price did fall back inside the pattern, fall down to make new lower lows and then staged a very impressive V shaped price reversal. This recent price action caused a descending broadening triangle to form, which is a bullish pattern. Price has already broken out of this pattern so just as before will be watching if this hold and price moves higher in the coming days. While recent price action has been bearish also keep in mind that gold is sitting on top of some major support levels which means we could see gold pop back up higher yet again. The goal will be to see if this is simply a retracement before the next leg lower or if there will be a more significant price reversal.
I have got neutral/long on goal through short puts on SPY. This type of strategy is profitable if price moves higher, side-ways or even slightly lower. This type of trade would only be a losing trade if price moved lower in a major way which I see as the least likely scenario right now.

GVTBTC Descending WedgeGVT might be printing a descending wedge. Could break out some time in the next few weeks.

BTCUSD - broaden descending wedge and head and shoulder patternIf we were to complete the measured move within the broaden descending wedge, BTC will be bottomed around 14th, which is the same day as NY Consensus. Broaden descending wedge is a bullish pattern that targets right below 10K with over 70% chance.

PPT/BTCLooks like a Descending Broadening Wedge has formed during the down trend in PPT. Here's hoping for a reversal

Bitcoin at 12K by JuneHey Friends,
This is an update analysis on Bitcoin. I want to preface that this is a mid ranged idea just to give you some perspective, I'm thinking this idea should take about a month and a half. I'm sorry the chart is a little messy, there's a lot going on, but I want to point out these various significant levels.
I'm seeing a cup and handle on Bitcoin's 4h chart. Looking back at the history I've hilighted a couple areas of support/resistance in yellow. You can see how many times those zones were tested, which makes them more significant.
You can also see the EMA's have flipped from bearish to bullish and are now providing support.
Looking at the Fibinacci's I'm expecting a nice stairstep climb higher. I think it's too early for too much FOMO but then again I could be wrong and we could skip the retest of the .618 and head straight up to the 1, but I'm hoping for the stair step climb so that we continue to record higher highs and lower lows and build investor and market confidence.
I've still have the Decending wedge pattern in my scope I think that level becomes more significant as we move forward.
Like it if you like it, and comment if you have questions, I'm happy to answer.
**This is educational information only, please do your own research before trading**


FLC Bullish Descending Wedge, MMAR Reversal = BO?The stock has been on a long and large bearish journey down a descending broadening wedge, however, it has begun showing the telltale signs of reversal as seen through the MMAR upward swings. Currently, it's undergoing a steep broadening descending wedge, which I suspect will bounce off the 50% fib at 46c. Just needs the volume.

Two potential inverse head and shoulders scenariosThere are two potential inverse H&S scenarios playing out for ethereum. I have overlaid both on the chart, one in blue and the other in green. We are currently in a potential bearish flag (purple parallel line) and it all depends on how this breaks.
Scenario #1 (green): the flag is currently forming at the 0.786 fib retracement since last bottom and top and may be a short term reversal, however this is not supported by the volume (trending down and full of bear activity). If this somehow breaks up then we could be forming a IHS that will probably be rejected at the neckline at first but then may cross on a second attempt. I recommend a buy at this break (on the pullback to retest the neckline) with a reasonable stop below the neckline. This might leave us in the area of $450-470 where I recommend a heard sell and then wait to see what happens. If we break that major outermost trendline then we might be headed to even higher highs but from my previous analysis I still see a leg further down so don't count on it. I'll have more analysis before then.
Scenario #2 (blue): the flag breaks downwards and touched the bottom trendline. Support here will confirm a typically bullish descending right angle broadening wedge where Bulkowski recommends a buy at this third touch with a pretty tight stop below the trendline. We would then likely work our way up to test the neckline, fighting through some resistances along the way, and eventually be rejected at first, drop down, create a right shoulder, retest the neckline, maybe get rejected slightly but then break and head towards the major resistance trendline where once again recommend a hard sell between $440-460. Don't follow the timeline of the drawings exactly, there should be a lot of up and down before the neckline is reached.
We had a very similar set up following the March $7200 bottom for bitcoin where the first push (similar to the last few days) came short of the trendline, consolidated, and the second push touched but then got rejected bringing us to new lows. I expect something similar.
This is up to 5 days out and a lot can happen between now and then and ultimately it relies on bitcoin and what its price action is doing. Both bitcoin and ethereum have room down and we should not yet be at our true bottom.
If we break this bottom trendline somewhere near the stop then don't bother jumping in until we see something more concrete. The market is still bearish so these are short term swing plays.
Peace and love,
crypt0guy
