JSMR: POTENTIAL RECOVERY OF CONSTRUCTION SECTOR?Hi Traders,
JSMR is breaking the descending broadening wedge pattern and potentially reach the resistance/target area.
The roadmap will be invalid after exceeding the support or target area.
"DON"T FORGET TO FOLLOW AND LIKES FOR MORE TECHNICAL OUTLOOK"
Descending Broadening Wedge

BTC descending wedge?BTC forming descending edge? It looked to me like descending channel but now looking like a wedge. Anyway, both figures are bullish, so the question is will we see a break to the upside?

USDCAD: BREAKING DESCENDING BROADENING WEDGE, NEW BULLISH TREND!HELLO TRADERS!
Currently, USDCAD is breaking the DBW Pattern. The momentum indicator is pointing up in the neutral area, indicating that USDCAD has a chance to move upward to the target area.
The roadmap will be invalid after exceeding the support/target area.

Rising Wedge on 4 hour with Bearish DivergenceToo my surprise XRP actually broke out of it's descending broadening wedge and reached full measure moves; i certainly flipped bearish on this one too soon the first time. But now that we have reached full targets i would expect that any bearish signal we get up here will carry more weight so i will be getting bearish up here again to see if i can catch another big move.
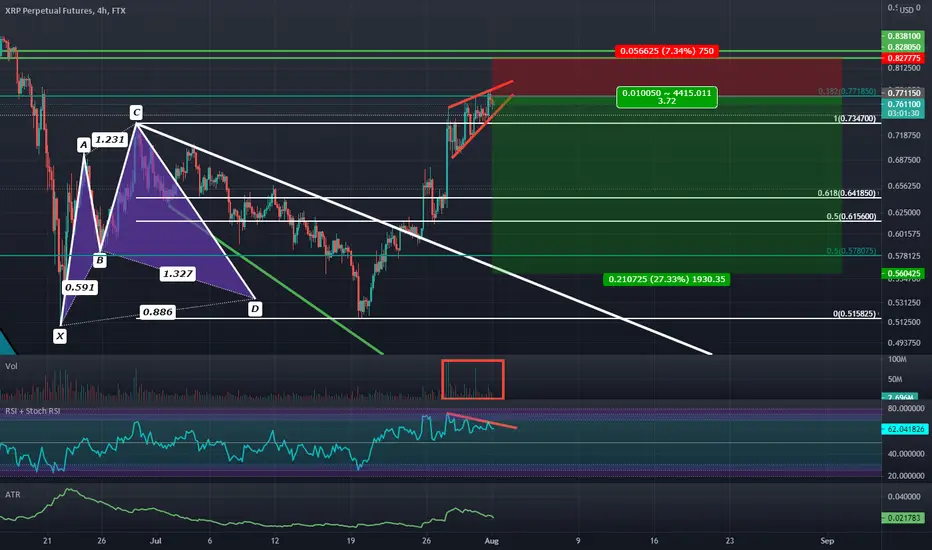
Hidden Bearish Divergence at a 50% RetraceI think XRP has had enough upside from here and will reverse between the 50% and 61.8% retraces.
A few days ago i was Bullish on XRP at the bottom of a descending broadening channel but we have since reached the top of this channel and are now showing signs of 4 hour hidden bearish divergence on the RSI.
If this continues and we see a reversal from here then i'll expect XRP to go as low as 37 cents near the 886 retracement on the daily timeframe.

DOTS... Just Follow The DOT.Totally misread the move but the recovery on any losses is going DOWN now. Make up some loose ends here. The dip should ease up around 15-14.5.

Polkadots Pretty PolkadotLook for a breakout around 16. We should meet resistance around 17-17.30... Looking to meet support around 17.


[UPDATE BONDLY] Slow recovery but huge opportunity for BondlyThe downtrend has finally ended. We reached the bottom of the bottoms.
Now, the descending wedge is about to be broken and I predict a slow cup and handle pattern with a breakout in October (if BTC behaves as I predicted).


ASII Bullish PatternI know ASII is on downtrend …. But I found a bullish movement, thats it a decending broadening wedge and abcd harmonic pattern …. So because ASII is on downtrend the target price is better on 5300-5350… Hopefully this pattern would be work #disclaimeon

XRPUSDT Ripple - Descending Triangle-We have 3 touches at the bottom and 2 touches at the top of the triangle.
-Descending patterns are usually bearish signs, but there is a chance to interpret this patttern as a descending wedge, which is bullish.
- Volume is decreasing, which leads to explosive moves in the future.
- For expected duration of the trade, probability, stop loss, profit target, entry price and risk to reward ratio (RRR) - please check my signature below ↓
- If you want to see more of these ideas, hit "Like" & "Follow"!
-Keep this triangle in mind if you are in a long position.
-Also check my idea about XRP - Road to 100 USD below.

ETH/ USD... 4-Hour Forming a Descending Broadening Wedge...28%+Hello Traders,
May have found a bullish sign on the 4-hour chart.
Looks to be forming a descending broadening wedge. This should finish forming as the weekend comes and passes, Monday looking for a breakout to the upside, depending on a number of fundamental factors.
But based on the chart, if we can break above the trendline going into Sunday late evening and holding above it through Monday Morning/ Afternoon, we should see a continued move to the upside.
Shooting for a 28% gain.
Good luck, and happy Memorial Day Weekend.
FYI, Holidays are always unpredictable. Trade safe and take care.

RCL looking like another leg up coming Volume shelf, reopening play, cruises restarting, thesis and chart lining up here.

TOMOUSDT, signal for reversal !!!Plan: resistance level breakout --> wait for the price to bounce off from support level --> wait for the rejection candle pattern to form e.g. bullish engulfing, pinbar, etc --> BUY
**Disclaimer** the content on this analysis is subject to change at any time without notice and is provided for the sole purpose of assisting traders to make independent investment decisions.
Traders!! if you like my ideas and do take the same trade as I do, please write it in a comment so we can manage the trade together.
_____________________________________________________________________________________________________________________
Thank you for your support ;)
GWBFX

Descending Broadening Wedge on BTCDescending Broadening Wedge potentially on BTC. Possible upside or breakdown at 28-32K.

Descending Broadening Wedge Potential Descending Broadening Wedge with possible breakdown of breakup between 28-32K. I am curious to hear feedback.

DESCENDING WEDGENice descending wedge forming on 1D chart of BA. The confirmation might be over the low smas (9,20) and obviously a break out over the wedge resistance line. I am bullish for the next week and see big potential for this sector. Nice support on the 100sma. Just an amazing play it would be 😋😍

DOGE DESCENDING WEDGE UPDATEMy Previous 0.36 alert went off, so this is an updated analysis.
N.B I am still very new at this and I think this might be bullshit, but let's see how it plays.

L&T FINANCE DESCENDING BROADNING WEDGE.L_TFH (L%T FINANCE HOLDING) FORMED DESCENDING BROADNIG WEDGE ON WEEKLY TIME FRAME.
CAN GIVE SOME AMAZING RETURNS.
YOU MAY WAIT FOR SOME CONFIRMATION.

LUNA -USDT 🌓🌔 nearing the end of it's descending wedgeHello traders and investors!
Here we see LUNA-USDT coming to the end of its wedge, here we will either see it break above our lines depicted above, and create support as it moves onto our fib based extension targets, or it will break down from our support rectangle depicted above.
This is a short post, let's wait and see what happens to LUNA for it's next impulsive move!!!
Would love to know what YOU think about this decentralized currency mined to support TERRA blockchain😃🌚
🛑🛑THIS IS NOT FINANCIAL ADVICE🛑🛑
Always watch BTC as it has ~50% dominance at any given time recently, any sudden drop in BTC could greatly affect this token, always have a stop loss set for your safety
Trade on !!
Jazerbay 💗

Measured move on $LUNABTCThis is a daily chart.
Bullish descending wedge with a breakout attempt on the 26K satoshi level.
Ichimoku indicators need to change to bullish for me to consider entering this trade, besides a bullish candle close outside of the top of the wedge.
No bearish divergences present. Probable Wave 1 on Elliot Wave theory.
Currently retesting on top of the wedge.

AI - The Time Has Come to Go Long - 1.618 Fibonacci Retracement
Opinion only.
Looking for a strong reversal very very soon here.
