ADAUSDT → Correction (hunt for liquidity) before the fall BINANCE:ADAUSDT is pausing in the 0.41 area and entering a correction phase, during which it may test the zone of interest in a bearish market.
Bitcoin failed to overcome resistance at 92K, with economic data intensifying bearish pressure, resulting in another decline. The market is stagnant within the trading range, and any correction could quickly turn into a sharp decline...
ADA is forming a halt in the 0.41 zone and is entering a phase of local correction. The zone of interest is 0.426 - 0.434 (the area of local trend support breakdown). A retest of resistance may end in a false breakout...
Resistance levels: 0.421, 0.426, 0.434
Support levels: 0.409, 0.392
A false breakout of the resistance zone or a retest of the previously broken support of the uptrend may end in pressure from the bears. The correction may be followed by a continuation of the downtrend and the zone of 0.421 - 0.434
Best regards, R. Linda!
Descending Channel

DOGEUSDT → Lack of bullish potential BINANCE:DOGEUSDT.P failed to break the trend. Under pressure from resistance and a global downtrend, the coin is reversing and may decline...
Bitcoin is pausing after a news rally based on rumors. The trend remains bearish. Pressure on the crypto market is present...
DOGE faced pressure in the 0.1477 - 0.155 zone. A rebound from 0.1533 is forming and the price is closing below 0.1477, forming a pre-breakout base of 0.1464. The reaction to support is weakening, confirming the weakness of the buyer. A close below 0.1464 could trigger a further decline within the range.
Resistance levels: 0.1477, 0.15337
Support levels: 0.1464, 0.1366
A breakdown of support, closing below the level, and consolidation in the short zone will once again confirm buyer weakness, which in turn may trigger a further decline.
Best regards, R. Linda!

Good for intraday shorts, bad for swingsThe new trendline/channel formed indicates a squeeze incoming over the next couple of days, if it breaks this trendline to the upper side, we have to look for good longs. Let’s goooo!, see the levels and put your TPs and SLs according to your risk management, best of luck!

XMR - Institutional Analysis: Channel Support Buy Zone | Dec 7XMRUSD - The Privacy Resistance: How Regulatory War Created The Perfect Parallel Channel Setup
by officialjackofalltrades
🟡 CAUTIOUSLY BULLISH December 7, 2025
Institutional Technical Analysis | Whale Signals Integrated
📈 Executive Summary - The Setup
Current Price: $372.78 | December 7, 2025
Monero is trading at a critical inflection point inside a well-defined parallel channel that has dictated price action for the past 90 days. After a spectacular +23% rally to $420 in the first week of December, XMR has pulled back to test lower channel support at $370-380 exactly where technical analysis suggests the next major move will be decided.
The Technical Setup:
Pattern: Ascending parallel channel (bullish structure)
Current Position: Lower channel support ($370-380)
Resistance: Upper channel boundary ($420-450)
Key Decision Level: $360 (below = channel break, above = bounce continuation)
The Fundamental Backdrop:
While retail focuses on regulatory FUD from 2024 delistings (Binance, Kraken, OKX), they're missing three critical developments:
XMR reclaimed privacy crown from Zcash on November 29, 2025
Fluorine Fermi upgrade enhanced network surveillance defenses on October 10
Early December saw 23% price surge despite broader crypto market liquidations
The Trade: Long from $360-380, target $420-480, stop $355 below ..
Monero's price on December 7, 2025, is fluctuating approximately between $390 and $400, with some reports indicating a notable 23% increase in the first week, pushing its average trading price to $406 and briefly reaching a short-run high of $420 .
What This Means:
The $420 short-run high demonstrates XMR's technical strength even as it tests the upper boundary of the channel. The current pullback to $372 is textbook technical behavior—price respecting the parallel structure.
Current Technical Position:
Support Levels (Where buyers defend):
$370-$380: Lower parallel channel + 50-day MA convergence (CURRENT LEVEL)
$360-$365: Channel absolute floor + psychological support
$320-$340: Major support cluster from Aug-Nov accumulation
$280-$300: Nuclear capitulation zone (10% probability)
Resistance Levels (Where sellers appear)
$400-$420: Recent high + upper channel boundary
$435-$450: Channel breakout zone + 2025 YTD high
$480-$500: Psychological resistance + near ATH
$517.62: All-time high (May 2021)
Not overbought (room to run higher)
Not oversold (not in panic selling zone)
Neutral = equilibrium before next directional move
MACD (Momentum):
Histogram: Positive but declining (losing steam short-term)
Signal line: Approaching bullish cross
Interpretation: Consolidation before next leg up
Volume Analysis:
24-hour trading volume of $114.56M - this is concerning. Volume has been declining since the December 3 peak, indicating:
Thin liquidity from exchange delistings
Lower participation = higher volatility potential
Breakouts need VOLUME confirmation
🔎 Fundamental Analysis - The Regulatory War Creates Opportunity
While technical analysis shows the "what" and "when," fundamentals explain the "why." Here's what's REALLY happening with Monero:
CATALYST #1: The Exchange Delisting Paradox
The Bearish Narrative (What retail sees):
Binance delisted XMR February 2024
OKX delisted XMR January 2024
Kraken delisted XMR in EEA October 2024
"Privacy coins are dying!"
The Reality (What institutions know):
Monero founder Riccardo Spagni said: "Kraken delisting Monero in Europe just goes to prove what we already know: Chainalysis et al. simply can't squeeze enough information out of Monero's privacy to be meaningful, otherwise regulators would want Monero to stay listed as a honeypot".
Read that again. The delistings PROVE Monero's privacy works.
If regulators could track Monero, they'd WANT it listed to monitor users. The fact they're forcing delistings means they can't break the privacy.
Market Impact:
Short-term: Liquidity crunch, price volatility
Long-term: Validates Monero's core value proposition
Institutional view: "Monero is the ONLY privacy coin that actually works"
CATALYST #2: FCMP++ Upgrade - The Game Changer
Network improvements such as FCMP++ (Full Chain Membership Proofs) represent the most significant privacy enhancement since Monero's creation.
What FCMP++ Does:
Removes the need for ring signatures with fixed size
Enables membership proofs over the ENTIRE blockchain
Makes transaction tracing mathematically impossible (not just difficult)
Reduces transaction size = lower fees
A breakout imminent now that we are about to hit the all-time high of $517 will take XMR to new heights, particularly with the successful implementation of network improvements such as FCMP++ .
Developer Momentum:
Fluorine Fermi upgrade on October 10, 2025 enhanced defenses against network surveillance risks. Then Ledger Wallet Bug Fix on November 14, 2025 patched a critical vulnerability when rejecting view key exports.
Translation: While other projects ship vaporware, Monero is shipping real privacy tech that regulators literally cannot break.
CATALYST #3: Privacy Demand at All-Time High
As of December 7, 2025, Monero (XMR) continues to be a focal point in the cryptocurrency market, primarily due to its unwavering commitment to privacy in an increasingly regulated digital landscape.
The irony? Regulatory crackdowns INCREASE demand for privacy.
Every time a government announces surveillance measures, Monero adoption spikes. Every time an exchange delists XMR, peer-to-peer volume increases.
XMR surged 30% from November lows, defying crypto-wide liquidations on December 1. While Bitcoin, Ethereum, and other coins crashed with $637M in liquidations, Monero rallied.
Why? Because in times of uncertainty, people want privacy.
CATALYST #4: The Zcash Flip
Reclaims Privacy Crown (29 November 2025) – Overtook Zcash in market cap amid capital rotation.
This is MASSIVE. Zcash (ZEC) was Monero's main competitor for years. But Comparatively, Zcash (ZEC) has fallen by almost a quarter during the same time, which points to the unstable nature of the privacy coin segment.
Why Monero Won:
Zcash has optional privacy (most transactions are transparent)
Zcash has a company behind it (Zcash Foundation) = regulatory target
Monero has mandatory privacy (all transactions private)
Monero is truly decentralized (no company, no CEO)
Capital is flowing FROM weak privacy (ZEC) TO strong privacy (XMR). This trend is accelerating.
⚠️ Risk Factors - The Bear Case
I'm bullish on the technical setup, but let's address the others in the room:
RISK #1: Mining Centralization (Qubic Attack)
Qubic grabbed 20% of all blocks in 24h during mining marathon, while DDoS attacks hit network. Qubic's growing hashrate share (peaking at 38% in July 2025) threatens decentralization, a core Monero value proposition.
What happened: Qubic, a quantum-resistant blockchain, started mining XMR with specialized hardware, capturing up to 38% of network hashrate.
Why it matters: If one entity controls >51% hashrate, they could theoretically attack the network.
Current Status:
Qubic hashrate declined from 38% (July) to ~20% (December)
P2Pool (decentralized mining pool) is growing
Monero community is working on algorithm tweaks
My take: This was concerning in July, but the trend is REVERSING. Hashrate is becoming more distributed again.
RISK #2: Thin Liquidity = High Volatility
24-hour trading volume of $114.56M is low compared to XMR's $7.21B market cap.
Volume-to-Market Cap Ratio: 1.6% (very low)
Bitcoin: ~5-8%
Ethereum: ~4-6%
Monero: ~1.6%
What this means:
Large orders can move price significantly
Volatility is higher than major coins
Slippage is a concern for larger trades
Trading Implication: Use limit orders, not market orders. Scale in/out slowly.
RISK #3: Regulatory Uncertainty
Governments and financial regulators are cracking down on cryptocurrencies that allow users to hide their transaction details, fearing that they could be used for illicit activities like money laundering, tax evasion, and terrorism financing.
Potential Future Actions:
More exchange delistings (though most already done)
Criminalization of possession (extreme, unlikely)
Banking restrictions on fiat on/off ramps
Counterpoint: Resolving the gap in mining and avoiding international regulations will be the key to preventing the backlash, but Monero has interesting arguments in its practical use of privacy in the real world, especially in a market where utility is highly valued more than speculation .
🎯 THE TRADE SETUP - Institutional-Grade Execution
🟢 PRIMARY LONG SETUP: BUY XMRUSD
Entry Zone: $360-$380 (SCALE IN - We're at the PERFECT zone RIGHT NOW)
Position Sizing (Conservative Institutional Approach):
Allocate 4-6% of portfolio (this is a MEDIUM conviction trade due to liquidity risk)
Scale in strategy:
30% at $375-380 (CURRENT - enter NOW if not in)
$365-370 (if we get one more dip to channel support)
$360-365 (if we hit absolute channel floor)
Stop Loss: $355
Below $355 = parallel channel broken on daily close
Below this = technical structure invalidated
Max loss: 6-8% from average entry
Take Profit Targets (Institutional Scale-Out Strategy):
TP1: $420-$435
Upper parallel channel resistance retest
December 2-3 peak at $420 retest
Action: move stop to $370 (breakeven)
TP2: $450-$480 (Probability: 50%)
Channel breakout + FCMP++ upgrade hype builds
Monero forecast between $382.54 and $456.36 next year
Action: move stop to $420 (lock gains)
All-time high $517.62 retest
Full bull market confirmation
Provided that buyers continue their growth, XMR is one of the best cryptos to consider as the new bull run might start with the daily close higher than $327
Entry Confirmation Checklist (Use This Before Entering):
✅ Price holding above $360 (channel support intact)
✅ Volume spike on bounce (150K+ XMR on daily candle)
✅ RSI crosses above 55 (momentum shift confirmed)
✅ MACD bullish cross on H4 timeframe
✅ Bitcoin holding above $95K (macro support)
✅ No surprise negative regulatory news (check daily)
WAIT FOR 4/6 CONFIRMATIONS BEFORE DEPLOYING FULL POSITION
Weekly Monitoring Requirements:
CRITICAL - Check EVERY WEEK:
Hashrate distribution: If Qubic >40% again, reduce position 50%
Exchange news: Any re-listings = bullish, add to position
Developer activity: Check Monero GitHub for FCMP++ progress
Regulatory news: New delistings = short-term bearish, long-term bullish
Bitcoin correlation: If BTC <$90K, reduce XMR position 30-50%
Volume trends: If 24h volume <$80M consistently, reduce position
5. Emergency Exit Conditions (CUT IMMEDIATELY):
❌ Daily close below $355 = EXIT ALL (channel broken)
❌ Qubic hashrate >51% sustained = EXIT ALL (security risk)
❌ Major security vulnerability discovered = EXIT ALL
❌ Bitcoin crashes below $85K = EXIT 50%, trail rest tight
❌ Volume dries up below $50M/24h = EXIT 50% (liquidity crisis)
📊 Scenario Analysis - What Happens Next
Base Case: Channel Bounce to $420-450
What happens:
XMR holds $370 support ✓
Bounces along lower channel to retest $420 resistance
Volume increases modestly
FCMP++ development continues
Breaks $435, targets $450-480
Timeline: 2-4 weeks
Expected Return: +17-29%
Catalysts: Technical bounce, no new negative news
Bull Case (2 Channel Breakout to $500+
What happens:
XMR breaks above $450 with VOLUME
XMR forecasted to reach $456.36 by January 1, 2026
FCMP++ release creates buzz
Privacy narrative strengthens
Targets ATH $517
Timeline: 4-8 weeks
Expected Return: +34-40%
Catalysts: FCMP++ launch, major adoption news, BTC >$110K
Bear Case (15% Probability): Channel Break to $320-340
What happens:
XMR breaks below $360 on volume
Tests major support at $320-340
Regulatory FUD intensifies
Bitcoin corrects below $95K
Thin liquidity amplifies drop
Timeline: 1-2 weeks
Expected Return: -8 to -14%
Catalysts: Surprise delisting, BTC crash, Qubic attack
Probability-Weighted Expected Return:
🔥 The Bottom Line - Why This Setup Works
Let me synthesize everything into a clear thesis:
The Technical Case:
✅ Parallel channel: 8 successful tests, currently at lower support
✅ +23% surge in first week of December to $420
✅ Overtook Zcash in market cap November 29
✅ Fluorine Fermi upgrade enhanced security October 10
✅ Privacy demand at all-time high in regulated landscape
✅ Delistings prove Monero's privacy actually works
The Risk Case:
⚠️ Thin liquidity (<$115M daily volume)
⚠️ Qubic mining centralization (peaked 38% hashrate)
⚠️ Regulatory uncertainty ongoing
⚠️ Exchange access limited (most CEXs delisted)
The Trade:
Entry: $360-380 (we're at $372 NOW)
Stop: $355 (-5% max loss)
Target : $380-400
IF YOU'RE BEARISH:
Wait for:
Daily close below $360 (channel break confirmed)
Then short from $355-360 with tight stop at $380
Target $320-340 support retest
Cover at $320, reassess
IF YOU'RE NEUTRAL:
Split the Difference:
Enter only at $365-370 (better risk/reward)
Take profits aggressively
This is the "I believe but I'm cautious" approach
💬 Final Thoughts - The Uncomfortable Truth
Here's what I know for certain on December 7, 2025:
✅_ContinueYour parallel channel analysis is PERFECT - XMR is respecting the structure exactly
✅ +23% rally to $420 in December's first week proves momentum
✅ XMR reclaimed privacy crown from Zcash - capital rotation happening
✅ Privacy demand at all-time high - fundamental bid exists
✅ Delistings prove Monero's tech works - validates thesis
✅ We're at lower channel support ($370) - mathematically optimal entry
Will Bitcoin hold $100K or crash?
Will Qubic attack Monero's hashrate again?
Will more exchanges delist (though most already have)?
Drop a 🟠 if you're entering XMR at $360-380 channel support.
Drop a 📊 if this parallel channel analysis helped you.
Drop a 🔒 if you believe in privacy's future.
Drop a 💰 if you're ready for $450+ in Q1 2026.

EURCAD higher bearish expectations
OANDA:EURCAD last what we are see is be break of DESCENDING TRIANGL, currently price on trend line, expecting here break of same.
SUP zone: 1.62800
RES zone: 1.60500, 1.60000

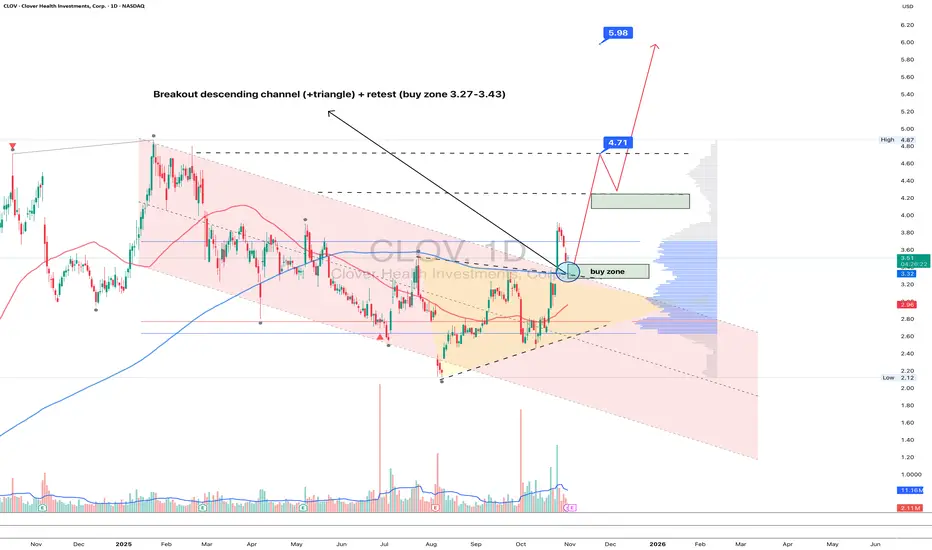
CLOV 1D - Health Is Back in TrendOn the daily chart, Clover Health (CLOV) has broken out of its descending channel and triangle, now pulling back for a retest near 3.27–3.43 - a key buy zone aligned with the MA50. Buyers are clearly regaining control, and the setup looks ready for continuation.
Technically:
– first clean breakout of the downtrend since January 2025;
– volume expansion on bullish candles, suggesting institutional accumulation;
– holding above the former resistance turned support.
Upside targets: $4.71 (local volume peak) and $5.98, offering +70% potential upside if momentum sustains.
From a fundamental perspective, Clover Health is stabilizing its business:
– a leading player in Medicare Advantage, with an expanding senior member base;
– Q3 results show 40% reduction in net loss and +18% YoY revenue growth;
– leveraging AI-driven healthcare analytics to improve efficiency and patient outcomes;
– with high short interest, a confirmed breakout above $4.70 could ignite a short squeeze.
Tactical plan: accumulation near 3.27–3.43, add above 4.70, targets 4.71 → 5.98. Sometimes the healthiest trend is the bullish one.
ETHEREUM → The emergence of a positive driver?BINANCE:ETHUSDT is soaring amid a news rally and testing resistance at 3230. The daily increase was almost 20%. If growth is expected, then after a slight correction...
Fundamental background: the market reacted to rumors of the replacement of the Fed chairman with Kevin Hassett, who is more “dovish” and loyal to cryptocurrencies. The market broke the local structure and updated the interim maximum from 3070 to 3230. A false breakout of resistance is forming relative to the key resistance level, and the market is entering a correction/stagnation phase.
Bitcoin, the main driver of the cryptocurrency market, faced strong resistance at 95K. The global market trend is downward, and a change in trend will require time and more confirmation...
There is a struggle for resistance in the market, and several scenarios are possible: consolidation and a breakout of resistance, or growth after correction...
Resistance levels: 3230, 3370
Support levels: 3172 (local), 3057
High probability: a false breakout of 3230 will trigger a correction to 3050 (before the news). If the bulls keep the price above 3050, growth may continue as part of the change in the fundamental background.
BUT! If buyers keep the price without correction, then the focus will be on 3230. Consolidation above this level could trigger growth to 3370 - 3620.
Best regards, R. Linda!

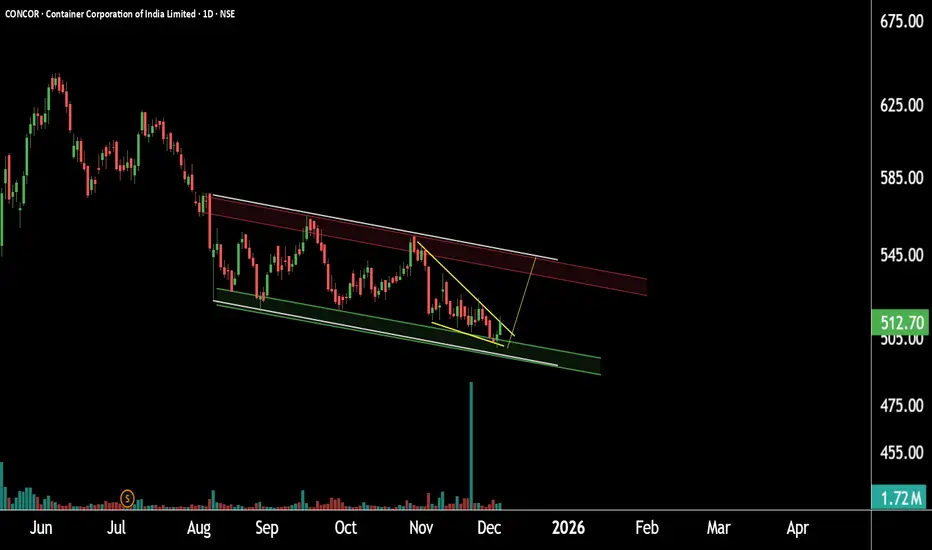
Concor Ready for Support Reversal ?This is the daily timeframe chart of Concor.
The stock is trading within a falling channel pattern, with a strong support zone around 490–510.
On the shorter timeframe, the structure is forming a falling wedge near the 500–510 area. If this support zone holds,
the stock may witness a potential upside toward 540.
Thank you.
USDCAD higher bearish from here expected
USDCAD trend based analysis, we are have break of RECTANGLE, in last days we can see domination of CAD and price is come here again in RECTANGLE and price also is in DESCENDING CHANNEL,
from here expecting higher bearish trend.
SUP zone: 1.40500
RES zone: 1.39500, 1.39000

EURUSD → Consolidation above downtrend resistance FX:EURUSD is attempting to reverse the trend amid expectations of interest rate cuts in the US. Important resistance at 1.165...
The dollar is breaking the support of the bullish trend amid expectations of interest rate cuts and news related to Powell. A decline in the index will support the euro exchange rate.
EURUSD is breaking the resistance of the downtrend, followed by bulls trying to keep the currency pair above 1.160, a psychological level. Against the backdrop of the dollar's decline, there is a chance of a breakout above 1.165 and growth
Resistance levels: 1.165 - 1.1656
Support levels: 1.159, 1.155
Before breaking through resistance, the market may consolidate or retest support. However, a breakout of 1.165 - 1.1656 and a close above this zone could trigger a distribution towards 1.173 - 1.182
Best regards, R. Linda!

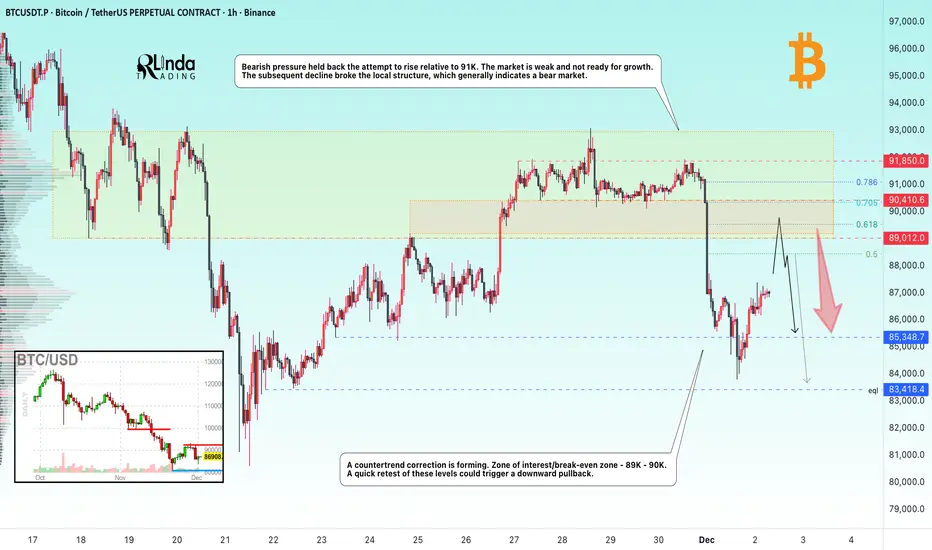
BITCOIN → The hunt for liquidity before the fallBINANCE:BTCUSDT.P continues to update lows within the global downtrend. The retest of 91K confirmed the dominance of bears...
The downtrend continues. The technical and fundamental situation for the crypto market is neutral to weak.
Bearish pressure held back the attempt to rise relative to 91K. The market is weak and not ready for growth. The subsequent decline broke the local structure, which generally indicates a bear market, but after updating the local minimum to 83700, a countertrend correction is forming. Zone of interest/break-even zone - 89K - 90K. A quick retest of these levels could trigger a downward pullback.
Resistance levels: 89K, 90K
Support levels: 85,400, 83,400
A retest of the range boundary and zone of interest could trigger a liquidity squeeze and a further decline if the bears keep the price below these boundaries.
Best regards, R. Linda!
BTC/USDT 4H Chart Review🧭 1. Main Market Structure
The chart shows:
A broad downward channel that has been in place since the end of October.
The price bounced off the upper line of the channel, made a local upward impulse (orange trend line), and then broke it, returning back towards the lower regions of the channel.
➡️ This means that the dominant trend is still downward, and upward bounces are corrections.
🧨 2. Current Chart Situation
BTC has broken through:
the local uptrend (orange line)
fell below the 88,500–89,000 zone (green)
is heading towards further support levels
Currently, the price looks like a typical retest of the broken structure and a continuation of the decline.
🟩 3. Key Price Levels (S/R)
Resistance (upper – green):
91,600 – 92,000 – key level, a breakout would negate the local downtrend
95,000 – 97,500 – upper range of the descending channel
Support (lower – red):
85,300 – 85,800 – local support (price is currently reacting here)
83,000 – 83,100 – strong horizontal support
79,800 – strong support, historically strong in this timeframe
76,600
75,000 – lower band of a potential drop + near the lower boundary of the channel
➡️ The most logical downside targets are 83,000 and 79,800.
📉 4. Descending Channel (black) (lines)
The price has rebounded from the upper range of the channel and is heading towards the lower range.
The middle line of the channel has been broken down → a signal of trend continuation.
The lower boundary of the channel indicates a potential low around 75,000–78,000.
🔄 5. Stoch RSI
Currently oversold in the oversold zone, it is starting to curve upwards.
In a downtrend, long signals are weaker, but a short-term rebound is possible.
🧭 6. Scenarios
📉 Bearish scenario (more likely)
Technical rebound to 88,500 – 89,000
Rejection from this zone → continued decline
Targets:
83,000
79,800
Extremes: 76,000 – 75,000
➡️ This scenario is consistent with the trend and a rebound from the upper channel.

GBPUSD → Attempt to change the trendFX:GBPUSD is attempting a trend reversal. The likelihood of an interest rate cut is quite high, which could support the pound's rise.
The dollar is attacking the uptrend support level, failing to consolidate above 100.0. Ahead of the interest rate meeting, another rate cut could weaken the dollar, which in turn would support the pound sterling.
The currency pair is breaking downtrend resistance, and bulls are attempting to hold the price above 1.3191. A prolonged squeeze could shift the imbalance toward buyers, which in turn could trigger a rally.
Support levels: 1.3191, 1.3124
Resistance levels: 1.337, 1.353
The price has entered the trading range of 1.3191 - 1.3370. Consolidation is forming above key support, but the market may test this area of interest before continuing its rise at the European session's opening. A false breakdown and price holding above 1.3191 could support further growth.
Best regards, R. Linda!

SOLANA → Countertrend correction. Bear market BINANCE:SOLUSDT.P is forming a correction after retesting the intermediate bottom of 120.0. Ahead lies a fairly strong and important zone of interest, to which the market may react...
The market structure is bearish. After updating the low within the bearish trend, a countertrend correction to the liquidity zone is forming. A retest of resistance at 143-145 may end in a false breakout and a fall.
Bitcoin is also stagnating. There is no strong support from the fundamental side, and the market is also far from technical support. There is still potential for a fall...
Resistance levels: 143.35, 145.67, 150.8
Support levels: 133.12, 128.3
The coin is within the trading range of 120.0 - 144.0. Accordingly, after a retest of support, a retest of resistance is forming, but pressure on the market is being exerted by a weak fundamental background and a downward trend. A false breakout of this zone of interest could trigger a sell-off...
Best regards, R. Linda!

BITCOIN → Retest of the 94,000 zone of interest...BINANCE:BTCUSDT.P is rebounding from its interim low of 80,000. However, it is still too early to talk about a bull market, as a countertrend correction is forming under the current circumstances.
Globally, Bitcoin is in a downtrend, with the zone of interest for a countertrend correction being 94,000-95,000. The market structure is bearish, and a retest of the break-even zone could trigger a downward movement within the trend.
After a strong liquidation to 80K, the market is forming a pullback, which is a basic phenomenon. There is no confirmation of a trend reversal yet, and the fundamental background is neutral, without clear support. Various analytical services suggest that the market is in a cleansing phase and has so far only liquidated short-term traders, reaching a cumulative average break-even price. A classic pullback. Technically, the zone of interest or magnet for the medium-term market is 75K (on the daily timeframe).
Resistance levels: 93,000, 94,000, 97,300
Support levels: 89,000, 86,000
In the current situation: a bearish trend, weak purchasing power, and a weak fundamental background, I consider a pullback to be the primary reaction to the 93-94K zone. However, the market is not constant, and if support appears (news or other drivers) and Bitcoin manages to stay above 95K, then growth can be expected.
Sincerely, R. Linda!

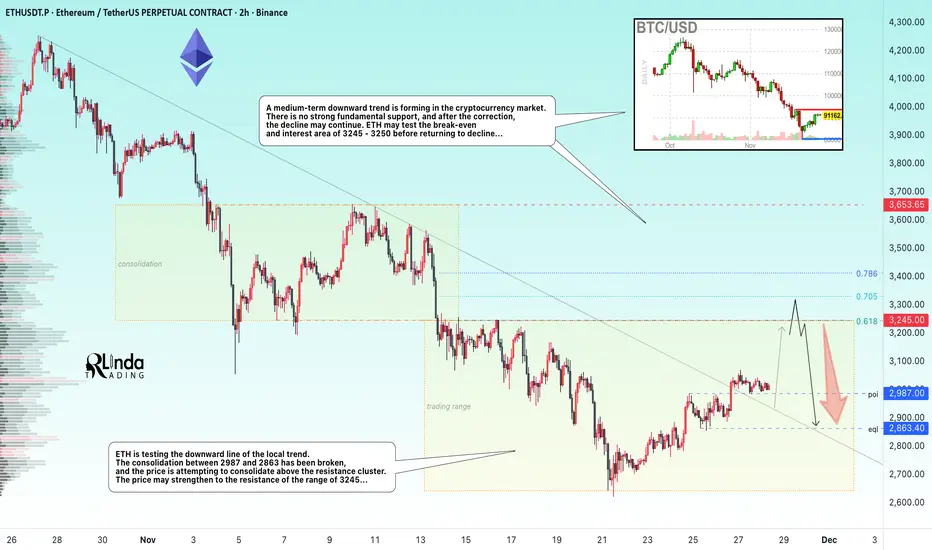
ETHEREUM → Countertrend correction. The hunt for liquidity BINANCE:ETHUSDT is testing the downward trend line and attempting to break through the resistance conglomerate. Overall, against the backdrop of low liquidity, the market has the opportunity to test 3245...
Against the backdrop of low liquidity and without the presence of the American side in trading, ETH is testing the downward line of the local trend. A medium-term downtrend is forming in the cryptocurrency market. There is no strong fundamental support, and after the correction, the decline may continue. Any attempts at growth at this point can be seen as an opportunity to sell profitably...
A breakout is forming and an attempt is being made to keep the price in the long zone. If the bulls keep the price above 2897 after retesting support, the price is likely to strengthen to the resistance range of 3245... However, a false breakout (liquidity capture) of key resistance may remind the market of the relevance of the downward trend...
Resistance levels: 3000, 3245
Support levels: 2987, 2863
I expect two movements. If the price stays above 2987 (after retesting), then Ethereum will be able to retest the resistance of the range. A false breakout of the resistance range could trigger a price decline within the global downtrend that has been developing for 3 months...
Best regards, R. Linda!
EURUSD → Formation of an intermediate bottom...FX:EURUSD is forming a consolidation, which hints at a halt in the downward correction. The market is waiting for news that could trigger strong movements...
The dollar is pausing and moving into consolidation. If the index enters a correction phase, the euro will go up. A breakout of 1.155 could confirm a change in the local trend and trigger a rally.
The price is trading within a downward price channel; locally, the market is not ready to update the low and is consolidating above 1.150 and 0.7f. Accordingly, the focus is on the current consolidation: 1.150 - 1.155
Resistance levels: 1.155, 1.1606
Support levels: 1.1524, 1.1502, 1.1473
The price is currently consolidating, which means that the market is preparing for possible movements. A breakout of one or another boundary could trigger a rally. A breakout of resistance will confirm a change in the local trend. However, a breakout of support could trigger a continued decline to 1.1473.
Best regards, R. Linda!

BNBUSDT → The hunt for liquidity before the decline BINANCE:BNBUSDT.P breaks through the 880 support level as part of a global downtrend and updates its low to 790. Fundamentally and technically, the situation is weak...
Bitcoin and the cryptocurrency market as a whole are in a global downtrend. Within the trend, countertrend corrections are forming as a “hunt for liquidity” before the decline continues...
After updating its low to 790.9, BNB is forming a pullback, the target of which may be the resistance area of 879-888, which acts as a break-even zone (area of interest for MM). A false breakout could trigger a decline of 1/2, 2/3 of the current range.
Resistance levels: 879-880, 940
Support levels: 837, 814, 790
A retest of resistance and a lack of bullish potential could trigger a false breakout. Consolidation and a close below 879 could lead to another phase of selling and a correction to 837-814.
Best regards, R. Linda!

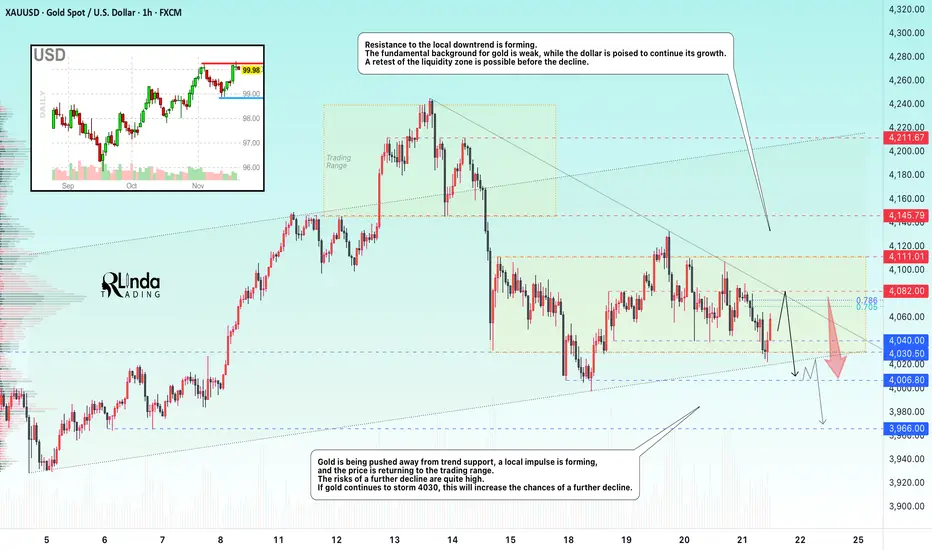
GOLD → Mixed data forms a symmetrical triangle FX:XAUUSD is bouncing off support at 4030, with bulls trying to maintain the current trend. The fundamental backdrop is currently weak for gold, which is why there are bears in the market. The PMI report is coming up...
Mixed US employment data (NFP growth to 119K, but unemployment rose to 4.4%) has created uncertainty. The probability of a Fed rate cut in December remains at 40%. Fed officials remain cautious, warning of the risks of premature easing.
Focus on the 4070-4082 area and local trend resistance...
Gold is awaiting new signals from PMI data. A breakout of the range is likely if there are significant deviations from forecasts (Manufacturing PMI: 52, Services PMI: 54.8)
Technically, a symmetrical triangle is forming on the chart, which could keep the market within its boundaries if the fundamental background remains unchanged. However, a breakout of either boundary could trigger a distribution in the direction of the break
Resistance levels: 4080, 4110
Support levels: 4040, 4030, 4006
In the medium term, gold currently looks weak. The reaction to support is weakening, a cascade of levels and a downward resistance line are forming. The market may test the 4080 area, but if the PMI is weak, gold will return to attack the trend support. However, a break above 4082 and a close above this zone could give us a chance for growth.
Best regards, R. Linda!
NZDUSD → The hunt for liquidity. Bearish trend...FX:NZDUSD is forming a correction towards consolidation after updating its global minimum. Bears may play aggressively against the backdrop of a strong dollar.
The dollar is quite strong after Thursday's news. After retesting resistance, the index is not falling, but is gathering strength and may continue to grow.
The global trend is downward. After a long consolidation, the currency pair is breaking support and updating its low. The market sentiment is bearish. Against this backdrop, NZDUSD may continue to decline after retesting resistance at 0.560 and a false breakout...
Resistance levels: 0.5606, 0.5635
Support levels: 0.555, 0.55
A false breakout, lack of bullish momentum, and price consolidation below 0.56 could trigger a further decline in price within the current trend.
Best regards, R. Linda!

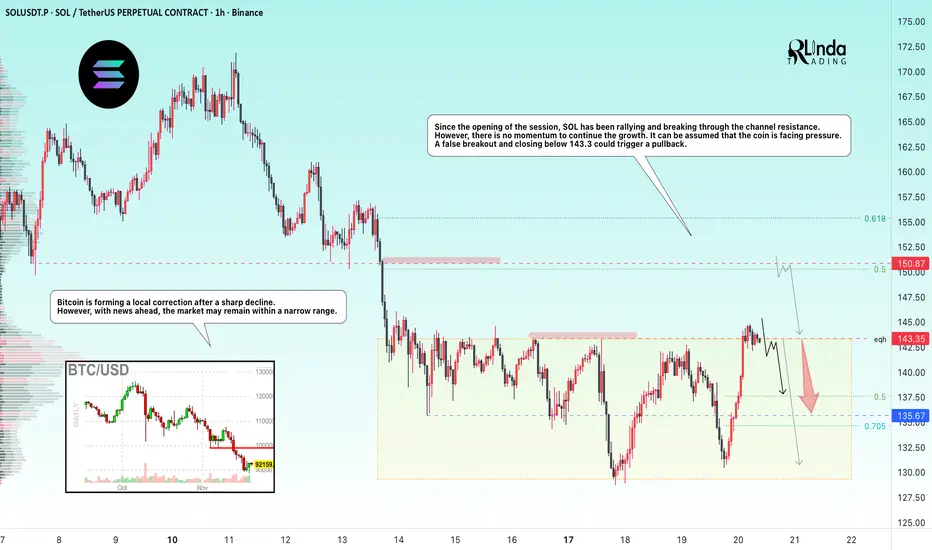
SOLANA → Manipulation - false breakout of resistance BINANCE:SOLUSDT.P flew up to resistance at 143.35 at the opening of the session and attempted to break through it, but bears may not let the price rise ahead of the news...
Bitcoin is forming a local correction after a sharp decline. However, news is ahead and the market may remain within a narrow range.
From the opening of the session, SOL rallies and breaks through the channel resistance, wasting 75% of its intraday growth potential. However, there is no momentum to continue the growth. It can be assumed that the coin is facing pressure. A false breakout and closing below 143.3 could trigger a pullback.
Resistance levels: 143.35, 150.87
Support levels: 135.67, 130.0
Two key levels for countertrend movement: 143.35 - 150.87. If the liquidity pool does not stop the price at the nearest level, then 150.87 can be considered as an additional level for trading a false breakout.
However, news on unemployment is coming soon, and the market may react quite aggressively. Therefore, if there are no trading opportunities before the news, I recommend refraining from action for an hour and waiting out the storm...
Best regards, R. Linda!
USDCAD rise/fall?USDCAD at a key zone and showing signs of weakness. Some major news coming in less than 2 hours, waiting for liquidations and reactions to jump in on sniper entries.

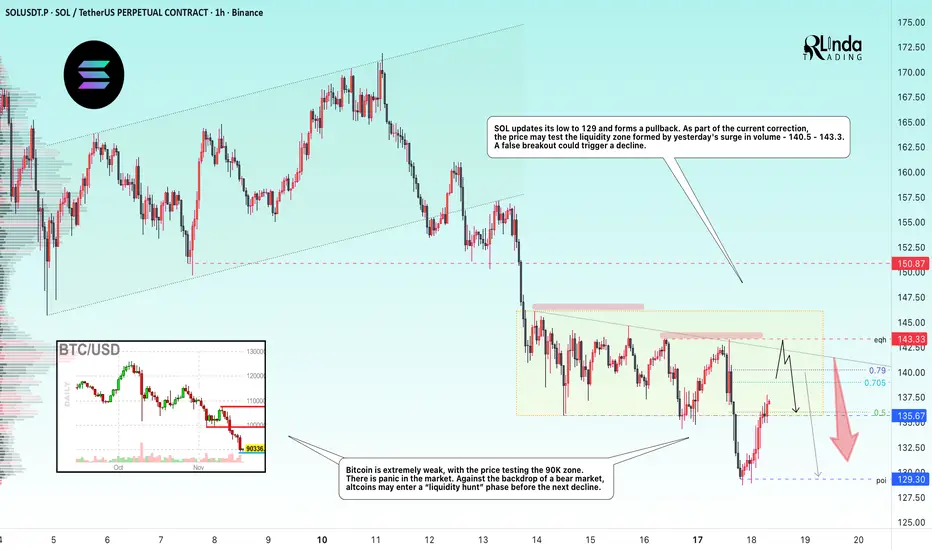
SOLANA → Hunting for liquidity in a weak market BINANCE:SOLUSDT is forming a countertrend correction. Zone of interest: 140.0–143.5. The lack of bullish potential and positive fundamentals could cause another decline...
Bitcoin is extremely weak, with the price testing the 90K zone. There is panic in the market. Against the backdrop of a bear market, altcoins may enter a phase of “liquidity hunting” before another decline.
Solana's price on D1 broke through fairly strong support at 141.3-138.5. The trend is bearish, and the breakout of support confirms the weakness of buyers (strength of sellers) at the moment.
SOL is updating its low to 129 and forming a pullback. As part of the current correction, the price may test the liquidity zone formed by yesterday's surge in volume - 140.5 - 143.3
Resistance levels: 139.0, 140.2, 143.3
Support levels: 135.67, 129.3
Consolidation is forming above the support range - 135.67. Most likely, bulls may flood the volume and provoke another rise to the liquidity zone, but there may not be enough potential for continued growth. A false breakout and lack of bullish momentum could trigger a decline to 135.5 - 129.3.
Best regards, R. Linda!