WLFI Token Faces Key PRZ – Will the Downtrend End Soon?The World Liberty Financial project with the WLFI token ( BINANCE:WLFIUSDT ) continued its downtrend as I expected in yesterday's idea .
The question is, when will this downtrend of the WLFI token end?
The WLFI token is currently moving near the Potential Reversal Zone(PRZ) , Cumulative Long Liquidation Leverage($0.1576-$0.1500) , and the round number of $1,500 .
In terms of Elliott wave theory , the WLFI token seems to be completing the main wave 3 . The main wave 3 could complete at the PRZ and the lower line of the descending channel (possible).
I expect the WLFI token to rise to at least $0.1816(First Target ) in the coming hours.
Second Target: Upper line of descending channel
Cumulative Short Liquidation Leverage: $0.1905-$0.1845
Stop Loss(SL): $0.1487
Please respect each other's ideas and express them politely if you agree or disagree.
World Liberty Financial Analyze (WLFIUSDT), 15-minute time frame.
Be sure to follow the updated ideas.
Do not forget to put a Stop loss for your positions (For every position you want to open).
Please follow your strategy and updates; this is just my Idea, and I will gladly see your ideas in this post.
Please do not forget the ✅' like '✅ button 🙏😊 & Share it with your friends; thanks, and Trade safe.
Descending Channel

BITCOIN → Sale on positive news? What to expect? 100K or 130K?BINANCE:BTCUSDT.P unsuccessfully ended another attempt to break through the 112K-113K zone. The positive background (NFP) did not affect the price, and a bearish setup formed on D1...
D1 is forming a pin-bar relative to the strong resistance zone of 112K - 113K, positive news is quickly sold off, and the price, rebounding from the resistance of the trading range, closes near the bearish trigger of 110500. Bitcoin looks quite uncertain as it faces selling pressure in the 112K-113K zone. The price cannot consolidate above this area despite the previously broken correction resistance. There is logic in this maneuver... The market is betting on a more than 90% chance of interest rate cuts, and by that point, the price of Bitcoin may fall to the maximum permissible limits before further growth. Areas of interest may be 107K - 105K - 100K
Resistance levels: 111.9K, 113.3K, 117K
Support levels: 110.5K, 107.4K, 105.0K
A breakdown of the 110.5K support could trigger further sell-offs towards the support of the key trading range. Within the current downward cycle, the price may well test 105,000, which is a fairly strong liquidity zone. The fundamental background is positive, and the current sell-off may be manipulative movement before the emergence of a bullish driver...
Best regards, R. Linda!

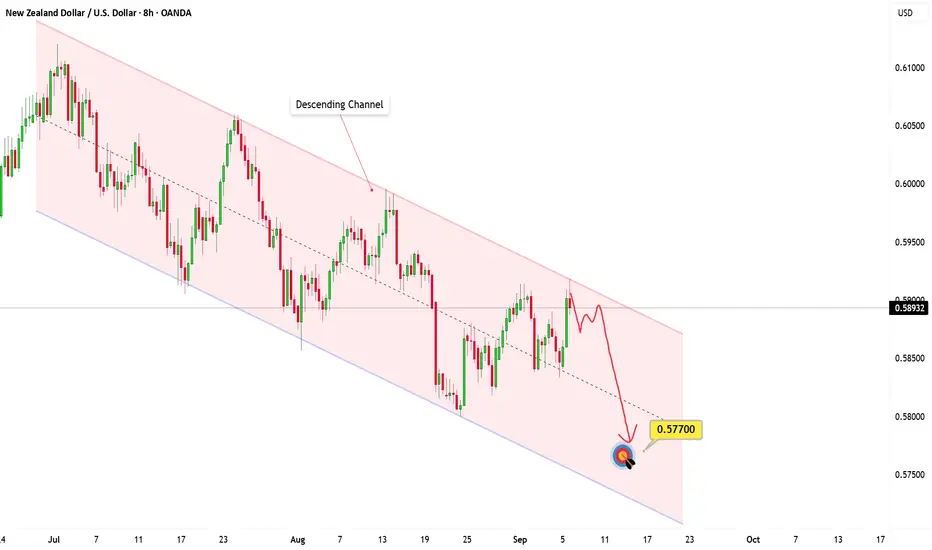
Channel Still Intact – Bears in ControlOANDA:NZDUSD Looking at the chart, price is locked inside a textbook descending channel — clean lower highs, lower lows, and clear respect for both boundaries.
Right now, price is retesting the upper edge of that channel. Historically, sellers have defended this zone multiple times, and the structure hints we may see another rejection here.
If that happens, the short setup is straightforward: target the lower boundary near 0.577XX.
The trend remains bearish, and in channels like this, going with the flow beats fighting it.
Until bulls break this channel convincingly, the bears are in control.
Do you see it the same way? Drop your thoughts below
Not financial advice — just sharing my chart view. Trade safe!
Strong base + steady trend = Buy City Union BankCity Union Bank (CUB) – 4H Chart Analysis
Polarity Zone: Stock holding well near 185–190 levels.
Pattern: Moving inside a short-term falling channel.
Support: Strong boundary support near 190.
Outlook: If this support zone sustains, we may see higher prices ahead in CUB.
Thank you.

Breakout Alert!Granules India is ready to shine—watch this spaceGranules India Limited – Technical Outlook
Weekly Timeframe
Granules India is moving within a well-defined parallel channel. The stock is currently approaching its middle boundary resistance near 560–590 levels and support near 430-450
On the daily chart, the stock has formed a descending parallel channel, and this time, the chances of a breakout are higher as the price action has developed a double bottom formation.
Daily Timeframe
Additionally, Granules India is forming an ascending broadening wedge pattern, with key resistance near 590 and support around 430, which was successfully tested before making a new high.
Overall, the technical structure indicates strong breakout potential in the near term.
Thank You !!

BITCOIN → Breakthrough of the downward trend resistance... 120K?BINANCE:BTCUSDT.P formed a false breakdown of key support at 110,000 - 112,000 and returned to the whales' zone of interest. The chart shows the prerequisites for a possible end to the countertrend correction...
A false breakdown of the daily support of 110K - 112K provokes a local bearish rally, within which the price breaks through the downward resistance of the correction and tests 113.300. The growth was supported by positive signals from institutional investors, technical stability and a decrease in selling pressure.
The fundamental background is positive, the market is trending. The chart shows prerequisites for the end of the correction. However, the further outlook depends on the 112.0 - 112.5K area. if the bulls hold the price above this zone, the flagship may return to the upward movement and head towards 117K - 120K.
Support levels: 112.5, 112.0, 110.9
Resistance levels: 113.6, 114.6, 117.0
After breaking through the resistance of the descending channel, the impulse stops and most likely a fight for the 112K zone may form. If the price returns to the channel and consolidates below 112K, then Bitcoin may return to the downward movement, however, while the price is trading above this line, the bulls have a chance...
Best regards, R. Linda!

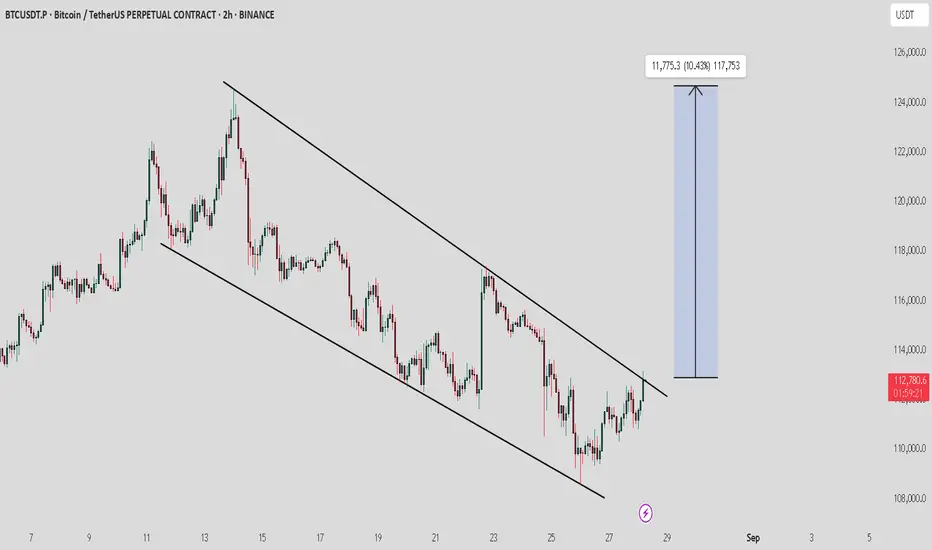
BTC / USDT : Trying to breakout from descending channelBTC/USDT is breaking out of the descending channel on the 2H timeframe. If this breakout holds, we could see a bullish rally of around +10%, targeting the $124,000 zone.
Trade Setup:
Entry: After breakout confirmation / retest hold above $113,000
Targets: $118,000 – $124,000
Stop-Loss: Below $111,000 (channel support invalidation)
As always, wait for confirmation to avoid fake breakouts and manage risk properly.
NZDJPY → A false breakout of resistance will trigger a declineFX:NZDJPY entered a correction phase after a sharp decline. The main trend is downward, with a countertrend movement aimed at consolidating potential before further decline.
A countertrend correction is forming against the backdrop of the main downward trend. The current movement may be aimed at hunting for liquidity before continuing its movement. Focus on the resistance zone at 86.67
The currency pair is trading below key resistance within the global downtrend. As part of the correction, the price may test 86.67 - 87.10 before continuing the main trend.
Resistance levels: 86.67, 86.97, 97.11
Support levels: 85.97, 85.6
If a false breakout of the key zone of interest forms during the correction without the possibility of continuing growth, we will receive confirmation that the market is ready to move down. Consolidation below the level may trigger a downward impulse.
Best regards, R. Linda!

EURUSD - Descending Channel in PlayTimeframe: 1H
Pair: EUR/USD
Chart Overview
The pair is currently trading within a descending channel, forming consistent lower highs (LH) and lower lows (LL).
Resistance: Clearly marked at the upper trendline.
Support: Holding at the lower trendline.
RSI: Showing a bullish divergence on the latest LL, suggesting potential short-term momentum shift.
Key Points
Price action respects the channel structure.
Any rejection from the resistance trendline could lead to a continuation towards support.
A breakout above resistance (channel top) with volume could open room for a bullish correction.
RSI divergence is worth monitoring closely as it may indicate early signs of weakening bearish momentum.
Trading Plan (Not Financial Advice)
Bearish Scenario: Look for short opportunities on rejection from resistance.
Bullish Scenario: Watch for breakout and close above the channel for possible long entries.
📊 Bias remains bearish until a confirmed breakout occurs.

BTCUSD Short: Targeting Channel Support at 107800Hello, traders! The price auction for BTCUSD has been clearly contained within a descending channel for an extended period. This bearish structure was established by key pivot points that defined the upper supply zone near 117350 and the lower demand territory. Since the formation of this channel, every rally attempt has been met with significant selling pressure from the supply line, consistently confirming that sellers are in control of the dominant trend.
At present, the price has completed another impulsive move downwards within this structure. BTCUSD is now trading at a critical juncture, directly testing the major horizontal demand level at 111000. The market is currently pausing at this support, which represents the upper boundary of the wider 111000 - 110300 demand area, a key battleground for market participants.
The working hypothesis is a short continuation scenario. It is anticipated that after a brief dip into the demand area, a minor corrective bounce may occur. However, this rally is expected to fail, with sellers reasserting control. This failure would confirm that the bearish momentum remains dominant, setting the stage for the next leg down. The take-profit is therefore set at 107800 points, targeting the lower demand line of the channel. Manage your risk!

LIC on the Rise!Chart structure indicates long positions favoredLIC Daily Chart Update
LIC is currently moving in a well-defined ascending parallel channel.
Alongside, a short-term descending parallel channel is also visible.
Both channels are showing strong lower boundary support in the 830–850 range.
If this support zone holds, we may witness higher prices in LIC in the coming sessions.
Thank you.

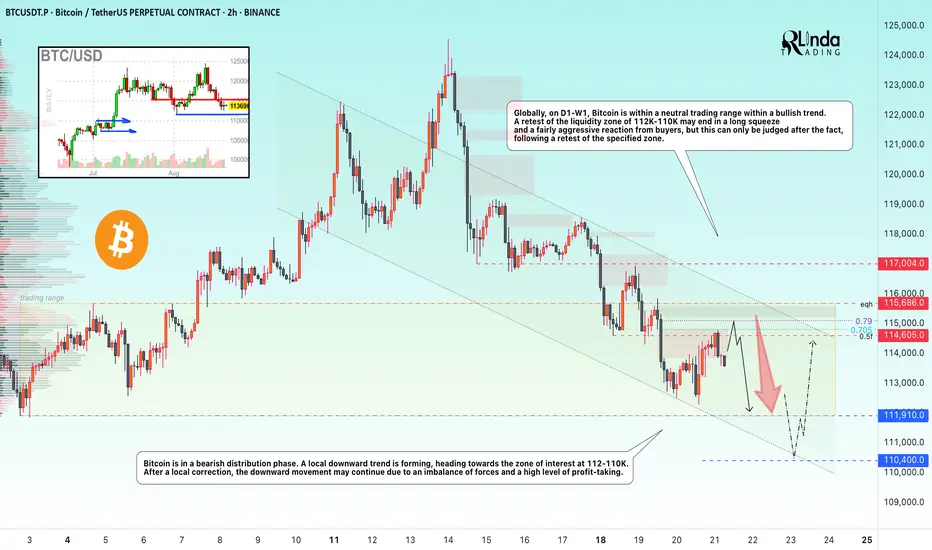
BITCOIN → Retest 112K - 110K before growthBINANCE:BTCUSDT.P is stuck within the trading range of 112K - 123K. The false breakout of the ATH ended with a reversal of the local trend and a bearish distribution phase, which may target the liquidity zone at 112 - 110K.
The market remains bullish, with no fundamental changes for the cryptocurrency market and the situation remaining positive. Technically, we are seeing a countertrend correction within the bullish trend. Bitcoin is in a distribution phase. A local downward trend is forming, directed towards the zone of interest 112 - 110K. After a local upward correction, the downward movement may continue due to an imbalance of forces and a high level of profit-taking.
Globally, on D1-W1, Bitcoin is within a neutral trading range within a bullish trend. A retest of the liquidity zone of 112K-110K may end with a long squeeze and a fairly aggressive reaction from buyers, but this can only be judged after the fact, following a retest of the specified zone.
Resistance levels: 114.600, 115680, 117000
Support levels: 111910, 110400
The downward movement is purposefully heading towards the zone of interest. Earlier, in early August, the market tested the specified level (previous ATH), but technically did not reach the liquidity zones. There is a fairly high chance of a retest of 112 - 110K before the market attempts to grow.
Best regards, R. Linda!
EURUSD Testing 1.16650 in Descending Channel as DXY Holds 98.100Hey Traders, in today's trading session we are monitoring EURUSD for a selling opportunity around 1.16650 zone, EURUSD continues to trade inside a descending channel, with price correcting upward toward 1.16650, a key resistance zone aligned with channel structure.
At the same time, the U.S. Dollar Index (DXY) remains in an uptrend and is approaching 98.100 support. With recent inflation readings running high, markets may expect a more hawkish Federal Reserve, which could support further USD strength.
Monitoring how EURUSD reacts near 1.16650 in relation to DXY’s price behavior to gauge whether bearish momentum will resume or consolidation will continue.
Trade safe, Joe.

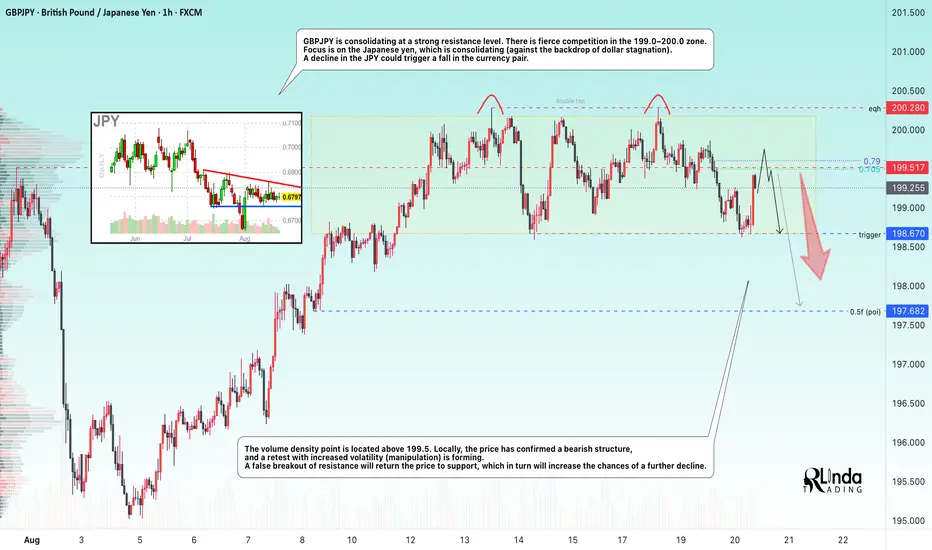
GBPJPY → False breakout and reversal patternFX:GBPJPY is forming a false breakout of strong resistance from D1. A trading range (consolidation) is forming, and market participants are fighting for the 199.0 - 200.0 zone.
GBPJPY is consolidating at strong resistance. A fierce battle is underway for the 199.0-200.0 zone. Focus is on the Japanese yen, which is consolidating (against a backdrop of dollar stagnation). A decline in the JPY could trigger a fall in the currency pair.
The volume density point is located above 199.5. Locally, the price has confirmed a bearish structure, and a retest is forming on increased volatility (manipulation). A false breakout of resistance will return the price to support, which in turn will increase the chances of a further decline
Resistance levels: 199.5, 200.28
Support levels: 198.67, 197.68
A double top reversal pattern is forming on the chart, indicating the presence of strong limit resistance, but the pattern has not yet been realized. The trigger is consolidation support. Locally, I expect a decline from 199.5 to retest the trigger, the breakout of which could trigger the reversal pattern.
Best regards, R. Linda!
GOLD → The market is waiting for a kick (driver). ConsolidationFX:XAUUSD is in a stalemate. A “casino” pattern is forming in the form of a symmetrical triangle. The odds are 50/50, and everything depends on the fundamental background and the emergence of a driver.
Gold is stuck in a symmetrical triangle - consolidation.
Gold is trading around $3330 on Tuesday, remaining in a range with a downward bias amid caution among traders ahead of the Fed minutes.
Technically, it is possible to trade the breakout from consolidation with the price consolidating above a certain level, i.e., post-factum.
Optimism after the meeting between Trump and Zelensky, who promised to end the conflict, is reducing demand for safe assets, but expectations of a Fed rate cut this year are supporting the metal. An additional factor is the confirmation of the US rating by S&P. Powell's speech on Friday will be a key driver, while the dollar has partially recovered after its recent decline.
Resistance levels: 3349.8, 3370.7
Support levels: 3331, 3315, 3301
Volatility has been very low over the past few days, with the market waiting for someone to kick-start movement. Fundamental factors are contradictory, and technically, gold looks uncertainly weak. Based on this, I expect that a retest of the nearest resistance could end with a downward breakdown from consolidation.
Sincerely, R. Linda!

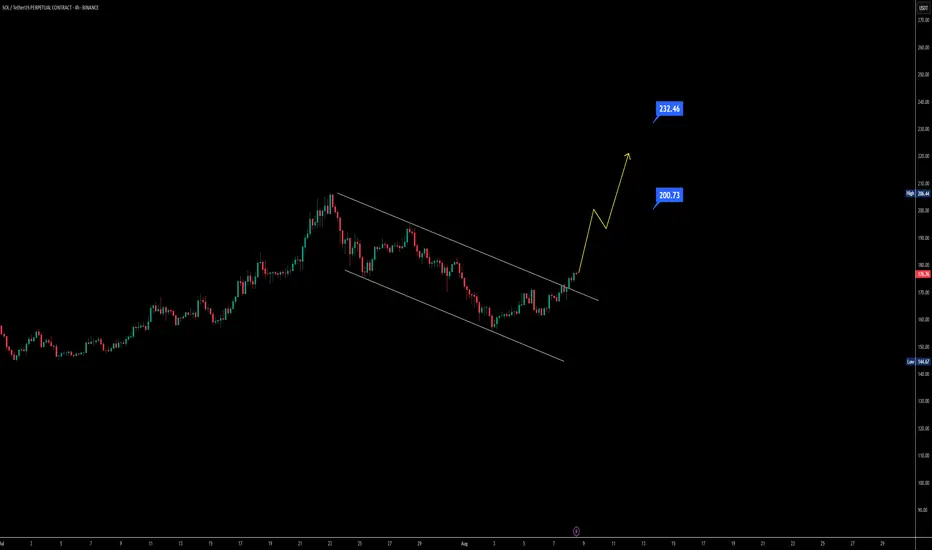
$SOL channel breakout could lead to a rally toward $260Solana has broken out of its recent downtrend on both the daily and 4-hour charts, showing clear signs of bullish strength. The price is pushing beyond its channel, and momentum suggests that the $200 liquidity zone is within reach.
If CRYPTOCAP:SOL can close above the $206 resistance, it could open the door for a rally toward $230–$260, revisiting the prime all-time high area. EMA structure is also supportive — the 21 EMA has crossed above the 50 EMA, while the 100 EMA has crossed over the 200 EMA, both reinforcing the bullish outlook.
With technical aligning and momentum building, Solana’s next move could be one of the most significant runs we’ve seen this year.
BITCOIN → Retest of resistance in the bearish trading rangeBINANCE:BTCUSDT.P is consolidating in the range of 115,600 - 113,500. The price is testing resistance, relative to which a huge pool of liquidity has formed, which bears are likely to defend quite aggressively...
Idea from July 22: expectation of a decline from 120K to 112K. Target achieved
Bitcoin is correcting on D1, the price previously broke through the support level of 115650 and formed another trading range, with the previously broken lower boundary of the consolidation acting as resistance. The market has not yet tested the zones of interest at 110K and 105K, and therefore the possibility of a further decline remains relevant. A liquidity pool has formed relative to the resistance of the trading range at 115678. There is a high probability of a short squeeze before the decline.
Resistance levels: 115678, 116370
Support levels: 113530, 112660, 110K
In the short term, I expect a retest of resistance and a capture of liquidity. If the market is unable to continue its upward momentum and returns the price below the level, a false breakout will form, which may trigger a decline to the indicated areas of interest.
Best regards, R. Linda!

USDCAD → Short squeeze for further declineFX:USDCAD is forming another short squeeze relative to the global price range ahead of a possible decline within the global downtrend.
After breaking through the resistance of the global trading range, USDCAD was unable to continue its upward momentum. The price returned to the range, under strong resistance, and is forming a pre-breakdown base for a possible decline. The trigger in our case is support at 1.3762. The dollar is stagnating, trading below strong resistance. A decline in the dollar could trigger a fall in USDCAD
Support levels: 1.376, 1.3695, 1.3629
Resistance levels: 1.3774, 1.3809
The market structure is quite weak, both globally and locally. In addition, against the backdrop of an expected rate cut, the dollar may continue its downward global trend, which may also affect the price of the currency pair, which has formed a false breakout of resistance...
Best regards, R. Linda!

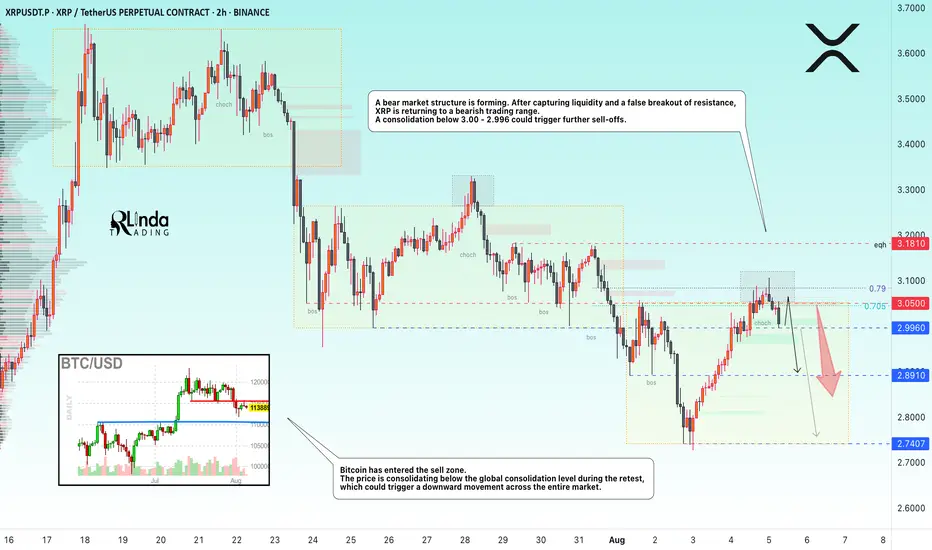
XRPUSDT → Hunting for liquidity ahead of a possible declineBINANCE:XRPUSDT.P is forming a downward market structure after a false breakout of global resistance. Bitcoin is in a correction phase and, after a slight rebound, may continue its movement...
Bitcoin has entered the sell zone. The price is consolidating below the global consolidation boundary of 115,500 during the retest, and if Bitcoin continues to decline, this could trigger a downward movement across the entire cryptocurrency market.
XRP is forming a bearish market structure. After capturing liquidity and a false breakout of resistance, the price is returning to a bearish trading range. There is no potential for continued growth at this time. A consolidation of the price below 3.00 - 2.996 could trigger further sell-offs.
Resistance levels: 2.996, 3.050, 3.181
Support levels: 2.996, 2.891, 2.74
The local bearish structure will be broken if the price starts to rise, breaks 3.050, and consolidates above it. In this case, XRP may test 3.181 before falling further.
At the moment, after a false breakout of resistance, the price is consolidating in the selling zone, and the downward movement may continue. I consider 2.74 - 2.655 to be the zone of interest in the medium term.
Best regards, R. Linda!
DXY SHORT Well, the dollar index is in a descending channel. The expectation is that the price will fall from the channel ceiling to the channel floor.
This post will be updated.,

GOLD → The market is waiting for NFP. What could happen?FX:XAUUSD is bouncing off resistance at 3310, confirming the upper limit of the new trading range. The dollar continues to rally, but the market as a whole is stagnating ahead of upcoming news—NFP is coming up!
Gold is consolidating at monthly lows around $3268, awaiting key US labor market data (NFP). Trump's new tariffs (10% globally, 35% for Canada, 39% for Switzerland) have boosted demand for the dollar, putting pressure on gold. Markets are waiting for NFP: forecast +110K jobs, unemployment 4.2%. Weak data (<100K) → gold may rise to $3400. Strong (>150K) → the dollar will strengthen, gold will continue to fall. The probability of a Fed rate cut in September is <50%.
Based on yesterday's data, I would cautiously suggest that NFP will be in the range of 125K–145K, slightly above the consensus (110K). This will play into Trump's hands (I think you understand what I mean...).
Resistance levels: 3300, 3310, 3320
Support levels: 3287, 3268, 3255
The news has a negative nuance — unpredictability. Be careful.
Technically, based on the data we have at the moment, I would assume that the market may test resistance at 3300-3310 before a possible pullback to the specified support. BUT! Unpredictable data could turn the game around, and in that case, if the dollar falls, gold could start to rise.
Best regards, R. Linda!

AUDNZD still bullish trend expecting
OANDA:AUDNZD last five analysis accurate (attached), here is new view on AUDNZD, still bullish expecting, price is not break strong zone, bouncing - pushing strongly from same, looks like DESCENDING CHANNEL is breaked.
Here still bullish expectations having.
SUP zone: 1.09100
RES zone: 1.10300, 1.10600

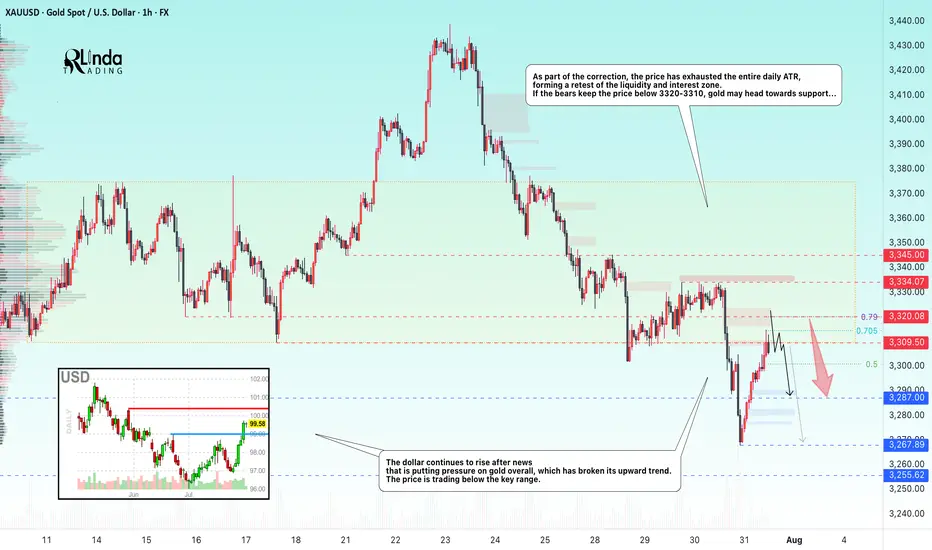
GOLD → Retest of resistance within a bearish runFX:XAUUSD breaks through the upward trend support amid a rallying dollar. Since the opening of the session, the price has been testing the zone of interest, but bears are quite aggressive...
Gold is partially recovering after falling to $3,268, a monthly low caused by the Fed's hawkish tone. The Central Bank kept its rate at 4.25–4.5% (9 votes to 2), highlighting uncertainty due to Trump's tariffs. Markets now estimate the probability of the rate remaining unchanged in September at 58% (previously 35%). The dollar's rise slowed amid concerns about the extension of the US-China trade truce and profit-taking ahead of key US employment data (after strong ADP and GDP reports). The nearest drivers are labor market statistics and trade news, while the technical picture for gold remains bearish.
Technically, on D1, the price is breaking key support zones, including the trend line, which overall only increases selling pressure on the metals market...
Resistance levels: 3310, 3320, 3334
Support levels: 3287, 3267, 3255
As part of the correction, the price has exhausted the entire daily ATR, forming a retest of the liquidity and interest zone. If the bears keep the price below 3320-3310, gold may head towards support...
Best regards, R. Linda!