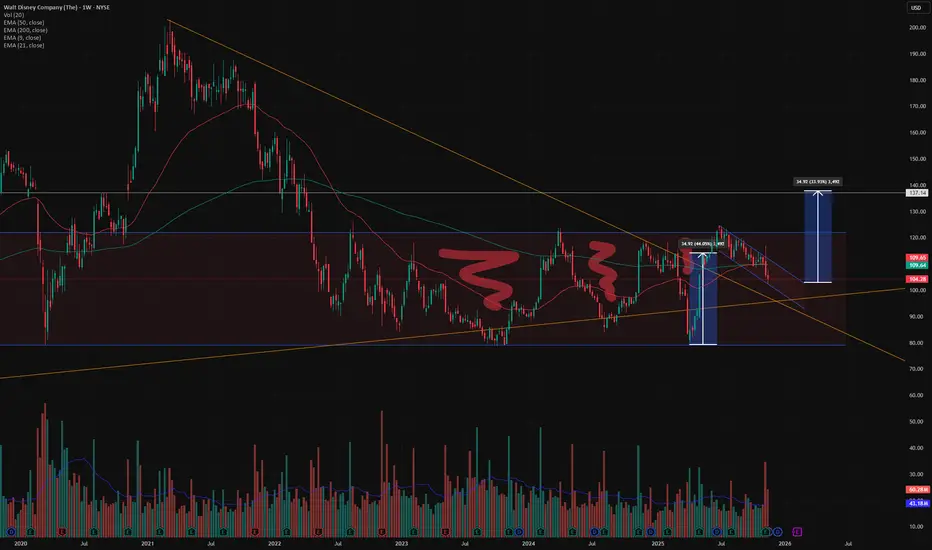
Disney Stock Breakdown: Hidden Bull Flag and the Next Big MovePrice continues to trade inside the long-term parallel channel drawn from the higher timeframe structure. This channel has been respected for several years, and price is still moving within the same range.
On the monthly chart, price is below the 50-EMA, which increases the probability of a deeper retracement toward the 200-EMA. The global downtrendline, built from the major lows, was broken by a strong two-month bullish impulse. Current price action suggests the market may be forming a retest of that breakout zone.
On the weekly timeframe, price is trading below both the 50-EMA and 200-EMA, signaling potential continuation to the downside before buyers regain momentum. MACD and RSI both point lower, supporting the expectation of a pullback. A reaction around the weekly RSI 30 zone is likely.
A bull flag structure is developing. The corrective move is slower than the preceding impulse, indicating buyers are consolidating. If a breakout occurs near the expected zone, the pattern’s measured move suggests a potential rally equal to the height of the flagpole, aligning closely with the next major resistance level.
Another important detail: upward swings inside the channel have progressively shortened, signaling weakening seller control and an increasing breakout probability.
Selling volume has also decreased week-over-week, and the company’s latest report came out positive, adding additional bullish context once the correction completes.
Overall, the base scenario: further downside into the retest area, followed by a potential bullish breakout if the flag pattern confirms.
Disneystock
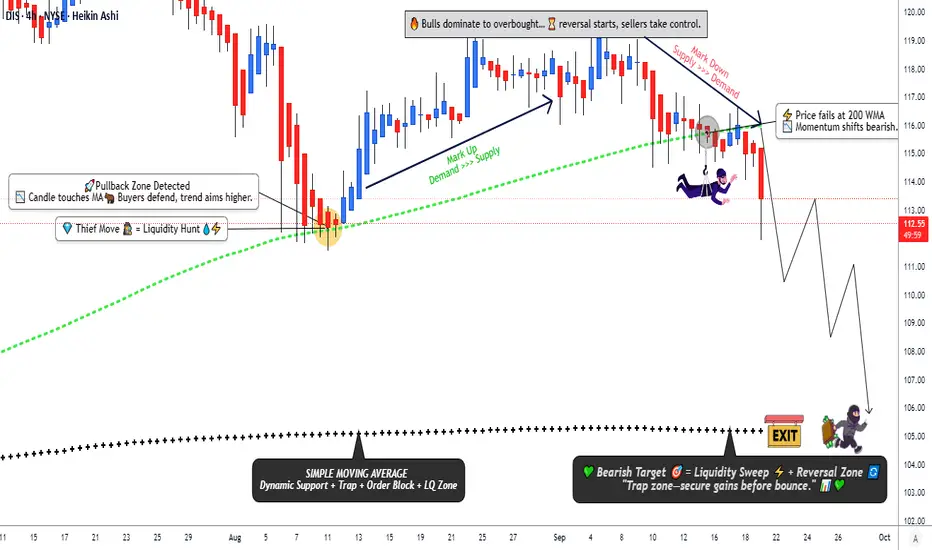
DIS Technical Breakdown – Bearish Trend Gains Momentum🎭 DIS – Walt Disney Company | Thief’s Cash Flow Management Strategy 🏰💸
Hello, Ladies & Gentlemen, welcome to the Thief OG trading crew! 😎 Ready to swipe some profits from the Walt Disney Company (DIS) stock? Let’s break down this bearish swing/day trade strategy with a sprinkle of fun and a whole lot of market swagger. 🚀 Let’s dive into the magic of cash flow management with a layered limit order approach! 🎥
📊 Asset: Walt Disney Company (DIS)
Market: NYSE
Strategy: Swing/Day Trade
Bias: Bearish 🐻
Why?: The 200-period Weighted Moving Average (WMA) has been breached by sellers, confirming a downtrend. The bears are running the show, and we’re ready to join the party! 🎉
🕵️♂️ The "Thief Strategy" Plan: Layered Limit Orders
Our Thief Strategy is all about sneaking in profits with a layered limit order approach. Think of it like setting multiple traps to catch the best entry points. 🪤 Here’s how we roll:
Entry Points: Place multiple sell limit orders to layer your entries. Suggested levels:
$116.00 📉
$115.00 📉
$114.00 📉
$113.00 📉
Pro Tip: Feel free to add more layers based on your risk appetite! Stack those entries like a master thief planning a heist. 😏
Entry Flexibility: You can enter at any price level within this range if you spot a good opportunity. Stay nimble, Thief OGs!
🛑 Stop Loss: Protect Your Loot
Thief Stop Loss: Set at $118.00. This is our safety net to keep the bears from stealing our cash! 🛡️
Note: Dear Thief OGs, this stop loss is my suggestion, but it’s your trade! Adjust based on your risk tolerance and make those profits at your own pace. 💸
🎯 Target: Cash Out Before the Trap!
Profit Target: Aim for the $105.00 level, where the 786-period Simple Moving Average (SMA) acts as strong support. 📈
Why?: This level shows oversold conditions and a potential bear trap. Escape with your profits before the market flips the script! 🏃♂️
Note: Thief OGs, this is my target, but you’re the boss of your trades. Take profits when it feels right for you! 💪
🔗 Related Pairs to Watch
To make the most of this DIS setup, keep an eye on these correlated assets (all in USD):
NASDAQ:NFLX (Netflix): As a competitor in the streaming and entertainment space, Netflix often moves in tandem with DIS. A bearish move in DIS could signal similar pressure in NFLX, especially if market sentiment sours on streaming stocks. 📺
NASDAQ:CMCSA (Comcast): Another media giant with theme park and content exposure. Watch for bearish momentum in CMCSA to confirm broader sector weakness. 🏰
AMEX:SPY (S&P 500 ETF): DIS is a major component of the S&P 500. If the broader market is bearish, it could amplify DIS’s downtrend. Keep SPY on your radar for macro context. 📊
Key Correlation Insight: DIS, NFLX, and CMCSA often react to similar catalysts like consumer spending trends, streaming subscriber growth, or theme park revenue. A bearish move in DIS could be a signal to check these pairs for shorting opportunities or confirmation of sector weakness. 🔍
⚠️ Disclaimer
This Thief Style trading strategy is just for fun and educational purposes! 😜 Trading involves risks, and I’m not a financial advisor. Always do your own research (DYOR) and trade at your own risk. Steal profits, not your peace of mind! 🕵️♂️
✨ “If you find value in my analysis, a 👍 and 🚀 boost is much appreciated — it helps me share more setups with the community!”
Hashtags:#DIS #StockMarket #SwingTrading #DayTrading #Bearish #ThiefStrategy #TechnicalAnalysis #TradingView #StockPicks #CashFlow
Disney: Wave [iv] Still UnfoldingAfter an extended period of sideways trading, Walt Disney has come under renewed pressure, indicating that the low for magenta wave has likely not yet been reached. To better contextualize the recent price action, we have incorporated a blue WXY three-part corrective pattern within this wave, which should continue down to the support level at $108.78. Afterward, the magenta impulse wave is expected to complete turquoise wave 1 above resistance at $124.90. We then anticipate a wave 2 correction, which should bottom out within our long Target Zone between $97.18 and $85.12. On the other hand, our alternative scenario suggests that turquoise wave alt.1 may already be finished. A break below the $108.78 level would confirm this outlook and immediately shift focus to the Target Zone (probability: 40%).

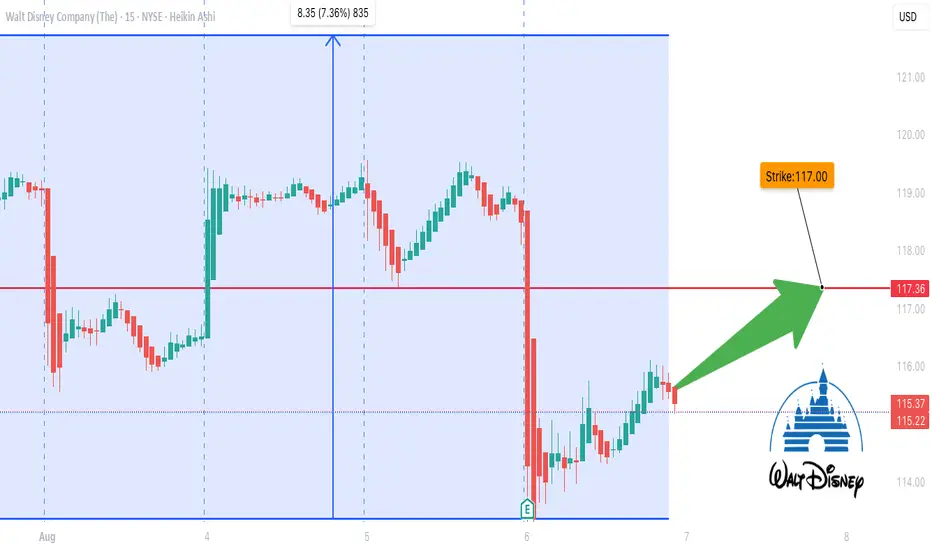
DIS Call Option Loading – $117 Breakout Imminent?## 🎯 DIS Weekly Call Setup – 117C by Friday? Institutions Are Betting Big! 💥
**🧠 Summary of Smart Model Consensus (2025-08-06)**
> ⚖️ *Mixed Momentum, But Bullish Flow Stands Out*
---
### 🔍 5 AI Models – Here's What They're Seeing:
**📈 Grok/xAI:**
✅ *Bullish Weekly Flow* (Call/Put ratio: 2.54)
✅ *Institutional Accumulation* on high volume
⚠️ *Daily RSI still bearish*
⚠️ *High Gamma Risk* – short expiry window
**🔻 Gemini/Google:**
🔻 *Bearish RSI across daily/weekly timeframes*
📉 *Heavy Sell Volume* = Distribution
💬 *Bullish flow might be retail noise*
**🔄 Claude/Anthropic:**
✅ *Oversold RSI* = Possible Relief Rally
✅ *High Call Flow & Favorable Volatility*
⚠️ *Momentum Weak* – proceed cautiously
**📊 LLaMA/Meta:**
⚖️ *Mixed Signals* – leaning Bullish
⚠️ *Gamma Risk* critical with only 2 DTE
📈 *Support/Resistance Levels Must Guide Entry*
**🔻 DeepSeek:**
🔻 *Weak momentum, institutional selling*
⚠️ *Contrarian Bearish Position*
🎯 Targets breakdown support
---
### 🧠 Model Consensus:
💡 *Mixed Signals* → **Cautious Bullish Bias**
✅ *Institutional Flow + Oversold RSI*
⚠️ *Gamma + RSI Risk = Manage Entry & Exit Tightly*
---
## 📈 Recommended Trade Setup:
| 🔧 | DETAILS |
| ---------------- | --------------------------- |
| 🎯 Instrument | `DIS` |
| 🎯 Direction | **CALL (LONG)** |
| 💰 Entry Price | **\$0.72** |
| 📌 Strike | **\$117.00** |
| 📅 Expiry | **Aug 8, 2025 (2 DTE)** |
| 🎯 Profit Target | \$1.25 – \$1.80 *(75–150%)* |
| 🛑 Stop Loss | \$0.36 *(50% premium)* |
| 📈 Confidence | **65%** |
| ⏰ Entry | **At Market Open** |
---
### ⚠️ Key Risks:
* 🧨 **Gamma Risk:** Volatility can cause price to explode or implode quickly
* 📉 **Bearish RSI trend** still in play – this is a **speculative short-term trade**
* 🎢 Only **2 Days to Expiry** — manage actively
---
### 🧠 Final Thoughts:
This is a **tactical high-upside, short-dated bet** on a potential bounce in \$DIS. Institutions are positioning early — retail might be late to this move. Risk tightly, but reward could be explosive.
---
**📌 TradingView Hashtags:**
`#DIS #OptionsAlert #WeeklyOptions #CallOptions #GammaSqueeze #UnusualOptionsActivity #TradingStrategy #SmartMoney #TechnicalAnalysis #SwingTrade #HighRiskHighReward #BullishFlow`
Disney Stock Pops on Strong Earnings Data. Turnaround Working?The Magic Kingdom just pulled a rabbit out of its hat — and Wall Street’s loving it.
Disney stock NYSE:DIS surged 11% on Wednesday, not just for its best day in a year, but for the kind of earnings beat that makes analysts reconsider their entire valuation model while retail traders tweet “ NYSE:DIS to the moon.”
Is the House of Mouse finally finding its footing? Just a day ago, Disney shares were languishing 60% below their 2021 record. Let’s break it down.
♫ Earnings That Deserve Their Own Theme Song
Starting with the headline: adjusted earnings per share clocked in at $1.45 , stomping the $1.20 consensus estimate. Revenue came in at $23.62 billion, a 7% jump from last year’s earnings performance and another beat that sent traders racing for their mouse ears.
After a year of streaming skepticism, cost-cutting, and investor hand-wringing over whether Bob Iger’s encore CEO tour could work magic, this quarter delivered. Bigly.
💪 Streaming Had No Business Going That Hard — But It Did
Wall Street was braced for a Disney+ subscriber drop. Instead, the company added 1.4 million new subscribers to 126 million, easily topping expectations of 123 million.
Not only are people still subscribing despite price hikes, but the direct-to-consumer segment (Disney+, Hulu, ESPN+) posted revenue growth of 8% to $6.12 billion, powered by both higher prices and surprise stickiness. Operating profit in streaming? A cool $336 million, up from $47 million a year ago.
Disney even raised its full-year adjusted EPS guidance to $5.75, a 16% gain from fiscal 2024 — a confident flex in a market where most companies are still managing expectations with surgical pessimism.
⏫ Mickey’s New Best Friend: Margin Expansion
It wasn’t just top-line fireworks — the net income boom was one for the books: $3.28 billion in profits, compared to a $20 million loss a year ago.
Operating margins in streaming are on the rise. Profitability, once seen as an elusive dream for all the big streaming platforms, is suddenly in sight. Disney is guiding toward $875 million in streaming profit for this fiscal year — and based on this quarter, that may end up conservative.
🎡 Parks Still Pay the Bills — With a Sprinkle of Magic
Now let’s talk about the real engine behind Disney’s machine: the parks and experiences division.
Domestic parks posted a 13% profit increase, powered by higher visitor spending and the launch of a shiny new cruise ship.
That’s important in an economy where every other headline screams “recession imminent.” Disney’s park guests are ignoring macro headwinds and enjoying the fantasy — and that’s music to shareholders’ ears.
Worried about tariffs? Sure, but they haven’t shown up on Disney’s balance sheet just yet. And until they do, Disney’s parks remain a cash printer with castles.
🏟️ A Park in Abu Dhabi — Why It May Be Big
Tucked in among the streaming buzz and EPS upgrade was something that made global investors raise an eyebrow: a new Disney theme park in Abu Dhabi.
On the surface, this sounds like a headline for 2031. And sure, it’ll take a few years to plan and build, and a few more to create the commemorative popcorn bucket. But long-term investors should pay attention.
Abu Dhabi isn’t just a tourist destination — it’s a capital backed by one of the world’s largest sovereign wealth funds and a keen interest in diversifying the revenue streams beyond oil. A Disney park there isn’t just another expansion — it’s a geopolitical bet on premium travel.
As Iger put it, it may seem modest now, but it’s quietly huge for the brand’s future footprint.
👀 What’s Behind the Magic? And Can It Last?
So the big question: is this a one-time sugar rush, or the start of a sustained turnaround?
There are reasons to be optimistic. Disney's streaming growth looks increasingly sustainable. Its content pipeline (including ESPN's evolving digital presence) is improving. The parks continue to defy economic gravity. And Iger seems to be rebalancing the business with a more profitable, investor-friendly mix.
But let’s not forget: content costs are still high, competition in streaming hasn’t gone anywhere, and park margins may come under pressure if consumer sentiment shifts. The macro backdrop remains complicated, and even Mickey can't outwit the Fed forever.
Still, this quarter wasn’t just “less bad than feared.” It was actually good — and that's a narrative shift that could power momentum.
🐭 The Mouse Still Got It
Disney’s earnings report, delivered in the heat of the earnings calendar , could be interpreted as a signal that the entertainment giant isn’t just navigating the new entertainment landscape — it might actually be mastering it.
And in a market starved for upside surprises, Disney just reminded investors that storytelling is its business — and this one’s finally got a happy twist.
The question now is whether traders and long-term holders believe in the next chapter. For now, with the stock back above $102 and the Magic Kingdom delivering financial magic, the bulls are back in the castle.
Your turn: Are you buying into Disney’s turnaround? Holding for the next golden age? Or still side-eyeing that subscriber chart? Let’s hear your play on NYSE:DIS below.

Disney: Recovery?!Disney appears to have stabilized after its recent sell-off, holding above the $106.26 support level. From here, the price should push beyond the $123.74 resistance during the turquoise wave 3. However, if it drops below $106.26 (41% probable), it will trigger our alternative scenario, signaling a move into our blue Target Zone between $97.27 and $91.46. After the wave alt.(ii) low in that range, the stock would quickly resume its upward trajectory.

Disney is repeating previous head-shoulders reversal pattern?
My answer for the topic is yes.
Disney has broken above the downtrend line, and formed a bullish head-shoulders reversal pattern, exactly repeating the previous price action in Oct 2023.
Now it moves in a bullish channel.
personally, in a short-term, I will take the nearest resistance level (high volume area) as the target for this rally.
what's your opinion?

75: Disney Stock Analysis and Outlook with Levels and ScenariosDisney has been experiencing mixed results in its recent earnings, reflecting both strong progress in streaming profitability and ongoing challenges in its theme park operations. The stock is now approaching a crucial zone between $80 to $90, which is a point of interest for potential reversal. Here's a breakdown of possible scenarios:
Bullish Scenario :
If Disney can hold and reverse in the $80-$90 zone, we could see a rebound driven by continued strength in streaming, especially if fundamentals improve further. The company’s recent milestone of achieving profitability in streaming earlier than expected is a positive indicator. If Disney can sustain and build on this, combined with strategic investments in new content and attractions, the stock may attract buyers and see a move back towards higher resistance levels.
Bearish Scenario :
However, if Disney fails to hold this key $80-$90 support zone, we could see the price move lower, with the next areas of interest at $65 and potentially $50. The theme parks’ underperformance and increasing operational costs are key risks. If these challenges persist without a significant recovery in fundamentals, particularly in visitor numbers or cost management, further downside pressure on the stock is likely.
Technical Outlook:
- Support Levels: $80-$90 (Key zone), $65, $50
- Resistance Levels: $111, $145
The upcoming price action in the $80-$90 zone will be critical in determining the next major move for $DIS. Keeping an eye on both the technical levels and fundamental developments will be crucial for making informed trading decisions.

DISNEYI felt the need to look into this particular stock since they're not only burning through cash, but they're also losing it by loyal customers jumping ship.
My analysis is hopeful thinking, but anything is possible nowadays. 🤷🏿♂️

Disney: Sitting on EdgeDisney is currently sitting on the upper edge of our magenta Target Zone (coordinates: $101.24 – $88.36). We anticipate a bullish trend reversal out of this Zone, but primarily, we still think wave (2) must dive a little deeper into this price range before the trend reversal can be initiated. However, there is a 35% chance that wave alt.(2) has bottomed out already, which will be confirmed if the resistance at $110.62 is surpassed.

DISNEY Revisiting a 10 year Support LineThis Technical Analysis is on Disney (DIS), on the 2 Week timeframe.
Our Current Price action is TESTING SUPPORT on this MASSIVE Decade Long SUPPORT LINE.
The 1st time we have ever tested SUPPORT on this was September 29th, 2014.
Highlighted by the RED circles, everytime we've tested this we've had some sort of Price Bounce.
The Most massive gains were from the Bottom of the COVID Crash to the TOP @ approx. $202.00
A Gain of about 154%.
It was also a more evident time to buy as the RSI gave hints along with some other indicators.
Another one being the GOLDEN CROSS where 2 week 21 EMA CROSSED Above 2 week 50 SMA .
Whats happening now?
Currently our 2 week candle, has not yet closed. It will do so August 14th. We will give more clues then. If we maintain support thats GOOD, If we see ourselves below it, and CONFIRM BELOW that would be VERY BAD. This would mean we have broken a 10 year SUPPORT LINE.
We have also had a DEATH CROSS, which is when 21 EMA CROSS below the 50 SMA. This often times causes price to fall as we've recently seen. The moving averages currently seems like there pointing downwards, indicating that price can still drop more.
I would like to see the Moving Averages to flatten out at 180 degrees. To have this happen price needs to bounce from here.
Price is also currently in a downward channel.NOTE how the lower trend line of the channel is below the MAJOR RESISTANCE.
It can be possible that we test this.
Notice the BLACK ARROWS on the RSI and MACD. If you relate them to the lower trend line of the downward channel on Price action. This shows a BULLISH DIVERGENCE. Which is a sign of potential BULLISH MOVE UP.
Bullish Divergence = When Price action shows LOWER LOWS but the indicators show HIGHER LOWS. Usually means price is lagging behind the indicators and eventually PRICE will increase to catch up to the indicators. In normal instances, price moves in sync with indicators.
If PRICE moves BELOW the SUPPORT, its possible we touch this area indicated by the BLACK ARROW, which coincides with the horizontal black line that touches the previous candle wicks. This would put the BULLISH DIVERGENCE at play. Look to see in the upcoming weeks what happens.
Some danger signs are seen in the indicators:
RSI -> Currently our ORANGE RSI Line as moved below the BLACK Moving Average. If you look left it has always been associated with price drops. If we continue to stay below, risk of price drop remains.
MACD-> Notice how the size of the GREEN histograms have been decreasing, indicating a slow down on MOMENTUM. If we don't see bigger GREEN histograms print, next likely thing is the appearrance of RED Histograms which will indicate increased probability of PRICE going down.
ADX -> Highlighted zone shows RED LINE above GREEN. This indicates that bearish momentum is present. As long as RED line is ABOVE GREEN, likelyhood of bearish momentum and price falling is probable.
CONCLUSION:
Disney has reached the CRITICAL SUPPORT line for the 5th time in the 10 year history of this SUPPORT LINE. Everytime when it did so as seen in previous history, its been known to be decent area to BUY. Is it a good area to buy? In my opinion its hard to tell in this moment. For one, we should wait till the close of this CURRENT 2 week candle on the 14th of August. Something to note, everytime we test a trendline, support or resistance, each time it gets weaker. Keeping this in mind, with the warning signs in the indicators and a potential BULLISH DIVERGENCE, a scenario that can be possible: we break it, to test the lower trend line of the Downward channel, only to have prices MOVE BACK UP. But its important to state that this doesn't have to happen either. We need to be patient and observe what is to come in the coming weeks. Zooming into the smaller timeframes, can also give more concrete short-term clues on direction. Stay tuned for updates on other timeframes.
Thank you for your time! Please do support this idea and my work by boosting, following and commenting. Follow for updates and ideas on other trade-ables.
If you have any questions do reach out. Thank you again.
DISCLAIMER: This is not financial advice, i am not a financial advisor. The thoughts expressed in the posts are my opinion and for educational purposes. When trading always spend majority of your time on risk management strategy.

Disney stock has maintained strong support in the past 10 weeksDisney's stock has maintained strong support levels in the past 10 weeks
This chart shows the weekly candle chart of Disney stocks from the end of 2019 to the present. The graph overlays the bottom to top golden section at the beginning of 2020. As shown in the figure, Disney's stock has maintained strong support levels in the past 10 weeks, with inter district fluctuations above the golden section's 0.236 level! Once Disney stocks close below this strong support level for three consecutive trading days, the downside space opens up and it is likely to fall below the low point of early 2020!

Disney stocks are now emerging from a weak triangular !Disney stocks are now emerging from a weak triangular oscillation pattern!
This chart shows the weekly candle chart of Disney stocks from the end of 2019 to the present. The graph overlays the bottom to top golden section of 2020. As shown in the figure, Disney stocks fell unilaterally after completing the head and shoulder positions from March to September 2021! In the past year, Disney's stock market has shown a relatively low large triangle consolidation pattern, with bulls powerless! For a period of time in the future, just use the lowest point in 2020 as the watershed to determine the strength of Disney stocks, above it, slightly strong, and below it, slightly weak!

Disney: Fairy Tale Forest 🌲🌳🪄Disney is currently strolling through the dark green fairy tale forest between $103.29 and $88.41, where it should soon finish wave 2 in dark green. Afterward, the share should be enchanted enough to conjure a convincing upwards movement above the resistance at $122.50. There is a 38% chance, though, for Disney to leave the forest on the southern side, dropping below the support at $84.07. In that case, the course would develop a new low in the form of wave alt.II in light green first before starting the ascent.

DIS - Price Targets & Stop Loss📈 What’s up investors! 📉
Welcome back to another one of
💡“Mike’s Ideas”.💡
I post as I find signals… these signals are based on the personal rules I have built and follow in order to make up what I call the “SST Strategy”. Follow for more ideas in the future!!
I have 4 levels marked and colour coded on the Chart.
These levels are:
⚪ White = Entry Point
🔴 Red = Stop Loss
🟢 Green = 1.2:1 Risk Reward Ratio
🟡 Yellow = 1.5:1 Risk Reward Ratio
🔵 Blue = 2:1 Risk Reward Ratio
👀 So what are we looking at today…!!!
🚨( DIS ) The Walt Disney Company🚨
The Walt Disney Company, together with its subsidiaries, operates as an entertainment company worldwide. It operates through two segments, Disney Media and Entertainment Distribution; and Disney Parks, Experiences and Products. The company engages in the film and episodic television content production and distribution activities, as well as operates television networks under the ABC, Disney, ESPN, Freeform, FX, Fox, National Geographic, and Star brands; and studios that produces films under the Walt Disney Pictures, Twentieth Century Studios, Marvel, Lucasfilm, Pixar, and Searchlight Pictures banners. It also offers direct-to-consumer streaming services through Disney+, Disney+ Hotstar, ESPN+, Hulu, and Star+; sale/licensing of film and television content to third-party television and subscription video-on-demand services; theatrical, home entertainment, and music distribution services; staging and licensing of live entertainment events; and post-production services by Industrial Light & Magic and Skywalker Sound. In addition, the company operates theme parks and resorts, such as Walt Disney World Resort in Florida; Disneyland Resort in California; Disneyland Paris; Hong Kong Disneyland Resort; and Shanghai Disney Resort; Disney Cruise Line, Disney Vacation Club, National Geographic Expeditions, and Adventures by Disney, as well as Aulani, a Disney resort and spa in Hawaii. Further, it licenses its intellectual property to a third party for the operations of the Tokyo Disney Resort; provides consumer products, including licensing of trade names, characters, visual, literary, and other IP for use on merchandise, published materials, and games; operates a direct-to-home satellite distribution platform; sells branded merchandise through retail, online, and wholesale businesses; and develops and publishes books, comic books, and magazines. The Walt Disney Company was founded in 1923 and is based in Burbank, California.

Disney Could be Bottoming TodayHitting trendline support from 1998, hitting a trendline that also marked the March 2020 bottom. Lines up with my outlook that equities, housing and crypto have bottomed if it holds.

DIS Buy signalDisney has come out on top from its competition with Netflix in the movie streaming industry. Q2 was a pleasant surprise for investors of Wall Street, and as the economy is recovering because of the large amounts of capital movement from Europe to the US, Q3 is likely to have a positive uplook. Retaliatory spending by consumers on theme parks and Disney+ subscriptions will push the price of the stock. Strong support at $100-$110, some resistance at $120. Suitable for short term investment. Wall street analysts show a Strong Buy.

DIS Disney Price TargetsTwo weeks ago you could have bough DIS at the October 2020 level. What an opportunity that was, with one year and 4 months gains washed away.
But now they reported a strong Q1 earnings:
earnings of $1.06 per share vs 57 cents in the Zacks consensus
revenues of $21.8 billion vs $21.2 billion analysts expectations
Disney+ subscriber numbers: 129.8 million vs 125.8 million expected. That was somehow to be expected after the NFLX earnings .
Parks, Experiences and Products segment growth of over 100% YoY
My price target is the $159 resistance and, if they continue like that in the second quarter, $175.
Looking forward to read your opinion about it.

$DIS $200 Bound?Great Day trading DIS, hot on my watchlist tomorrow! Leave a like and follow if you dig this content!
