BTC/USDT | Another try before bearish move? (READ THE CAPTION)Good day everyone, Amirali here.
As stated in the previous analysis, BTCUSDT reacted to the supply zone and faced a dropdown and now it is being traded 92,600 level right now. I expect another move to the FVG and seeing how it reacts before making a move. Should it manage to break through the 4H FVG, I expect a move to $96,900, the lower level of daily FVG.
Dogecoin

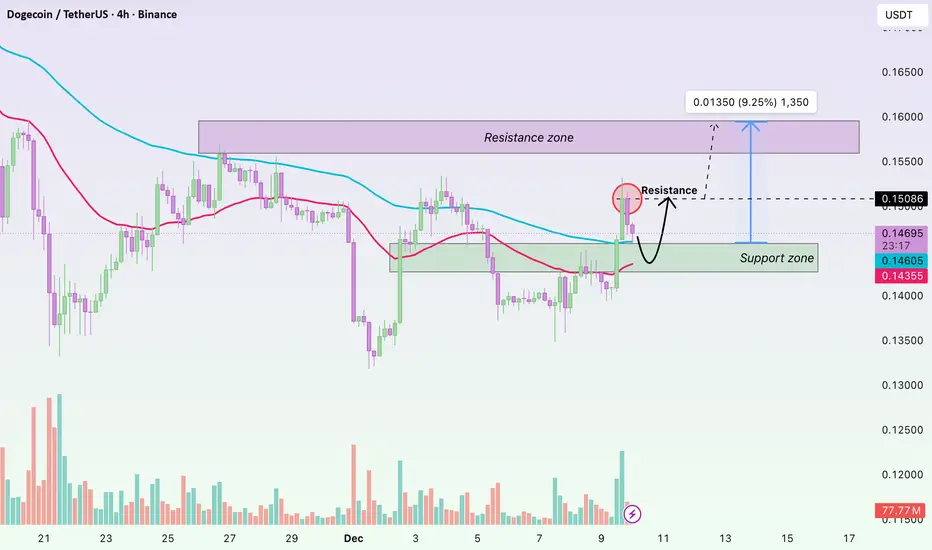
DOGE – Short-Term Breakout: EMA and Volume Support the UptrendHi everyone, Domic here. Dogecoin is showing a strong bullish move after breaking key EMA levels, accompanied by rising volume, indicating that buyers are in control. On the H4 chart, the 34 EMA (red) and 89 EMA (blue) serve as markers of the short-term trend. DOGE moving above both EMAs while forming higher lows suggests a high probability of continued short-term gains. Price is currently approaching the 89 EMA, a key technical resistance, and its reaction around this level will determine the next leg of the uptrend.
Trading volume on December 9 surged, reflecting active buying and support for the breakout from the accumulation zone around $0.146 to above $0.147. This signals that DOGE has the potential to extend its rally, but attention should be paid to its reaction near the $0.150 resistance level.
Currently, the market anticipates a clear breakout above $0.150. Positive sentiment from external factors — such as Elon Musk’s tweets, renewed interest in meme coins, DOGE adoption as a payment method, and expectations of a dovish Fed — is supporting inflows.
Wishing you all a successful trading day!
DOGECOIN markup ... ICC He is an example of bearish icc markup on dogecoin
Indication, correction, contination - icc shout to tradesbysci
Trade responsibly good luck

Dogecoin DOGE price analysis#Dogecoin ( CRYPTOCAP:DOGE ) shows a completed Cup & Handle structure on the OKX:DOGEUSDT chart.
Key observations:
• The memecoin sector is unwinding slower than it expanded
• CRYPTOCAP:DOGE represents more than 50% of total memecoin market cap
• The technical structure suggests two main scenarios:
1️⃣ Minimal target: ~$0.78 (mild breakout / local ATH retest)
2️⃣ Extended target: ~$1.55–1.60 (x10–11 from current levels)
A full move would imply a market cap close to $250B — aggressive, but not impossible under peak liquidity conditions.
Additionally, the same macro pattern may later appear on CRYPTOCAP:ETC and CRYPTOCAP:ADA , which structurally resemble earlier stages of Dogecoin’s formation.
❓ Which scenario do you consider more realistic for CRYPTOCAP:DOGE in the upcoming market phase?
______________
◆ Follow us ❤️ for daily crypto insights & updates!
🚀 Don’t miss out on important market moves
🧠 DYOR | This is not financial advice, just thinking out loud

DOGE near term TARGET $0,34Dogecoin is likely on it's way to more bullish prices.
Since around 22 June, there's been a near "up-only" trend on DOGE, where the price is continuously making higher highs and the corrections are all still higher lows.
In terms of technical indicators, we see strong bullish indication in the weekly timeframe as the price trade above all moving averages:
The daily timeframe's price is trading above the moving averages as well. A good place to watch for SHORT term corrections is the first and second band of the moving averages here:
OKX:DOGEUSDT BINANCE:DOGEUSDT

DOGE – Downtrend Channel + Bearish Head & Shoulders BreakdownDogecoin continues to move inside a large multi-year descending channel, respecting both the upper and lower boundaries. Recently, the chart has formed a clear bearish Head and Shoulders pattern , which has already broken down and is currently playing out.
At this stage, I expect a small relief retest toward the $0.15–$0.175 zone , which corresponds to the broken neckline area. If this retest confirms resistance, DOGE may enter a deeper correction phase.
The main downside target lies at the $0.04–$0.03 zone , aligned with the lower boundary of the long-term descending channel.
From this area, I expect the beginning of a new bullish cycle for DOGE, potentially initiating a macro trend reversal.
Future bullish targets:
$0.80–$1.00
$1.70–$2.20

BTC/USDT | Another run over 100K? (READ THE CAPTION!)By analysing the 4H BTCUSDT chart, we can see that a fall into the FVG and dropping all the way too $87700, it has reacted positively and is now being traded at $91700!
We shall see if BTC manages to go through the daily FVG, which is the $96900-$98000 zone. If BTC goes over than zone, another run to over $100K is possible!
This analysis will be updated!

DOGE/USDT — Kijun Breakout Setup ► Bullish Swing Opportunity**📌 DOGE/USDT “DOGECOIN VS TETHER”
Crypto Market Opportunity Blueprint (Swing Trade)**
🟢 PLAN
Bullish plan activated but pending order — waiting for a clean Kijun Moving Average breakout.
This setup focuses on momentum shift + trend confirmation before entering aggressively.
🎯 ENTRY LEVEL
You can enter at any price level after the Kijun breakout @ 0.15100.
This protects you from premature entries and avoids fakeouts before trend confirmation.
🛡️ STOP-LOSS
This is Thief SL → 0.14400
Dear Ladies & Gentlemen (Thief OG’s), adjust your SL based on your strategy & your own risk.
Place SL only after the breakout confirmation, not before.
Reminder: This SL is not a mandatory one. You choose your risk. You make the money, then take the money at your rules.
🎯 TARGET
Moving Averages show strong resistance, price is near overbought zones, and potential trap zones exist — so book profits with discipline.
Our target → 0.16200
Again: This TP is optional. Use your personal exit plan based on market momentum and your risk tolerance.
📡 Related Pairs to Watch (Correlation & Key Points)
Tracking correlated pairs strengthens accuracy. Here are the most relevant:
1. BINANCE:BTCUSDT
Key Correlation:
DOGE follows BTC’s overall direction 70–80% of the time during swing phases.
A BTC breakout above major MAs often fuels memecoin rallies.
Watch for: BTC holding above its Kijun / 1H–4H cloud.
2. BINANCE:ETHUSDT
Key Correlation:
ETH strength = stronger altcoin liquidity rotation.
If ETH breaks resistance, capital flows into major alts → then into meme assets like DOGE.
Watch for: ETH bullish continuation patterns.
3. BINANCE:SHIBUSDT
Key Correlation:
Direct memecoin sector sentiment indicator.
SHIB pump = DOGE usually reacts next with lag.
Watch for: SHIB Kijun breakout or sudden volume burst.
4. BINANCE:PEPEUSDT
Key Correlation:
New-age meme liquidity leader; often front-runs meme sector volatility.
PEPE volatility spikes are usually early warning signals for DOGE momentum.
Watch for: Volume expansion + breakout candles.
5. BINANCE:LTCUSDT (Secondary correlation)
Why:
LTC acts as a secondary liquidity indicator for old-generation altcoins.
When LTC moves with speed, DOGE tends to follow in the same risk-on window.
Watch for: LTC strength above its 200 MA.
📌 Final Note
Track DOGE’s Kijun breakout, manage risk with discipline, and monitor correlated assets to stay in sync with sector momentum. This keeps your swing strategy clean, controlled, and data-driven.

This is my last hope for Dogecoin !!This is my last hope for Dogecoin. If this support is lost and the descending triangle pattern proves valid and the price follows it, Dogecoin will fall below 10 cents for a long time. But since the crypto market often breaks rules and patterns, maybe this time it will reverse again and, after breaking the triangle, push the price back above 17 cents.
What do you think will happen? Leave a comment !
ETH/USDT | The Market Is Back ? More Bullish Move Ahead?CRYPTOCAP:ETH reacted perfectly to the 2100 to 2600 demand zone and the move played out exactly as expected. After the pullback the buyers stepped in and pushed the price all the way to 3150 and right now Ethereum is trading around 3100. The broader bullish setup is still valid and as long as ETH stays above the main demand area the bigger targets at 3200 and 3500 remain on the table. For now I’m watching to see if momentum continues to build from this recovery.
Please support me with your likes and comments to motivate me to share more analysis with you and share your opinion about the possible trend of this chart with me !
Best Regards , Arman Shaban

BTC/USDT | $BTC Smashes Back to 94K but The Real Test Is Ahead!CRYPTOCAP:BTC pulled a full reversal after the heavy crash and pushed all the way back to 94K. Right now price is trading around 93K and this entire move basically filled the liquidity void created during the violent dump. For short term traders this is where I prefer staying on the sidelines because premium entries will show up again at lower levels once the market cools down.
For long term traders and holders nothing has changed. The bullish structure is still alive and if Bitcoin can break above 97K the next upside leg can easily extend toward 105K and even 106K. I will update the view again once we see how price behaves around the 97K zone.
Please support me with your likes and comments to motivate me to share more analysis with you and share your opinion about the possible trend of this chart with me !
Best Regards , Arman Shaban

BTC/USDT | The real test ahead! (READ THE CAPTION)Hello everyone, back with another analysis, this time on BTC.
By examining the daily chart of BTC, we can see that bitcoin has been boosted up after hitting the demand zone and is currently being traded in 93K zone. I expect a rise to 97k-98k FVG zone, if BTC manages to go past through this zone, a rise to 104K could be possible. Should it fail to go past 98K, another drop to 81K is likely to happen.

#DOGE/USDT - Only One Scenario Left: UP#DOGE
The price is moving in a descending channel on the 1-hour timeframe. It has reached the lower boundary and is heading towards breaking above it, with a retest of the upper boundary expected.
We have a downtrend on the RSI indicator, which has reached near the lower boundary, and an upward rebound is expected.
There is a key support zone in green at 0.1470. The price has bounced from this zone multiple times and is expected to bounce again.
We have a trend towards consolidation above the 100-period moving average, as we are moving close to it, which supports the upward movement.
Entry price: 0.1490
First target: 0.1500
Second target: 0.1522
Third target: 0.1550
Don't forget a simple principle: money management.
Place your stop-loss order below the support zone in green.
For any questions, please leave a comment.
Thank you.

DOGE — WEEK 49 TREND REPORTBINANCE:DOGEUSDT — WEEK 49 TREND REPORT
Ticker: BINANCE:DOGEUSDT — 12/03/2025 @ 0.15$
Timeframe: WEEKLY
This is a reactive structural classification of CRYPTOCAP:DOGE based on the weekly chart as of this timestamp. Price conditions are evaluated as they stand — nothing here is predictive or forward-assumptive.
⸻
1) Current Trend Condition
• Trend Duration: +7 weeks (Bearish)
• Trend Reversal Level (Bullish): .018$
• Trend Reversal Level (Bullish Confirmation): 0.20$
• Structural Support: 0.28$
⸻
2) Structure Health
• Retracement Phase:
Breakdown (establishing price beneath 38.2%)
• Position Status:
Unstable (price below both structural layers)
⸻
3) Temperature :
Cooling Phase
⸻
4) Momentum :
Bearish
⸻
Author’s Note
This analysis is fully reactive, not predictive. Market conditions, trend structure, and behavior are classified as they appear in real time. The objective is to identify where directional shifts first occurred, where structural integrity remains intact, and where it would begin to weaken if key levels were breached.
Predictive analysis projects outcomes that do not exist yet. Without price confirmation, prediction is built on baseless assumptions. This framework avoids that entirely by responding only to verified structural changes and live conditions.
The levels shown simply identify where the current trend structure first shifted and where it would begin to lose integrity if breached. Recognizing these boundaries allows for clearer interpretation of market behavior without relying on forward guarantees, speculative projections, or unsupported assumptions.
⸻
Methodology Overview
This classification framework evaluates directional conditions using internal trend-interpretation logic that references price behavior relative to its structural layers. These relationships are used to identify when price movement aligns with the framework’s criteria for directional phases, transition points, or regime shifts. Visual elements or structural labels reflect these internal interpretations, rather than explicit trading signals or preset indicator crossovers. This framework is observational only and does not imply future outcomes.

DOGE 4H – Trendline + EMA Rejection, Liquidity Below?DOGE is reacting cleanly to a multi-factor resistance cluster: the descending trendline, the 50 EMA, and the 100 EMA all converge at the same price level. This area has rejected every retest during the downtrend, and today’s wick into the circle shows the same behavior.
Stoch RSI is extended into overbought territory, adding momentum exhaustion to the setup. Below, the $0.136 level remains the key liquidity draw from previous lows — and price has not fully tapped into that zone since the last sweep.
For bulls to regain control, DOGE must break and hold above the EMA cluster and trendline. Until then, the structure favors a continuation move toward lower liquidity levels.

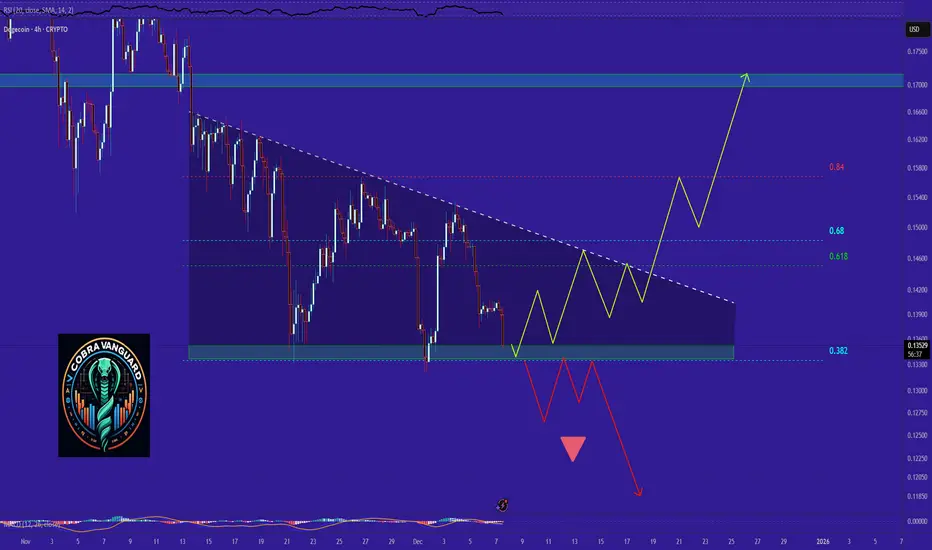
The doge is not dead yetThe ASO indicator on the chart looks like it’s repeating the same pattern we saw in 2021. Nothing is certain, but if we start December in the green and break out of this falling wedge and resistance wall, we could enter a larger range. The next move would likely target the upper zone around $0.208–$0.239.
If we fail to hold the current level next week and start below $0.141–$0.139, it’s very likely that the price will drop to a new low, somewhere around $0.065-0.070. That would mean a longer recovery period for Dogecoin to regain structure and rebuild confidence for new FOMO.
We’re in a phase of heavy fear right now, but this trend can reverse extremely quickly and turn into a bull run with maximum FOMO utilization.
good luck.

DOGE/USDT : BUY MARKETHello friends
Well, considering the decline we had, you can see that the price has been well supported by buyers, which has caused the price to increase slightly.
Now it seems that given the good fundamental news on the Dodge and the ascending channel it has created, it can grow.
There is also an important resistance ahead, which if broken, could see the number 19 cents.
This analysis is purely from a technical perspective and is not a buy or sell recommendation. Avoid emotional behavior.
Trade safely with us

DOGE is meme legend Here we have a slightly different angle of view on Dogecoin with ASO.
We can see that ASO is very accurate in this setting on Dogecoin and does exactly what we want — it always signals a shift, an exchange of momentum.
We cannot fully estimate what lows or highs the price will hit or reach, but it helps us a lot to see that now, based on history, it is literally “the worst is behind us”, and a dead phase is coming.
Yes, we can see that the price could still drop a bit lower and revisit the $0.09–$0.10 area. That is very likely.
But the red curve on ASO — together with the price of Dogecoin — has always experienced the biggest fall exactly when the curve started to break upward from the bottom, meaning the red line rises and the blue line falls.
See you soon, good luck. Don’t give up.
This is the kind of momentum where some memes may be forgotten, but the stronger coins will survive.
Maybe we are already at the bottom maybe the bottom is not far from reality.

DOGE forever I’ve saved this chart, and I won’t forget it. In my view, the market is moving inside an ASO parabola, which follows a repeating rhythm of roughly 500 days in a red phase and about 500 days in a green phase. This structure reflects the long accumulation period followed by the explosive growth that has defined previous cycles.
This ASO model makes sense when you look at how DOGE and the broader altcoin market behave over many years. The market tends to fall into deep, quiet zones where sentiment is cold and volatility is low, and then it suddenly shifts into a strong bullish phase without warning. The pattern repeats with almost mechanical precision.
Right now, the chart fits perfectly into the “red phase” of the ASO cycle a period of pressure building beneath the surface. When the transition into the green phase arrives, it usually happens fast and catches most people off guard. That’s why the long-term projection from this structure doesn’t feel unrealistic, it is simply the continuation of a cycle that has been repeating consistently for nearly a decade.
I think a miracle would have to happen for everything to turn around quickly, more likely a miracle will happen in 2026-2028
good luck, thanks

DOGEUSDT /// 30NOVThe sharp market decline on Friday, October 10th led to a significant drop of approximately 63% in Dogecoin. Currently, the market is retracing part of that daily candle. Price is trading around $0.15, and selling pressure has notably decreased; however, there is still no clear presence of strong buyers to support a sustained upward move.
For Dogecoin to potentially enter a strong bullish phase, price would need to show a sharp reaction and visible inflow of capital around the $0.11 area. A plausible scenario is that the market may reach this level either through another downward leg or after a short-term move toward the $0.18 zone, where it could face renewed selling pressure and move back down toward $0.11.
Overall, price may continue to range between $0.11 and $0.24 for several months. At the moment, there is no technical evidence on this chart suggesting a sharp rally toward the $1 level.

DOGE for the HOlidays?Hello,
This is. Probability map of Doge’s near term future behavior, based on recent “harmonic patterns” or level behavior… at various time frames… scaled to fit the recent levels… dotted are the ceiling, solid the floor ;)
Once we see that a particular pattern is tracking preferential, it can provide a very advantageous look into “future”.
Some times the hardest part is calming the nerves, and just holding position, while waiting for the forecasts to play out.
Doge… good boy!

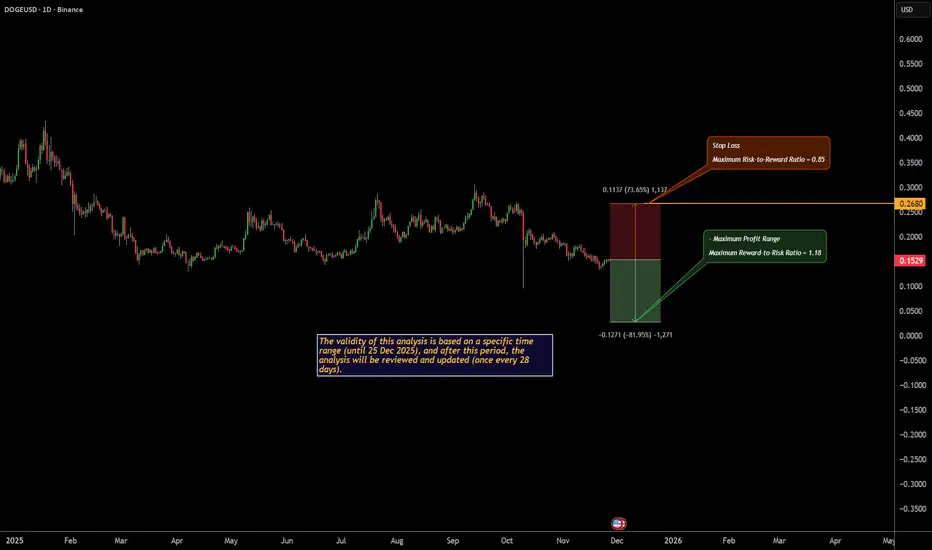
Monthly Crypto Analysis: Dogecoin (DOGEUSD) – Issue 108The analyst expects Dogecoin’s price to decline by the specified end time, based on quantitative analysis.
The take-profit level only highlights the potential price range during this period — it’s optional and not a prediction that the market will necessarily reach it.
You don’t need to go all-in or use leverage to trade wisely.
Allocating just a portion of your funds helps keep overall risk low and ensures a more sustainable approach.
Our strategy is built on institutional portfolio management principles, not the high-risk, all-in trading styles often promoted on social media.
Results are evaluated over the entire analysis period, regardless of whether the take-profit level is reached.
-The validity of this analysis is based on a specific time range (until 25 Dec 2025), and after this period, the analysis will be reviewed and updated (once every 28 days).
DOGE Can it reach $0.20 again before resuming the downtrend?Dogecoin (DOGEUSD) has been trading within a Channel Down since its December 02 2024 weekly High, which turned out to technically be the top of its Bull Cycle.
The latest Lower Low of that pattern was on the October 06 2025 weekly flash crash but since then it retraced back into the 1W MA50 (blue trend-line) - 1W MA200 (orange trend-line) range. The 1W MA200 has been the market's Support throughout the whole 2025. The 1W MA50 typically assumes the role of the long-term Resistance during Bear Cycles.
As a result, we expect a short-term rebound now for Doge, but that should be limited by the 1W MA50. This is also where the 0.618 Fibonacci retracement level is from the October 06 Low, a Fib level where he September 08 2025 Lower High was priced.
Based on that, Doge could target $0.20 (Fib 0.618) and then resume the downtrend on the Channel's new Bearish Leg. If it follows the -7% decreasing rate of the previous Bearish Leg, we can see it bottom after a 59% decline, which should be around $0.085.
Notice also that last week's Low, wasn't only on the 1W MA200 but also on the 1W RSI's Support Zone. A Zone that has been holding since June 05 2023, essentially the major Support of the Bull Cycle, and has provided four perfect buy entries already.
---
** Please LIKE 👍, FOLLOW ✅, SHARE 🙌 and COMMENT ✍ if you enjoy this idea! Also share your ideas and charts in the comments section below! This is best way to keep it relevant, support us, keep the content here free and allow the idea to reach as many people as possible. **
---
💸💸💸💸💸💸
👇 👇 👇 👇 👇 👇
