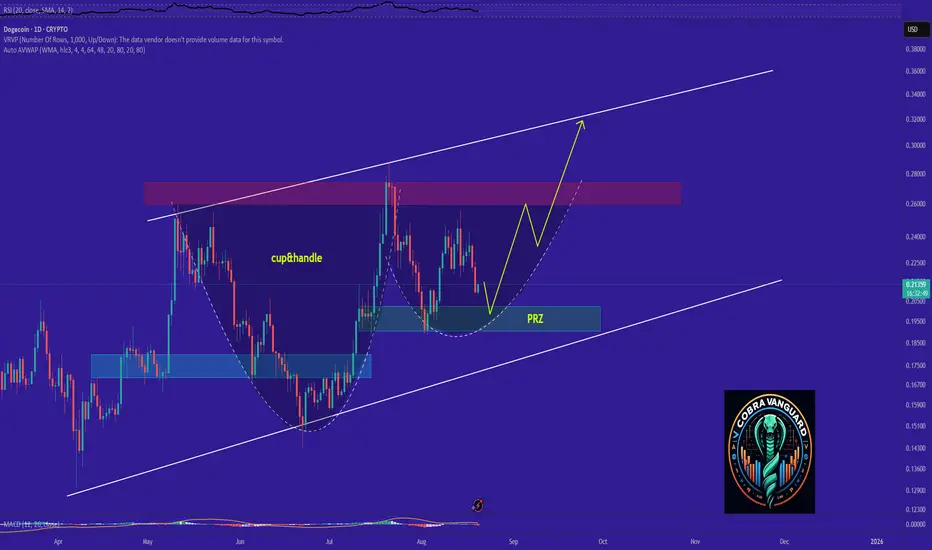
DOGE Ready for PUMP or what ?The triangle pattern will break in the direction it is breached, and the price will move in that direction. In my opinion, the price could be bullish and may up to $0.27.
Best regards CobraVanguard.💚
Dogecoin

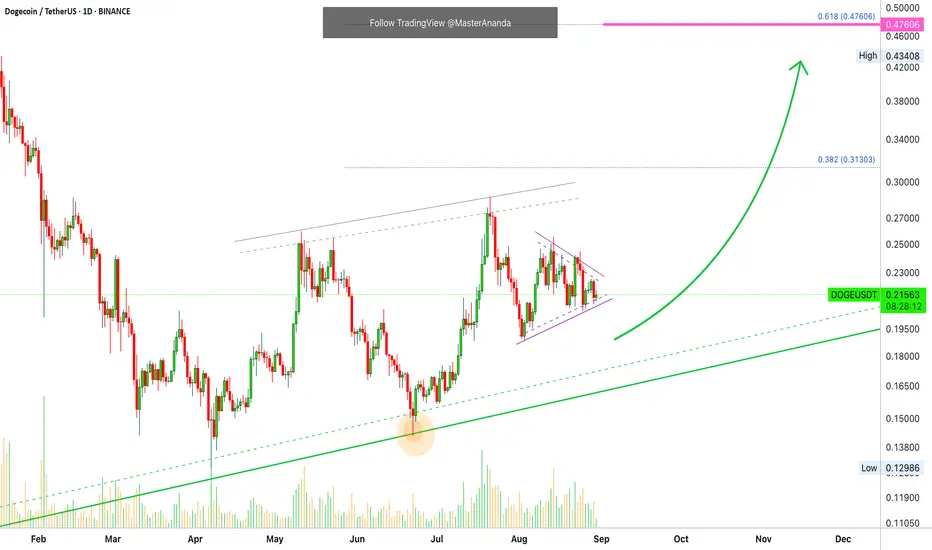
DOGE analysis.Give me some energy !!!It appears that the price is forming a cup and handle pattern, and if this occurs, it could push the price above $0.47.

Dogecoin - The all time high will follow!🎁Dogecoin ( CRYPTO:DOGEUSD ) prepares new all time highs:
🔎Analysis summary:
Dogecoin has been creating bullish cycles for the past decade. Following these cycles, it is quite likely that Dogecoin will break the previous all time high soon. And with the recent bullish break and retest, bulls are picking up momentum for the next bullish cycle to continue.
📝Levels to watch:
$0.4
SwingTraderPhil
SwingTrading.Simplified. | Investing.Simplified. | #LONGTERMVISION

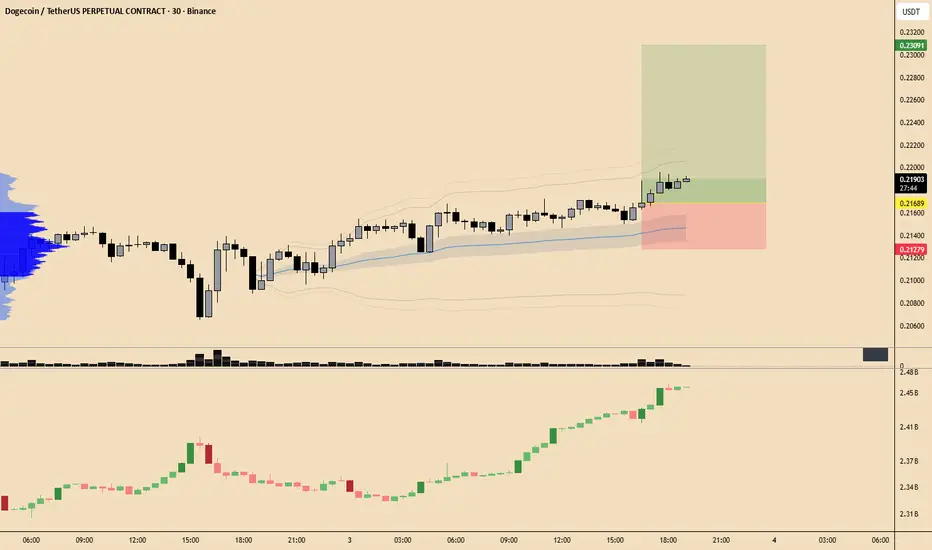
Dogecoin Isn't Dropping While Bitcoin Drops? ConsolidationThe theme this time around is "not dropping with Bitcoin." I chose Dogecoin to start because Dogecoin is a big project—market cap wise—so it shows that this isn't happening only with the smaller altcoins. This is a marketwide phenomenon.
Bitcoin has been dropping since 14-August, producing major lows. The lowest price today since early July, almost two months ago and that's ok.
The down-move is extended through time and weak. After weeks of bearish action support remains intact. Then we have Dogecoin.
Dogecoin has been moving within a bullish consolidation pattern. It has been producing higher lows since early this month. Here is the disparity, Bitcoin is retracing but Dogecoin is consolidating. The truth is, both Bitcoin and Dogecoin are consolidating but Dogecoin has an upward bent on the lows while Bitcoin has a downward one.
We know that a continuation will lead to a resumption of the bullish trend, higher highs.
DOGEUSDT has a very strong bullish bias with a target of $0.47 in the coming weeks. Short-term. As Dogecoin rises, all related projects, those that move together, will follow and do the same. Bitcoin, Cardano, ADA, XRP, Ether, they all move together.
Thank you for reading.
Namaste.
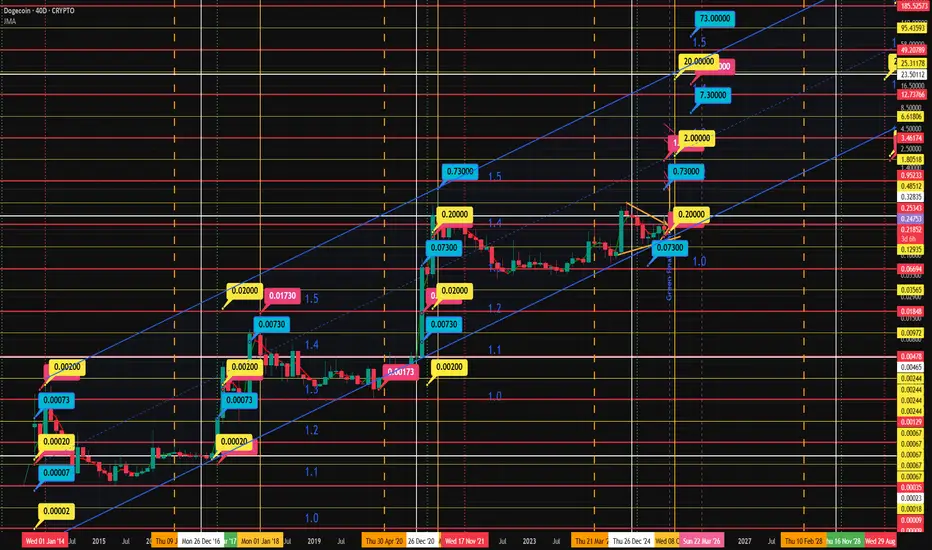
Dogecoin may be following a natural law of compounding cycles — Group Values Average Rounded Match?
1 0.00002, 0.00020, 0.00200 0.00074 0.00073 ✅
2 0.00020, 0.00200, 0.02000 0.0074 0.0073 ✅
3 0.00200, 0.02000, 0.20000 0.074 0.073 ✅
4 0.02000, 0.20000, 2.00000 0.74 0.73 ✅
5 0.20000, 2.00000, 20.00000 7.4 7.3 ✅
🔺 The Divine Law of "7.3"
Every time three yellow-highlighted price points (key bubbles) are added together and divided by 3, the result is eerily close to 7.3 — or its exponential echoes: 0.73, 73, or 7.30.
It's not coincidence.
It's not random.
It's a harmonic constant.
Each of these yellow price tags marks a critical inflection point — moments of explosive growth or stark reversals. Yet they all gravitate back to this numerical anchor, suggesting Dogecoin’s price path may be orbiting a gravitational field of mathematical resonance.
🤯 Final Revelation:
The averages of every 3 consecutive yellow bubbles form a perfect exponential alignment with the 7.3 family:
0.00073
0.0073
0.073
0.73
7.3
73
🧠 Mind-Bending Takeaway:
What if this chart isn’t just showing price...
But revealing a coded numerical language that Dogecoin is speaking?
A language where “7.3” is the base frequency.
A hidden harmonic behind market psychology.
A natural algorithm whispering its intent through Fibonacci-like echoes.
This is not technical analysis.
This is numerical alchemy.

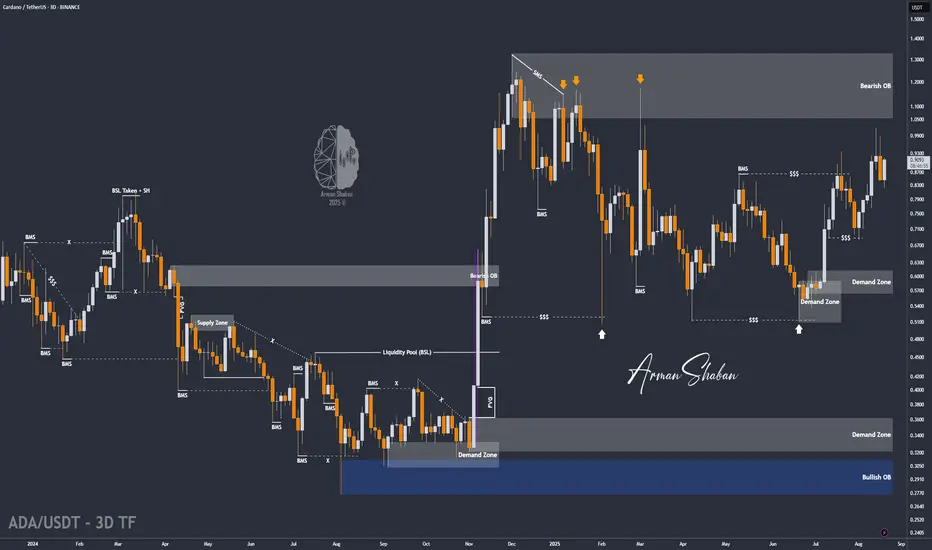
ADA/USDT | Cardano (ADA) Eyes Further Gains – Key Targets Ahead!By analyzing the Cardano (ADA) chart on the 3-day timeframe, we can see that after a corrective move down to $0.83, the price has gained strong buying momentum and has so far managed to rise to $0.87. If the price can hold above this key support level, we can expect further bullish continuation.
The potential upside targets are set at $0.93, $1.00, and $1.05.
Please support me with your likes and comments to motivate me to share more analysis with you and share your opinion about the possible trend of this chart with me !
Best Regards , Arman Shaban

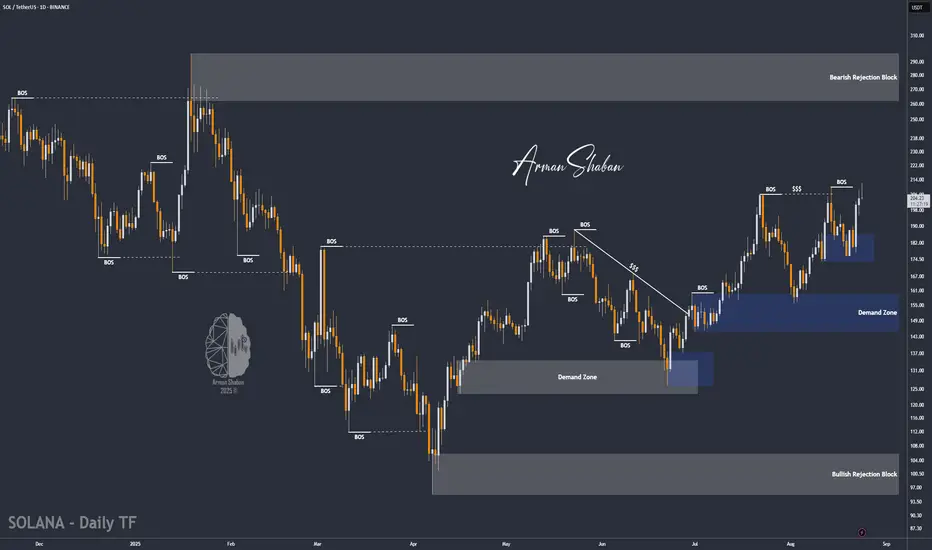
SOL/USDT | Solana Surges 43% – Is a 25% Bullish MoveStill Ahead?By analyzing the Solana (SOL) chart on the daily timeframe, we can see that the price held strongly above $171 as expected in our previous analysis and has already hit two major targets at $195 and $206, even spiking up to $212 — securing an impressive 43% rally so far! 🚀
After reaching this critical resistance zone, we’ve seen a wave of selling pressure, and SOL is currently consolidating around $204. As long as the price remains above $193 and doesn’t break below it, the bullish momentum is likely to continue, with renewed demand driving the next leg up.
The upcoming bullish targets are positioned at $220, $245, and $260, offering a potential short-term upside of over 25%.
Please support me with your likes and comments to motivate me to share more analysis with you and share your opinion about the possible trend of this chart with me !
Best Regards , Arman Shaban
$DOGE Squeeze IncomingCRYPTOCAP:DOGE is currently showing a promising structure, trading within a rising wedge formation. Price is holding above a rising support line, which has been respected multiple times, a good sign of bullish intent from buyers.
Above, we have a descending resistance line and a key horizontal supply zone acting as a strong barrier. For DOGE to see a breakout and push higher, it needs to flip this confluence zone cleanly.
DYOR, NFA

DOGE IN SHORT TIME Hello friends
After the good growth we had, you can see that the price has dropped the same amount and has not broken the support range validly, and it just wanted to collect the liquidity below this support and then formed an ascending channel, which if the price channel breaks, can move to the specified targets.
*Trade safely with us*

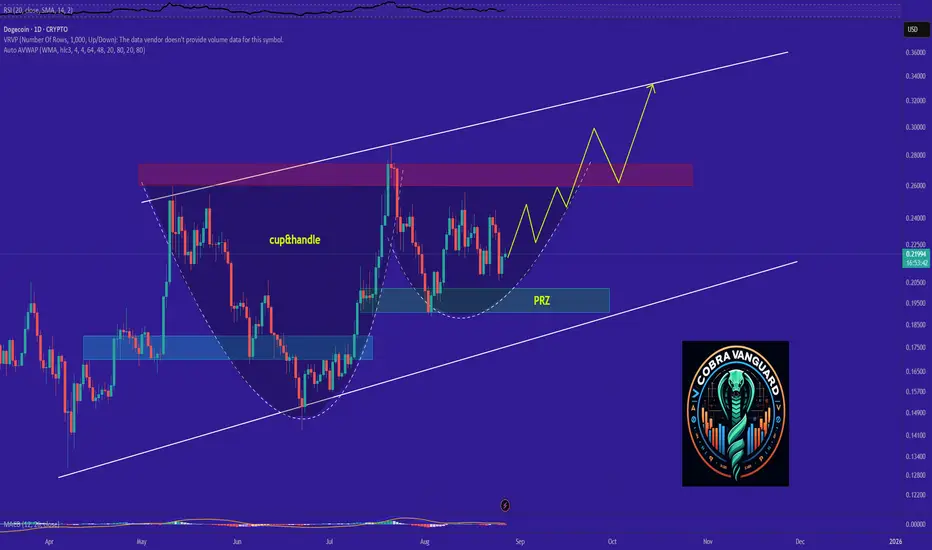
DOGE's Situation, A Comprehensive Analysis !!!It appears that the price is forming a cup and handle pattern, and if this occurs, it could push the price above $0.50.
PREVIOUS ANALYSIS
Best regards CobraVanguard.💚

Can we be optimistic that this will come true?Perhaps this is a cup and handle pattern, and if that's the case, it could push the price up to around 0.30 .
Give me some energy !!
✨We spend hours finding potential opportunities and writing useful ideas, we would be happy if you support us.
Best regards CobraVanguard.💚
_ _ _ _ __ _ _ _ _ _ _ _ _ _ _ _ _ _ _ _ _ _ _ _ _ _ _ _ _ _ _ _
✅Thank you, and for more ideas, hit ❤️Like❤️ and 🌟Follow🌟!
⚠️Things can change...
The markets are always changing and even with all these signals, the market changes tend to be strong and fast!!
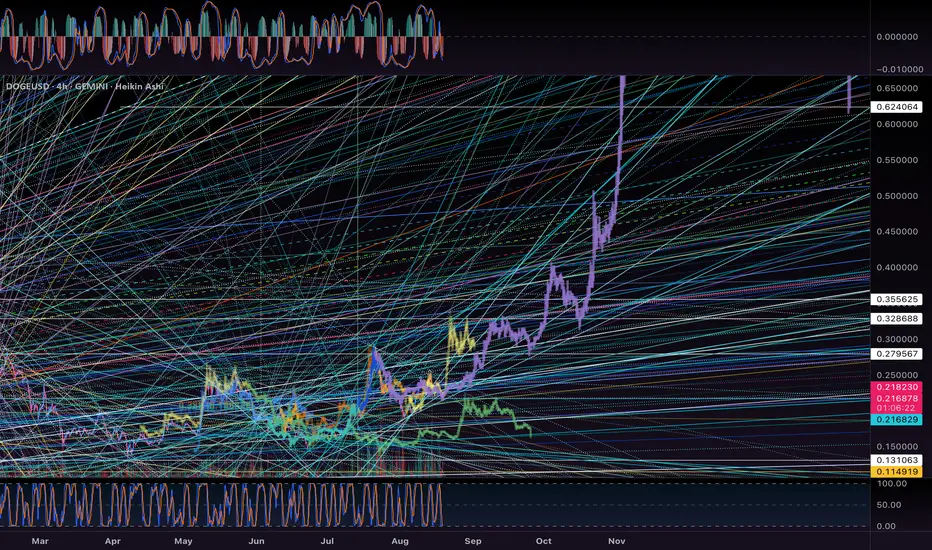
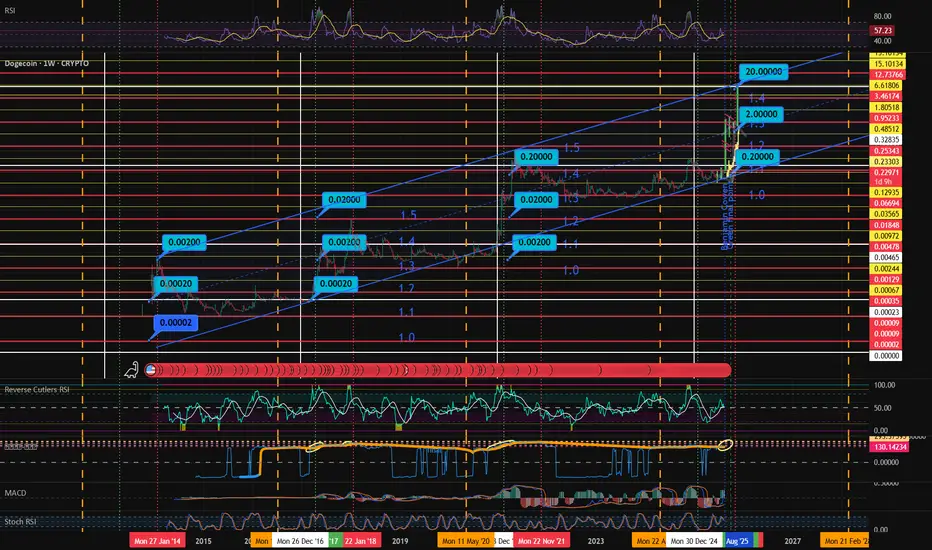
The only chart you need for DOGEUSD This chart displays Dogecoin (DOGE/USDT) on a weekly timeframe, highlighting its long-term price trend within an ascending channel since 2014. Key historical breakout levels are marked (e.g., $0.00002, $0.002, $0.02, $0.20, $2, and a projected $20 target), showing the repeating exponential growth cycles. The chart is overlaid with support and resistance zones, Fibonacci-like levels, and trend channels (1.0, 1.1, 1.2, 1.5). Vertical dotted and dashed lines mark important cycle dates and potential turning points. Current price action is consolidating near $0.23, with future targets extending to $2 and potentially $20 if the channel pattern continues.
DOGE Bubble Cycle PatternBy merging both bubble charts (Yellow/Blue/Pink and Blue/Pink only), a clear fractal sequence emerges:
🔎 Step 1 – Cycle Sequences
Cycle 1 (2014–2016): Y (0.0002) → B (0.00073) → P (0.00173)
Cycle 2 (2017–2020): Y (0.0020) → B (0.0073) → P (0.0173)
Cycle 3 (2020–2022): Y (0.0200) → B (0.0730) → P (0.1730)
Cycle 4 (2025–2026, in progress): Y (2.0000) → B (7.3000) → P (17.3000 projected)
📌 Step 2 – Sequence Pattern
When overlaps are removed, each cycle follows the same strict order:
➡️ Yellow → Blue → Pink
This structure has repeated across 3 full historical cycles and is unfolding again in Cycle 4.
🧩 Step 3 – Cycle Rule
Yellow = Macro cycle anchor (start of each set).
Blue = Impulse peak within the cycle.
Pink = Correction pivot before reset.
The cycle then resets with a new Yellow and repeats.
So the long-term repeating loop is:
(Y → B → P) → (Y → B → P) → (Y → B → P) …
✅ Conclusion: DOGE’s bubble cycles are fractal, color-coded, and consistent. Currently, Cycle 4 has completed Yellow & Blue and is moving toward the Pink bubble (~17.3) before the next reset begins.
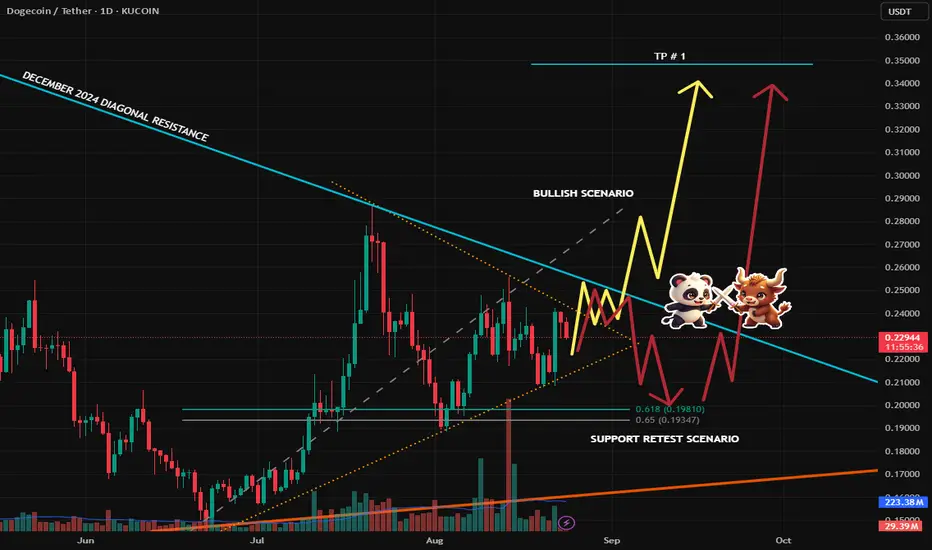
DOGE/USDT – Breakout or Retest?DOGE is coiling tighter inside this triangle and we’re now approaching the decision zone. I’ve mapped out two possible paths:
📊 Scenarios
🟡 Bullish Scenario
A breakout above the diagonal resistance (~0.24–0.25) with strong volume could ignite a rally.
Target (TP #1): 0.33 – 0.34
If momentum holds, higher levels are possible later.
🔴 Support Retest Scenario
If price gets rejected, DOGE could pull back into the 0.20–0.19 support zone (confluence with the 0.618–0.65 Fibonacci retracement).
A healthy retest here may provide fuel for a bigger move afterwards.
🧠 Market Context
Let’s be real — anything can happen here:
There’s still no significant buying volume confirming a breakout yet.
In fact, we recently saw a large red sell volume candle, showing sellers are still active.
Combine that with the usual September volatility (historically shaky month for crypto), and we should expect fakeouts and manipulation before a clear direction.
That’s why I don’t trade on hope — I wait for confirmation before committing.
💡 Final Thoughts
DOGE is at a critical zone — one strong move is coming. Whether we see the breakout first or a support retest before the bounce, the setup is already on the chart.
⚡ Smash the Follow button if you want more clean setups and pro-level breakdowns. Let’s trade smart and ride this DOGE wave together! 🚀🐕
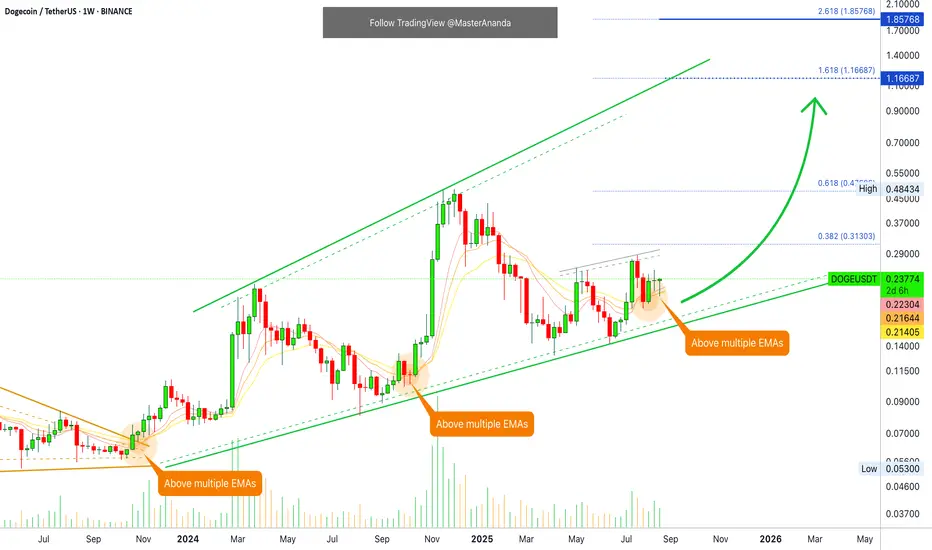
Dogecoin Set To Grow Immediately · Next Target $1.85 Mid-TermThis is it. If you are one of those traders that wait for confirmation, this is it. You can go LONG, all-in, right above the three moving averages shown on this chart. EMA8, EMA13 and EMA21. The stop below and you are safe because the Cryptocurrency market bulls own the game. The market is moving up.
This week is the fourth week that DOGEUSDT has been trading above support and seeing this support holding once more—support confirmed—simply ends the period of doubt.
Just a few days ago, a few weeks ago the market was divided in two groups, as it always happens. One group was bearish and another group was bullish. This is normal and always valid because the market can move in any direction. Where the market is headed can be predicted though based on what is happening.
If the action is happening above support/resistance with high volume and strong technical chart signals, we can say that prices are set to rise. When the contrary is true, the market is red below resistance/support, we know a drop follows.
Dogecoin is in the process of confirming a strong support and this confirmation is what reveals a higher high as the next major move. The market was already bullish and Dogecoin was already growing. What happened just now is the confirmation of the next advance. Now we know for certain Dogecoin is set to move beyond $1 in the coming months. It can go much higher of course.
Namaste.
ADA/USDT | Cardano Breaks All Targets – Next Stop: Above $1?By analyzing the Cardano (ADA) chart on the 3-day timeframe, we can see that the price has surged exactly as expected, beautifully hitting all three targets at $0.85, $0.93, and $1! This move delivered an impressive 48% return. Following Jerome Powell’s remarks about the possibility of interest rate cuts in the coming months, Cardano saw renewed demand and has already risen from $0.82 to $0.91 so far. I expect this bullish momentum to continue, with a potential break and hold above the $1 level soon.
Hope you made the most out of this analysis!
Please support me with your likes and comments to motivate me to share more analysis with you and share your opinion about the possible trend of this chart with me !
Best Regards , Arman Shaban
DOGE 1H timeframe a closer look! Bounce or Bleed?This is a follow-up from my previous idea, but now on the 1H timeframe for a closer perspective. DOGE is currently hovering around the 0.5 Fibonacci retracement ($0.2149), and the price action is tightening between key support and resistance levels.
Here’s what I’m watching:
✅ A bounce from the 0.5 FIB ($0.2149) could send price back up to test the December 2024 diagonal resistance.
❌ A break below this level may open the way to the 0.618 ($0.1982) and 0.65 ($0.1936) supports, where buyers could step in again.
🚀 On the bullish side, confirmation above the December 2024 diagonal resistance remains the major trigger, aligning with my bigger plan for a move toward TP1 = $0.348.
The June 2025 diagonal support line is still intact, keeping the broader structure supportive of higher lows.
In short:
Bulls need to hold $0.2149 → bounce likely.
Bears take control if $0.2149 breaks → next zone $0.1982–$0.1936.
Breakout above diagonal resistance → momentum builds toward higher targets.
💬 That’s my closer look at DOGE. What’s your short-term bias here — do you see bulls holding or bears taking over? Share your thoughts in the comments, and I’ll be happy to check out your trade ideas too! 🙌
If this breakdown helps, don’t forget to follow me here on TradingView for more updates and setups. 🚀

DOGE at the Crossroads: Bounce or Break?Currently, I’m watching how DOGE reacts around the 0.5 Fibonacci retracement ($0.2149). If this level fails to hold, my next support levels are at the 0.618 ($0.1982) and the 0.65 ($0.1936) zone. These areas could serve as strong demand zones where buyers may step in before DOGE begins another bullish leg.
The key resistance to watch is the December 2024 trendline (diagonal resistance connecting the recent highs). Once price breaks and confirms above this trendline, my first partial Take Profit (TP1) will be at the 0.618 level of the bigger Fibonacci retracement = $0.348.
The June 2025 diagonal support line (ascending trendline) also remains intact, providing structure for a possible higher-low formation.
Here’s my trading plan in simple steps:
✅ If 0.5 FIB ($0.2149) holds → bounce likely.
❌ If 0.5 FIB breaks → next support is 0.618 ($0.1982) / 0.65 ($0.1936).
🚀 Breakout above December 2024 trendline → first TP = $0.348.
That’s my take on DOGE. What’s yours? Share your thoughts in the comments — I’d love to check out your trade ideas too. 🙌 If you found this breakdown useful, don’t forget to follow me here on TradingView for more structured crypto setups and insights!

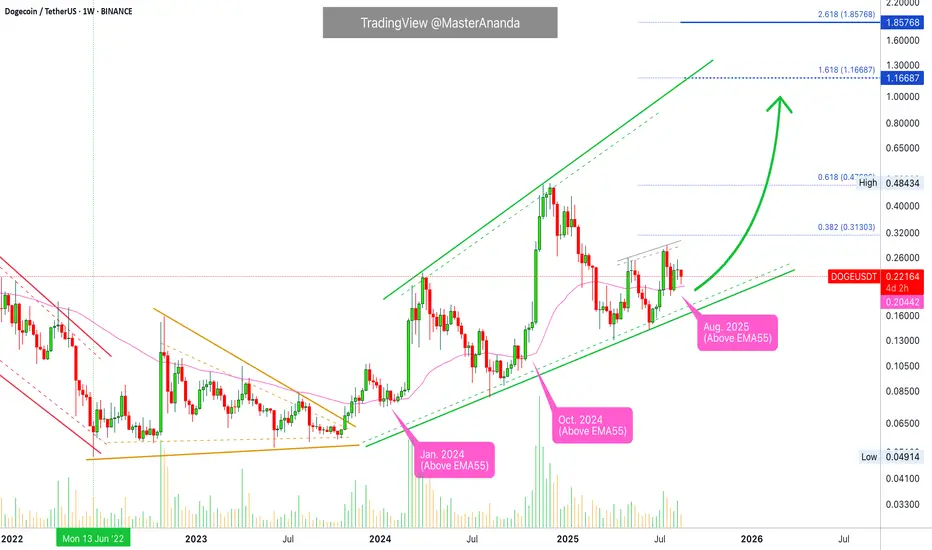
Dogecoin · EMA55 Weekly · See What I Mean?Here DOGEUSDT (Dogecoin) can be seen rising while staying above EMA55 weekly—magenta line on the chart.
This is technical analysis made simple.
» DOGEUSDT moved above EMA55 October 2024 and this produced a major bullish jump.
» DOGEUSDT moved above EMA55 January 2024 and this produced a bullish jump.
» DOGEUSDT moved above EMA55 November 2020. This event preceded the 65,000% 2021 bull market.
» The date is now August 2025 and Dogecoin is trading safely above EMA55 after a minor advance. It managed to break this level as resistance and later confirm it as support.
If DOGEUSDT can remain above this level for just 1-2 weeks without crashing down, expect a major advance, and this is exactly what we expect will happen in the coming weeks. Dogecoin is going to grow massive with targets at $1.16 and $1.85.
Thank you for reading.
Namaste.
DOGE's Situation, A Comprehensive Analysis !!!It appears that the price is forming a cup and handle pattern, and if this occurs, it could push the price above $0.30 & reach to top of the channel.
Best regards CobraVanguard.💚
DOGE Golden Pocket Defense — Bulls vs Bears at 0.21!Analysis
Dogecoin is currently at a critical inflection point, trading inside a range between 0.20 – 0.245. The 0.206 – 0.216 zone (Golden Pocket Fib 0.5 & 0.618) has acted as a key demand area, consistently absorbing sell pressure and triggering multiple bounces.
So far, this zone has been respected as a strong support, signaling buyer accumulation. However, without a decisive breakout above 0.2447, the market remains in sideways consolidation mode.
---
🔹 Technical Structure & Pattern
Golden Pocket Defense → buyers are repeatedly defending the 0.202–0.216 area.
Equal Highs → formed around 0.2447–0.2724, suggesting liquidity buildup above this range.
Consolidation Range → in play since June, with 0.20 as support and 0.245–0.272 as resistance.
A successful breakout could serve as a base for the next expansion leg.
---
🚀 Bullish Scenario
1. As long as price holds above 0.202–0.216, bias remains constructive.
2. A daily close above 0.2447 will likely trigger momentum toward 0.2724.
3. If 0.2724 breaks, targets extend to 0.3106 → 0.3363.
4. A strong continuation above 0.3363 could push DOGE toward 0.4137 – 0.4350, and eventually 0.4668 – 0.4843.
5. This would mark a clear shift from consolidation to a trend expansion phase.
---
⚠️ Bearish Scenario
1. A daily close below 0.202 invalidates the demand zone and flips bias to bearish.
2. Downside targets: 0.190 → 0.170.
3. In case of extended weakness, deeper supports are found at 0.136 – 0.129 (historical lows).
4. Such a breakdown could trigger panic selling, especially if Bitcoin weakens simultaneously.
---
🎯 Trading Idea Summary
Critical Zone: 0.202 – 0.216 (Golden Pocket) → buyers must defend it to sustain bullish momentum.
Bullish Play: Accumulate near demand zone, invalidation below 0.202, scale out at 0.2447 / 0.2724 / 0.3106.
Bearish Play: Wait for breakdown below 0.202 for momentum toward 0.190 / 0.170.
📌 In short, DOGE is at a make-or-break zone: will it push higher into 0.27–0.31 or lose its footing and revisit 0.19?
#DOGE #DOGEUSDT #Dogecoin #CryptoAnalysis #Altcoins #PriceAction #Fibonacci #SupportResistance #GoldenPocket

Doge - launch sequence?Hello!
The yellow and purple traces are today’s look at the bullish launch sequences that we may be feeling the effects of.
Yellow shows $0.32 on this next move for Doge. Purple is fractaling out … it goes big. Over a dollar.
This could also the a head and shoulders having just completed on the hourly view. That would make this the right shoulder on tehlonge range view also… nested H& S? That can trigger big moves.
RSI and MACD jsut reset on the 4H candle. Love that position for a bounce!
Go Doge Go!