2025 – The Year of the Normalized Dollar (Episode 2)2025 – The Year of the Normalized Dollar (Episode 2) 📉💵
📆 Feb 25 was just the beginning — and now we’ve got confirmation.
DXY couldn’t hold above structure, and the drop is on. What began as a quiet theme is turning into the macro headline:
The King Dollar is softening... on purpose.
🔍 Chart Context
• 🔴 Rejection at 112.3 — clean and brutal**
• 🔁 100.95 now flipped into resistance**
• 📉 Heading toward Target: 94.37** — the long-term structure low
The structure hasn’t changed — only the velocity has.
This isn’t a flash move. This is policy-meets-price.
🧨 Fundamentals: Trump’s Soft Dollar Doctrine
Back on January 23, Trump told the world exactly what he wanted:
“I’d like to see interest rates come down… a lot.”
“Oil down, prices down, inflation gone — and then rates down.”
Translation?
💵 A weaker dollar to fuel exports, ease debt loads, and juice the real economy.**
This is not weakness — it’s a recalibration.
Add in:
• Tariffs + labor policy inflation
• Pressure on Powell
• Geopolitical chess moves (Putin negotiations, Middle East detente)
→ and you’ve got a coordinated softening playbook.
📉 What’s Next?
• 🔹 Break 98 = Target 94.37 opens wide
• 🧱 If 94 cracks, we’ll re-assess — but for now, that’s the magnet
• DXY needs a miracle to reclaim strength without Fed resistance easing
2025 could be the year the dollar gets normalized by force — not finesse.
🔄 Perspective Shift 🔄
This isn’t dollar death — it’s dollar diplomacy.
Strong enough to hold global weight, soft enough to boost Main Street.
You think this isn’t coordinated? Look again. 📡
One Love,
The FXPROFESSOR 💙
First episode:
⚠️ I’m not a financial advisor — just a philosopher with better chart vision than 99% of the noise out there. What I share is my view, not a signal. You trade? You’re responsible. Just don’t blame me when I’m right again.
Dollar

AUDUSD Short I am shorting AUDUSD, and the reasons are
Following the trend, good to enter the wave.
Creating channel to break the October lows.
Bearish hammer on daily chart.

SPX500 ShortHello traders,
I am expecting the SPX500 to see a potential 20% correction. Current sentiment appears mixed while valuations remain elevated, which increases downside risk. This view also aligns with the technical setup:
On the weekly timeframe, price is respecting a well-defined channel.
On the daily timeframe, a double-top pattern has just formed, suggesting possible trend exhaustion.
Not financial advice, just sharing my market perspective.

XAGUSD LongA very risky trade in the context of tight stop loss , but worth of taking this trade since is good risk reward ratio. Reasons that I am entering long are simple, following the trend and the price held very solidly on level 49.50$. I look definitely for new highs to ~55$ zone.

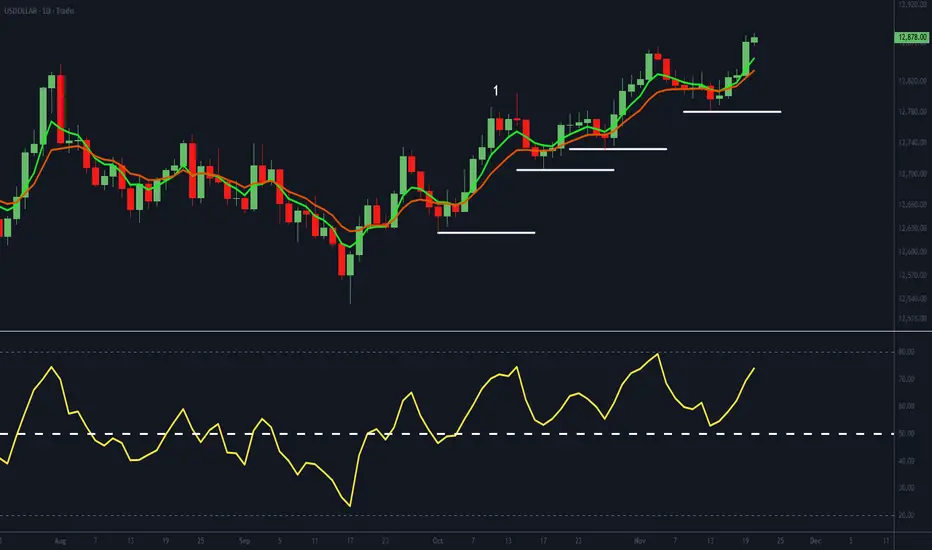
The Dollar’s Climb: A Trend With More Fuel in the Tank?The USDOLLAR daily chart is in a clear uptrend, defined by a sequence of higher troughs and higher peaks. The EMAs are aligned in a bullish formation with strong angle and separation, and the RSI remains above 50 - signalling positive underlying momentum for the greenback.
Market participants positioned themselves well early on, with the first higher peak after a higher trough forming at point 1, even before Fed Chair Jerome Powell pushed back - in unusually blunt terms - against a December rate cut during his 29 October press conference.
Since then, the dollar has been on a tear. A break below the most recent higher trough would warrant a reassessment, but for now the USDOLLAR continues to present a firm uptrend.
USDJPY - HUGE BULLISH TO $202 INCOMING! (UPDATE)As expected the USDJPY has been pumping, like I said would happen on my previous analysis. USDJPY is 160 PIPS in profit so far.
We are still VERY EARLY on, so if you think you've missed the buying opportunity, you haven't!

DXYDollar annotated fib channel. Dollar is braving FED cuts and QT end shenanigans. All the while gold and silver are hitting ath, crypto is still relatively interesting, and megacaps have no fear

USDCAD: Patient Fed & oil drop support iH&S projection to 1.4370USDCAD is building an interesting medium-term setup as crude oil weakness combines with Fed patience and supports dollar strength against the loonie, with an inverse head-and-shoulders pattern pointing to a measured-move target near 1.4370.
Crude oil recently broke below $60, directly pressuring the Canadian dollar since Canada is a major commodity exporter. Meanwhile, the Fed's cautious stance on rate cuts, despite labour market softness ahead of a potential partial NFP on Friday, keeps the buck bid as investors hold dollars for yield.
The technical structure confirms what the macro backdrop suggests: USDCAD has room to run higher from current levels.
Key drivers
Oil breakdown hurts CAD: crude slipped below $60 recently, and every time oil weakens, the commodity-linked loonie follows. This correlation has been tracking cleanly since July, when USDCAD turned higher alongside the energy sell-off.
Fed patience supports USD: Despite labour-market weakness signals from existing data releases, the Fed isn't rushing to cut in December, and a patient central bank typically supports the dollar because investors can hold dollars and earn decent carry while awaiting clarity on policy.
Inverse H&S pattern: The technical setup shows a head near 1.3537, a neckline breakout near 1.3900, and a clean retest at 1.3985 (former 2022 resistance turned support). The measured move from head to neckline brings 1.4370 into play, with intermediate targets at swing levels.
RSI reset above 50: After showing flat divergence at the recent highs, the RSI has reset by bouncing cleanly off the 50 line on the daily chart, suggesting momentum has room for another leg higher before any overbought concern.
Use 1.3985 as your line in the sand, consider longs above this level with the first target at the peak of 1.4145 (validation of the breakout), the second at 1.4250, and trail stops toward 1.4370 if momentum holds. Watch for oil to remain below $60 and Fed messaging to stay cautious, as a daily close below 1.3985 would shift the bias to consolidation, while full pattern invalidation sits at 1.3720.
This content is not directed to residents of the EU or UK. Any opinions, news, research, analyses, prices or other information contained on this website is provided as general market commentary and does not constitute investment advice. ThinkMarkets will not accept liability for any loss or damage including, without limitation, to any loss of profit which may arise directly or indirectly from use of or reliance on such information.

DXY firmed between the hawkish Fed and Waller call of cuts.
The dollar strengthened despite the contrast between the Fed’s overall hawkish tone and Waller’s support for rate cuts.
Cleveland Fed President Hammack noted that policy must remain somewhat restrictive to bring inflation back to target, while St. Louis Fed President Musalem also emphasized that any policy easing should proceed cautiously.
In contrast, Fed Governor Waller said he is not concerned about a renewed acceleration in inflation and argued that several months of labor-market softness justify additional rate cuts. He added that tariffs are unlikely to have a lasting impact on inflation and that restrictive policy is increasingly weighing on the economy, particularly on lower- and middle-income households.
DXY briefly tested the support at 99.30 before climbing above both EMAs. The converging EMAs indicate a potential shift toward a bullish trend.
If DXY closes above both EMAs, the index may advance toward 99.80.
Conversely, if DXY breaks below both EMAs and 99.30, the index could retreat toward the next support at 99.00.

Looking for the Sweep leading into a bigger Play! Price bled lower through the entire Asian session after yesterday’s late breakdown, continuing the move away from the prior value area. We’re now trading inside a cluster of intraday inefficiencies with clean liquidity sitting below at 4013 and the psychological 4000 level.
My focus going into London and NY is patience.
Asia’s slow descent is typically a continuation phase, not the actual entry. I want to see:
A sweep of 4013 or 4000
A clear displacement reaction
A retrace back into a fresh M5–M15 FVG
Then structure confirming continuation or reversal
Until that happens, this remains a bearish environment with untested Weekly imbalance still below. If buyers don’t defend 4013 with force, the algo will likely reach for the 4000 liquidity pocket next.
Staying reactive, not predictive.
London will reveal whether this breakdown continues or sets the trap for a reversal.

Gold Week Opens Inside Daily FVG — Will We Drop Into the Weekly New week, and Gold opened inside last week’s Daily FVG, which was fully rebalanced.
No confirmation yet that this zone will act as support. The larger unmitigated Weekly FVG below may still be the draw on liquidity before any bullish move develops.
Plan for tonight:
Let Asia define the range
Watch for a sweep during London
Bearish continuation is favored if we break today’s open level (4174.9)
Bullish only if Asia low → sweep → displacement → retrace
Levels marked.
Patience. Let the algo show its hand.
#Futures #GC #Gold #FVG #ICT #SmartMoney #DayTrading #NOFOMO

USDJPY Analysis - Bullish Outlook The price is currently in a clear uptrend on the 1H timeframe, and the daily timeframe also supports bullish momentum. After breaking structure on the 1H chart, price pushed down to collect sell-side liquidity, and once that liquidity was taken, we saw a strong impulsive move to the upside.
Right now, price has moved back above the range and has formed a clean Imbalanced Fair Value Gap (IFVG). This IFVG sits in a highly important price zone that I’m watching for potential long setups.
🔵 IFVG Buy Zone:
154.14 – 154.23
This zone aligns perfectly with the 50% Fibonacci retracement, which adds even more confluence.
My plan:
If price returns to this IFVG zone, I will drop to the 5-minute timeframe. If we get a 5M Change of Character (ChoCH) inside this zone, it will be a high-probability confirmation for a long position with expectations of making a new higher high on USDJPY.
🎯 Next Target:
155.43

**“Friday Play: Watching GC for a potential continuation lowerAfter the 4240 liquidity clear. Today’s open (4174.9) is my decision point.
Two scenarios I’m stalking:
1️⃣ Break & retest below 4174 → downside continuation into the H4 bullish FVG (4060–4090).
2️⃣ Sweep above 4200–4215 → rejection → short from premium pricing.
Friday loves completing unfinished business — but only if orderflow confirms. Patience first.”**

Shutdown Ended, What Is Next for the US Dollar?US shutdown ended after 43 days and set a new record. During the shutdown, a lot of economic data could not be released, and the lack of government spending caused a limited liquidity shortage. Now that the shutdown has ended, what is next for the US dollar?
US economy is expected to be hit by the shutdown in the fourth quarter. The impact is estimated to be around 1.5 percent on an already weakening economy. Over the last 25 years, annualized quarterly GDP growth has averaged 2.3 percent. Since 2021, US GDP rose above this average on a yearly basis. GDP was 2.8 percent in 2024, and this year it is expected to fall to 1.9 percent, below the long-term average, and it could drop further because of the shutdown. Growth in 2026 is also expected to be weak, with a forecast of only 1.8 percent.
While GDP is weakening, inflation forecasts still point to a near 3 percent pace, which is somewhat high in our view. This will keep the FED busy. Inflation implies a weaker currency unless supported by high rates. The FED has a dual mandate and cannot overlook the weakening GDP and softening labor market, so despite elevated inflation risks, rate cuts will continue. This will put ongoing pressure on the dollar, at least first half of 2026.
Dollar performance cannot be assessed without considering the euro, since 57.6 percent of the dollar index is tied to it. The eurozone is also expected to stay below its 25-year average growth rate of 1.32 percent. A 1.10 percent GDP rate with inflation below 2 percent is acceptable for the ECB. While the FED will be cutting rates, the ECB will likely hold, as Lagarde said in the latest press conference: “We are in a magnificent place.”
For the short term, the dollar is about to break its trend channel to the downside. Economic data from the US is expected to come in very weak. With expectations of weak data and easing liquidity problems, short-term downward pressure could push the index to 98.55 first. Below that initial support, the selloff could deepen. However, the long-term trend from 2011 is still holding(white trend).

DXY – Watching for Bullish Shift Above 99.765Hello traders,
The Dollar Index (DXY) has completed a deep retracement — over 50% of the previous bullish leg — tapping into the daily bullish Fair Value Gap (FVG) and showing a bullish reaction from that area.
At this stage, if the market can hold Tuesday’s low and break above 99.765, it would confirm a bullish momentum shift, opening the path toward the next liquidity level at 100.397 as my main target.
However, if the price breaks below Tuesday’s low, this bullish scenario becomes invalid, and further downside movement could be expected.
Simple structure — just waiting for confirmation of direction. 📈
Gold Testing H4 Supply – Eyes on Retrace SetupAfter a clean bullish expansion last week, Gold is now testing a 4H bearish FVG around 4,200–4,240. Price is currently holding below the day’s open (4,203), suggesting potential short-term weakness.
If we stay below 4,203, I’ll look for a corrective move toward the 4H bullish FVG just below the previous day’s low (around 4,060–4,090).
Above 4,220, the bullish continuation remains valid.
Currently in observation mode — waiting for intraday confirmation before engaging any short bias.

Dollar Decision TimeDollar is about to decide to rally and target over 101 or go back to the blue, long term trend that started in 2011 and test it again. This week, it will be decision time for dollar and all the markets.

GBPUSD: Very Bearish Outlook 🇬🇧🇺🇸
Intraday price action on GBPUSD looks very bearish after a recent
test of a significant daily resistance that we discussed earlier.
The occurrence of a bearish imbalance indicates a highly probable
down movement.
I anticipate a fall at least to 1.3064
❤️Please, support my work with like, thank you!❤️
I am part of Trade Nation's Influencer program and receive a monthly fee for using their TradingView charts in my analysis.

DXY (Dollar Index) Daily Outlook (Count 3)This is a daily timeframe outlook of the TVC:DXY . This is in alignment with my previously posted weekly outlook and is a slight alteration of the last posted Daily outlook, both shown in the related publications area.
In this update I am looking for the DXY to continue lower potentially in an ending diagonal pattern towards the red and yellow target zones at around 93.8. As mentioned on the chart, if we see price decline in a traditional impulse with no overlap between wave 4 and 1 then the measured move target will be surpassed.
I have a short trade shown on the DXY chart but this is only indicative of the move I expect, I am instead long FX:EURUSD which moves inversely to the DXY. More comments on the chart.

The dollar softens as weak data boosts Fed rate-cut expectations
According to ADP data, US companies laid off an average of 11,250 employees per week in October, reaffirming how quickly labor market conditions have softened over the past two weeks.
Meanwhile, the NFIB Small Business Optimism Index fell for a second straight month to 98.2 (prev. 98.9, cons. 98.3), marking the lowest level since April’s reciprocal tariff announcement. The NFIB noted that the government shutdown and tariffs have weighed on business sales.
The dollar may stay range-bound, awaiting fresh price catalysts between hopes for a shutdown resolution and further Fed rate cuts.
DXY briefly tested the ascending channel's lower bound before rebounding slightly. The index remains between both EMAs, suggesting a potential extension of the consolidation trend.
If DXY closes above EMA21, the index may advance toward the following resistance at 99.80.
Conversely, if DXY breaks below EMA78 and the support at 99.50, the price could fall below the channel’s lower bound.

Breakout Confirmed – Watching for 4H FVG RebalanceAfter a full week of sideways chop, Gold finally broke structure on Monday with a strong bullish impulse. The breakout clears the 7-day range and confirms higher-timeframe bullish intent.
I’m now watching the 4H FVG sitting just below the previous day’s low — that’s where I’d like to see price rebalance before continuing the next leg higher.
If price respects that zone and holds structure, it could mark the start of a sustained bullish push for the week.
Bias stays bullish unless price breaks back below the H4 FVG or fails to hold the weekly open.

AUDUSD Intraday Technical Analysis - 10 Nov 2025AUDUSD Intraday Technical Analysis - 10 Nov 2025
Australian Dollar/US Dollar at 0.65320 (3:40 PM UTC+4) — consolidation breakout imminent.
📌 Market Context: Wyckoff Phase D accumulation post-August correction; Dow Theory secondary uptrend forming; Gann Square-of-9 targets 0.6580/0.6480.
🗺️ Multi-Timeframe Pulse:
1D: Inverted head-and-shoulders pattern neckline at 0.6500; RSI 55 (neutral); Ichimoku cloud support 0.6420; bullish reversal signal forming.
4H: Rising channel 0.6480-0.6580; EMA21>EMA50 (golden cross); VWAP from Sept 20 = 0.6510 (support level).
1H: Cup-and-handle breakout attempt from 0.6480 base; BB midline 0.6520; VWAP slope neutral-bullish.
30M: Symmetrical triangle 0.6500-0.6560; hidden bull divergence on RSI; volume contracting.
15M: Bull flag over 0.6510; Tenkan>Kijun bullish alignment; stochastic RSI ready for extension.
5M: Falling wedge retest 0.6500; hammer candlestick signals intraday demand; false breakout risk above 0.6560.
🎯 PRIMARY LONG SETUP
Entry: 0.6510-0.6525 (triangle support + VWAP) — confirm on 15M bullish close >0.6535.
Stop Loss: 0.6485 (below triangle base).
Target 1: 0.6555 (+35 pips).
Target 2: 0.6580 (+60 pips — channel top).
Target 3: 0.6620 (+100 pips — harmonic extension).
Confirmation: RSI>55, volume +20%, VWAP support holding.
⚡ MOMENTUM ADD: Scale above 0.6580 ONLY if RSI>65 + volume surge; trail stop to 0.6560.
🔻 REVERSAL SHORT SETUP
Entry: 0.6600-0.6625 (supply zone) — trigger on bearish engulfing + RSI divergence.
Stop Loss: 0.6650 (above channel resistance).
Targets: 0.6560 → 0.6520 → 0.6480 (Gann support).
Confirmation: 5M/15M RSI bearish divergence; BB upper band rejection.
🚨 BREAKOUT PROTOCOL:
BULL: 1H close >0.6580 confirms H&S breakout; target 0.6700; move stop to BE+15.
BEAR: 1H close <0.6500 with volume expansion triggers retest of 0.6420 cloud support.
📊 INDICATOR SNAPSHOT: BB squeeze (30M) tightening; MACD histogram positive; VWAP slope neutral-up; EMA21 acting as trigger line on 1H.
⚠️ PATTERN ALERTS: Harmonic bat PRZ at 0.6600; H&S neckline breakout >0.6500 = trend confirmation; channel failure <0.6510 = Wyckoff spring risk.
📈 TIMING & RISK: RBA decision watch; Gann 90° cycle 20:00 UTC; expect 0.80% intraday range. Risk ≤1% per setup; avoid chasing; lock gains at TP1.
Educational analysis only. Trade with your plan, manage risk, adapt to live price action.

Gold Eyes 3,980 Support as Bulls Prepare for the Next Leg HigherHey Traders, in today's trading session we are monitoring XAUUSD for a buying opportunity around 3,980 zone Gold is trading in an uptrend and currently is in a correction phase in which it is approaching the trend at 3,980 support and resistance area.
Trade safe, Joe.
