GOLD FURTHER SELL OFF?! (UPDATE)Gold has pushed up & playing within a range. It's moving perfectly within a range to create either a flat or complex correction pattern, either in a 3 or 5 Sub-Wave form.
Remember, Wave 2 & Wave 4 are always corrective moves so they move slow. Time to exercise patience🤞🏼
Dollar

DXY - Correction in ProgressWe analysed DXY / Dollar few days back and it was highlighting a Bearish move. This move is in progress and so far we have a Correction Wave A & B completed. Correction Wave C might take dollar even lower depending on macro outlook i.e. ceasefire deal / Fed rate decision etc.
Best approach is to go from level to level rather than aiming for a swing move as sentiments can switch anytime.
For entries, please wait for at least two candle reversals at the specified level and apply appropriate risk management.
If you found this analysis helpful, please consider boosting and following for more updates.
Disclaimer: This content is for educational purposes only and should not be considered financial advice.

Will the Dollar Index Redefine Global Economic Equilibrium?In the intricate dance of international trade and geopolitical strategy, the Dollar Index emerges as a critical compass navigating the turbulent waters of economic uncertainty. The article illuminates how this financial barometer reflects the profound implications of proposed tariffs by the U.S. administration, revealing a complex interplay of currencies, trade relationships, and global market sentiments that extend far beyond mere numerical fluctuations.
The proposed tariffs targeting key trading partners like Canada, Mexico, and China represent more than economic policy—they are strategic maneuvers with potential seismic shifts in global trade dynamics. As the Dollar Index climbs, reflecting the U.S. dollar's strength, it simultaneously exposes the delicate balance of international economic relationships. The potential consequences ripple through supply chains, consumer markets, and diplomatic corridors, challenging the post-World War II trade paradigm and forcing nations to recalibrate their economic strategies in real time.
Beyond the immediate market reactions, these developments signal a broader philosophical question about economic sovereignty and interdependence. The tariff proposals challenge long-established multilateral agreements, potentially accelerating a transformation in how nations perceive economic collaboration. While the immediate impact is visible in currency fluctuations and market volatility, the long-term implications could reshape global economic architecture, prompting a reevaluation of the U.S. dollar's role as the predominant global reserve currency and testing the resilience of international trade networks.

USDCHF Short Trade.USDCHF breakout out from its uptrend on downside we might see consolidation to downtrend in USDCHF

GOLD is getting ready to break out!I think we should get a move to break out to the upside and start making new highs on Gold. US will have a Holiday this week so that will leave the dollar struggling on momentum. Trying to catch a piece of the move up.

GBPUSD SHORT TO $1.24300 (UPDATE)Once again overnight (Asia session) GU shot back up again towards our Wave 5 entry zone, rejected it again & is running 70 PIPS in profit so far.
Me & my Gold Vault Academy students understand that Wave 5 being the FINAL IMPULSE WAVE, means that wave will move slowly & trap in a lot of early buyers before it reaches its target. As an Elliott Wave trader, you need to learn to be generous with your SL as we are long term traders trading the higher TF’s, not scalpers👌

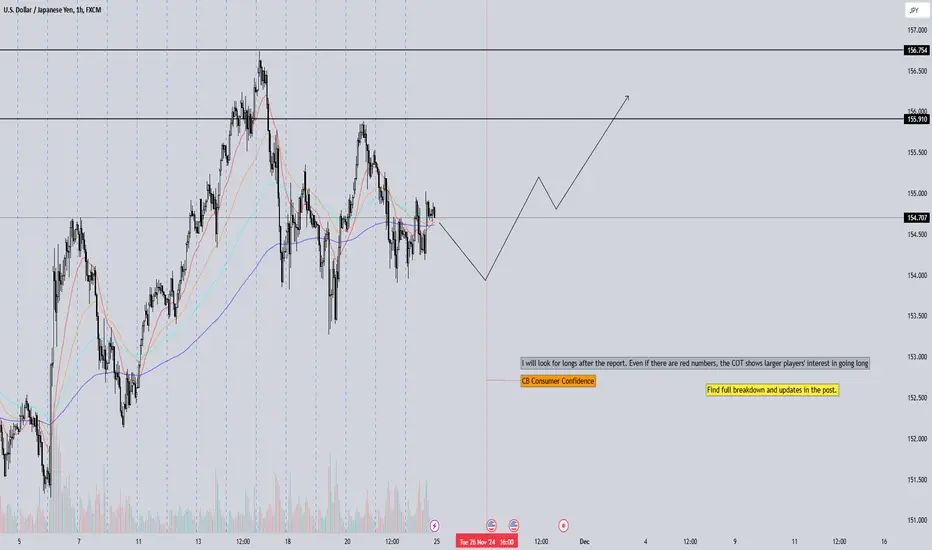
USDJPY GAME PLAN WEEK 48After analyzing the forex market's COT report released last Friday, I have aligned my bias with the macroeconomic reports scheduled for this week. There are fewer key events compared to last week, but I am confident that the ones we do have are worth paying attention to.
Now, let me explain why I consider USD/JPY to be a good long trade. First of all, the COT data revealed increased interest in a stronger dollar, further strengthening the already solid bullish sentiment. At the same time, all other currencies either showed increased long interest or reduced short interest—except for JPY.
I avoid trading pairs that are on the same side of the market, as I aim to find as much friction as possible to create the volatility that we, as traders, thrive on. However, this alone is not enough. I will also follow the key reports and events this week, including:
CB Consumer Confidence
Preliminary GDP (q/q)
Unemployment Claims
Core PCE Price Index (m/m)
FOMC Meeting Minutes
Keep in mind that the U.S. market is closed on Thursday.
I won’t wait for every individual release before taking action but will trade accordingly as opportunities arise. For instance, I plan to go long after the CB Consumer Confidence report, but not blindly—I will still base my entries on technical levels. However, the actual numbers in the reports will matter less.
The reality is that sometimes a number that misleads the majority, combined with a strong underlying bias, can create a divergence with immense force behind it.
I will provide updates as the week progresses. Trades might be held for two days or even throughout the entire week, depending on market conditions.
GOLD FURTHER SELL OFF?! (UPDATE)After a strong 1,000+ PIPS sell off yesterday, bearish momentum is still holding strong on Gold & keeping prices down. Yesterday's sell off would be considered as Wave 1 of the Bearish correction, which means any minor wave 2 correction we see, this would be your chance to get into sell positions if you haven't already.
I will be looking to get into further sell positions for my Gold Fund investors if market structure offers the opportunity. I will NOT be sharing my additional entries on here for free.

EUR/USD Hits Critical Support: Will It Move Higher?EUR/USD has experienced a decline of over 5% in recent weeks, without any significant pullbacks, raising the likelihood of a potential upward movement in the coming days. This downward trend has brought the price to a key support level on the daily chart, near 1.0450, a region previously tested in December 2022. Following this, the price exhibited classic false breakout behaviour, briefly dipping below this support before quickly reversing upwards.
Understanding False Breakouts in the Forex Market
A false breakout occurs when the price temporarily breaches a significant support or resistance level but fails to maintain that movement, swiftly reversing direction. In the case of EUR/USD, the breakdown below 1.0450 was rejected by buyers, which resulted in an immediate upward rebound.
False breakouts are relatively common in the Forex market, where heightened volatility and manipulation by larger players can trigger fleeting movements that capture the stop-loss orders of conservatively positioned traders. Such scenarios often create opportunities to trade in the opposite direction of the initial breakout.
Potential Trigger: Break Above Previous Candle High
Today's candle has exceeded the high of the prior candle, signalling a possible shift in direction as buyers begin to regain momentum. This context indicates that the 1.0450 region could once again serve as a crucial defensive point for buyers.
Potential Upside in the Coming Days
The breakout above the previous candle's high is a positive indication for buyers. If EUR/USD can maintain its position above the 1.0520 level, it may signify the onset of buying strength, with the next upside targets being:
1.0670 - A zone where previous support may act as resistance, coinciding with the 38.2% Fibonacci retracement level of the recent decline.
1.0750 - A significant resistance level and prior consolidation zone on the daily chart, aligning with the 50% Fibonacci retracement of the recent downside.
To confirm this bullish scenario, the price will need to sustain upward momentum characterized by large-bodied daily candles and increasing buying volume.
Alternative Scenario: Bearish Resumption
Should the price fail to maintain the rally and break below the 1.0450 support level, the bearish scenario could resume, with subsequent targets including:
The next relevant support zone on the daily chart around 1.0250.
A final target near the 1.0100 region, which attracted attention in November 2022.
EUR/USD is currently at a critical juncture following a significant decline and a false breakout of daily support. The analysis suggests potential for upside as long as the price remains above 1.0450. However, the possibility of a bearish scenario cannot be dismissed, especially in the event of a negative reversal. This is a crucial period for monitoring price behaviour at key technical levels.
Disclaimer:
74% of retail investor accounts lose money when trading CFDs with this provider. You should consider whether you understand how CFDs work and whether you can afford to take the high risk of losing your money. Past performance is not necessarily indicative of future results. The value of investments may fall as well as rise and the investor may not get back the amount initially invested. This content is not intended for nor applicable to residents of the UK.

EURUSD - Finally we will see a bullish momentum?Price just closed the gap and in my opinion its the fuel it needs to go higher and start retracing in the higher timeframes.
Let's see what happens

GU giving a bullish play...Was looking for a area where price wants to turn around. It looks like it wants to do it here. Looking for price to push up some where above the Previous Daily Low. But cautious that it could reverse and continue bearish from that point.

Gold is giving Bullish Signsnow that we are in the London kill zone I am looking at price action and its looking like it wants to switch up bullish. Got In right at the open of Killzone. and price has now moved back above the daily level. Thinking it can hold from here and push up. if it breaks down then we will wait for a test of a lower level before getting in.

#2 Danger BTC is falling Bearish Outlook and Macro Perspective
As in my previous remarks, I signaled an unstable #100k level, which has developed into a failure even to touch this mark. This reflects a loosening in bullish momentum, as many holders and investors are now taking profits. It's important to remember that there are also long-term holders (over 5 years) who experienced losses of up to #77% since November 2021. These holders might now be exiting their positions, adding selling pressure to the market.
Moreover, with speculation surrounding Trump's actions post-20 January next year, it’s wise to approach the market cautiously and avoid wild bets. There are still lagging opportunities in other sectors. For example, Cardano (ADA) recently posted #38% gains in two weeks, highlighting alternative investments that are catching up to the current crypto bull run.
Bitcoin Analysis: Bearish Outlook and Short-Term Targets
Position Details:
Current Sell Entry: #97k
Target: #90k
Market Structure Overview:
The price action is respecting a rising wedge pattern, which is generally a bearish continuation pattern. The breakdown seen near the current price (~#94k) aligns with your bearish outlook.
Bearish Confirmation:
RSI: The RSI has fallen below neutral (currently #34.06), signaling weakening momentum.
MACD: The MACD histogram shows growing bearish momentum (red bars) alongside a bearish crossover.
Volume Flow Index (VFI):
The VFI at #20 suggests moderate capital flow into the market, but not sufficient to sustain bullish trends.
Short-Term Target: #90k
The primary target remains #90k, supported by:
The wedge breakdown projection aligning with this level.
Historical support zones evident on the chart.
December Scenario: Potential Retest or Breakout
Heading into December, two possible scenarios are likely:
Scenario A: Retest as a Double Top
A rebound could take the price back to #97k or higher, potentially forming a double top. Rejection here would confirm continued bearish pressure.
Scenario B: Breakout to #100k-#102k
If bullish momentum unexpectedly revives, a breakout to #100k-#102k could occur. However, this would likely represent a false breakout, followed by a deeper decline.
Technical Outlook:
Key Resistance Levels:
#96k (current zone of interest).
#100k-#102k (psychological resistance and possible retest zone).
Key Support Levels:
#90k (primary target).
#85k (potential deeper breakdown area).
Conclusion:
The current analysis reinforces a bearish short-term outlook, with a sell position targeting #90k. December may bring increased volatility with a possible retest at #97k or a breakout to #100k-#102k before the downward trend resumes. This cautious approach is underscored by macro factors such as profit-taking from long-term holders and alternative opportunities, like Cardano’s recent #38% gains, still lagging the broader crypto bull run. Stay vigilant with key levels and monitor confirmation signals from RSI and MACD.

BTCUSD Daily Inflection Point
This is a continuation of the Weekly Inflection Point.
On the daily we're getting close to a crucial area. A downward move here may indicate a large move, correction on the weekly, daily. 16k could easily be hit. There is also the potential for this momentum consolidation to have a breakout leg to 77-88k before a final correction.
Watch for a break above or below the keltner channel. If the stock market is about to tank because WW3, the debt bubble created in 2008-2020, then Bitcoin will get shocked with it while everyone scrambles for PM's.
After maybe bitcoin will be revived when people realize there isn't enough PM's out there, else some world wide digital currency emerges.
Either way I have little hope for bitcoin, unless the NWO backs it because of the transparent transactions that can be traced, blacklisted, non fungible- control. Such a currency is a fools hope and will be used against you when tyranny seeks control over you.

Gold: Today's Pullback Eases MomentumGold: Today's Pullback Eases Momentum
Last week, gold continued its upward trajectory, closing at $2716 per ounce. Several key factors tied to geopolitics, the global economy, and structural demand have contributed to this positive momentum in the gold market.
However, today, gold experienced a sharp **3.3% correction**, driven by news of a potential resolution to the Israel-Hezbollah conflict. According to Axios, citing a US official, **Israel and Lebanon have agreed to the terms of an agreement to end the conflict**. This announcement eased geopolitical tensions, reducing demand for safe-haven assets like gold.
Geopolitics and Economic Uncertainty
Gold’s recent rally has been fueled by escalating conflicts, including the war in Ukraine, and broader global geopolitical tensions. However, today’s news of a possible resolution in the Middle East has temporarily weakened the case for gold as a safe-haven asset.
Additionally, gold continues to benefit from economic uncertainty in the eurozone and China, where fears of slowing growth remain significant.
Inflation Concerns and Monetary Policy
Rising fears of global inflation continue to support gold prices. Future President Donald Trump’s proposed tariffs on imported goods to the US could fuel cost increases and inflationary pressures, bolstering gold’s appeal as an inflation hedge.
Gold also benefits from ongoing interest rate cuts worldwide, which reduce the opportunity cost of holding non-yielding assets like gold. Meanwhile, central banks’ continued purchases of gold provide additional fundamental support.
Emerging Economies and Infrastructure Development
Economic growth in emerging markets, such as China and India, where gold has both cultural and investment significance, continues to drive demand. The development of infrastructure around gold trading—such as exchanges, wallets, and investment products—also makes gold increasingly accessible to investors.
Conclusion
Today’s pullback reflects the easing of geopolitical tensions, but gold’s long-term fundamentals remain robust. Factors such as global economic uncertainty, inflation concerns, and central bank policies continue to underpin demand for the precious metal.
Will gold resume its rally after today’s correction, or will geopolitical developments continue to dictate its price direction? Share your thoughts in the comments!

Nasdaq: Gains Driven by Data, Eyes on Key EventsNasdaq: Gains Driven by Data, Eyes on Key Events.
The Nasdaq ended current day on a positive note, buoyed by strong economic data, robust corporate earnings, and supportive seasonality. However, investors are shifting their focus to critical upcoming events: the FOMC meeting on Tuesday and the PCE inflation report on Wednesday. These events have the potential to set the tone for the markets for the remainder of the year.
Mixed Economic Data
The past week brought a blend of economic data, with some encouraging signals and a few disappointments:
Initial Jobless Claims (Nov. 16): At 213K, the result came in better than the 220K consensus, underscoring the resilience of the labor market and reducing recession fears.
Philadelphia Fed Manufacturing Index (Nov.): Disappointed at -5.5 against expectations of 8, reflecting continued weakness in the manufacturing sector.
Michigan Consumer Sentiment Final (Nov.): Came in at 71.8, below the 73.7 forecast, indicating a slight dip in consumer confidence.
S&P Global Services PMI Flash (Nov.): Surprised to the upside with a reading of 57.0, exceeding the expected 55.2, highlighting the strength of the services sector.
Nvidia Shines Bright
Corporate earnings added to the bullish sentiment, led by Nvidia's impressive Q3 results. The company reported revenue of 35.08 billion dollars, significantly above the consensus estimate of 33.17 billion dollars. As a leader in AI-related technology and semiconductors, Nvidia's results lifted the broader tech sector and contributed to Nasdaq's gains.
Market Sentiment and Seasonality
The Fear & Greed Index currently stands at 61, in the "Greed" zone, indicating a risk-on environment as investors show confidence in equities. Seasonality also plays a crucial role. Historically, Nasdaq benefits from end-of-year trends, especially in an election year, when policymakers often aim to maintain market stability.
Challenges Ahead
While the current momentum is positive, the market faces significant tests this week with two major events:
FOMC Meeting (Tuesday): The Federal Reserve’s policy decisions and commentary will be in the spotlight. Investors will look for signals on whether the Fed plans to pause or keep the door open for further rate hikes in 2024.
PCE Inflation Report (Wednesday): The core PCE inflation data, the Fed's preferred measure of price pressures, could shape expectations for monetary policy. A higher-than-expected reading might increase concerns about further tightening, while a lower figure would reinforce the soft landing narrative.
Lingering Risks
In addition to the upcoming macroeconomic events, investors remain wary of:
Trade Policy: Former President Donald Trump’s proposed tariffs on imported goods could stoke inflation and weigh on economic growth.
Geopolitics: The ongoing risk of escalation in the Ukraine conflict continues to loom over global markets.
Soft Landing: The Baseline Scenario
Looking at the current data, the Nasdaq appears to be on the path to a soft landing, supported by a strong labor market and robust technology sector performance. Favorable seasonality—both year-end trends and election-year dynamics—further bolsters the case for continued gains, which remains the baseline scenario for now.
Conclusion
The Nasdaq has shown strength, but this week FOMC meeting and PCE inflation report could reshape market dynamics. The key question is whether the data will support the soft landing narrative or signal a need for further monetary tightening.
What are your thoughts on the Nasdaq’s outlook given the upcoming Fed meeting and inflation data? Will the index sustain its rally, or are we in for increased volatility? Share your insights in the comments.

Gold 1H Intra-Day Chart 25.11.2024Here is what I am looking for next;
Gold prices dip lower $2,602 - $2,590 zone as prices are overbought.

Ethereum: Momentum Fueled by Growth and AdoptionEthereum: Momentum Fueled by Growth and Adoption
Ethereum (ETH) continued its upward trend over the past week, closely following Bitcoin’s rally. The second-largest cryptocurrency by market capitalization is benefiting from a range of factors that reinforce its position as a leader in the blockchain space. With strong fundamentals, expanding use cases, and favorable seasonal trends, ETH’s price growth appears poised to continue.
Adoption and Network Usage
The growing adoption of Ethereum for a wide range of applications—ranging from decentralized finance (DeFi) to enterprise solutions—is a key driver of its rising value. Ethereum’s robust and versatile network continues to attract developers, businesses, and users, solidifying its role as the backbone of the blockchain ecosystem.
The Rise of DeFi and NFTs
The expansion of decentralized finance (DeFi) platforms, which leverage Ethereum’s smart contract capabilities, has created new opportunities for decentralized lending, borrowing, and trading. Simultaneously, the ongoing popularity of non-fungible tokens (NFTs) keeps Ethereum at the forefront of digital ownership and creative innovation.
Network Upgrades and Transaction Fee Burning
Technological improvements, such as Ethereum’s transition to proof-of-stake through the Merge, enhance network efficiency and sustainability. Additionally, the implementation of EIP-1559 introduced the burning of transaction fees, effectively reducing the supply of ETH and creating deflationary pressure, which can drive long-term price appreciation.
Institutional Investment and Ethereum ETFs
Institutional investors are increasingly entering the Ethereum market, driven by its utility and growth potential. One of the major catalysts has been the launch and increasing inflows into Ethereum-based ETFs, which provide a regulated and convenient way for institutional and retail investors to gain exposure to ETH. These inflows not only validate Ethereum’s role as a leading crypto asset but also contribute directly to its demand and price growth.
Seasonality and Market Momentum
Historically, the second half of December has often been a favorable period for cryptocurrency markets, including Ethereum. Factors such as increased trading activity, end-of-year portfolio adjustments, and overall market sentiment have historically supported upward trends during this time. Ethereum seems well-positioned to benefit from this seasonal tailwind, potentially pushing its price toward new highs.
Competition and Ecosystem Growth
Ethereum faces competition from other blockchain platforms, but its first-mover advantage, coupled with continuous innovation, helps it maintain a dominant position. The ecosystem of ERC-20 tokens—built on the Ethereum network—further strengthens its utility and value proposition.
Market Sentiment and Macroeconomic Factors
Positive market sentiment and media coverage contribute to Ethereum’s momentum. Broader macroeconomic factors, such as inflation and economic uncertainty, are also driving investors to explore alternatives like Ethereum as a hedge and growth asset.
Infrastructure and Partnerships
The continued development of infrastructure, including wallets, exchanges, and DeFi tools, makes Ethereum more accessible to users and investors. Strategic partnerships and collaborations within the blockchain space are also expanding Ethereum’s reach and utility.
Conclusion
Ethereum’s price growth is underpinned by a combination of strong network fundamentals, expanding use cases, increasing ETF inflows, and favorable seasonality. From DeFi and NFTs to network upgrades and institutional interest, Ethereum is positioned to continue its upward trajectory as we move into the traditionally bullish second half of December.
Will Ethereum leverage these advantages to reach new price milestones? Share your views and insights in the comments!

GOLD FURTHER SELL OFF?! (UPDATE)Remember what I said on my last Gold update? We could see a short squeeze happen on Gold to trap new buyers & liquidate early sellers. I said if Gold passes the $2,700 mark then it could go up to $2,720 - $2,735 before dropping. Price touched $2,720 last night & melted right back down with accuracy🎯
Overall, our bearish bias remains intact despite the short squeeze!

Bitcoin: Is the Psychological Barrier of $100,000 Within Reach?Bitcoin: Is the Psychological Barrier of $100,000 Within Reach?
Bitcoin continues its impressive rally toward the psychological barrier of $100,000, driven by both fundamental and psychological factors. The rise in its value is supported by growing adoption, institutional investments, positive market sentiment, and key developments within the cryptocurrency ecosystem.
Adoption and Acceptance
Bitcoin’s growing acceptance by businesses, financial institutions, and individual users is increasing its utility and value. As more entities begin to accept bitcoin as a form of payment, demand naturally rises, solidifying its position as a viable medium of exchange.
Institutional Investments
One of the primary drivers of bitcoin’s growth is the involvement of large institutional investors such as hedge funds, investment firms, and corporations. Their entry into the market significantly boosts liquidity and builds confidence in the cryptocurrency, attracting smaller retail investors in the process.
Planned Regulatory Changes and Strategic Reserves
Future President Donald Trump’s proposals to establish strategic reserves in bitcoin and introduce cryptocurrency-friendly regulations could be game-changing for the market. Such measures are likely to attract new market participants, driving demand and increasing bitcoin’s value.
Media and Market Sentiment
Positive media coverage, endorsements from influential figures, and expert analyses play a crucial role in shaping market sentiment. Media narratives have a substantial impact on perception and can amplify investor interest, fueling price increases.
Technological Improvements
Advancements in blockchain technology and updates to the bitcoin network are improving its efficiency, security, and scalability. These innovations make bitcoin more appealing as an investment asset, contributing to its rising value.
Macroeconomic Factors
Global economic uncertainty, inflation, and the weakening of traditional fiat currencies are pushing investors toward alternative assets. Often referred to as “digital gold,” bitcoin is increasingly viewed as a hedge against currency devaluation and a reliable store of value.
The 2024 Halving
This year, bitcoin underwent another halving – the process that reduces the reward for mining new blocks by half. This reduction in new supply, coupled with sustained or growing demand, has historically led to price increases, and the current cycle appears to be following a similar trajectory.
Infrastructure Growth and ETFs
The cryptocurrency market’s infrastructure is rapidly evolving, making bitcoin more accessible than ever. The growth of exchanges, cryptocurrency wallets, and inflows into bitcoin-based ETFs are driving demand and strengthening the market.
Seasonality and an Unstoppable Trend
Seasonality is also working in bitcoin’s favor. Historically, the final months of the year often see strong performance in the cryptocurrency market. The current upward trend seems difficult to halt, and breaking through the $100,000 level appears to be only a matter of time.
Conclusion
Bitcoin remains one of the most dynamic assets on the market, drawing interest from institutional and retail investors alike. The combination of fundamental, technological, and macroeconomic factors suggests that the rally toward $100,000 could not only materialize but also set the stage for further gains.
Will bitcoin surpass this symbolic threshold, or are there still hurdles ahead? Share your thoughts in the comments.

S&P 500: Gains Driven by Data, Eyes on Key Events Next WeekS&P 500: Gains Driven by Data, Eyes on Key Events Next Week
The S&P 500 ended the week on a positive note, buoyed by strong economic data, robust corporate earnings, and supportive seasonality. However, investors are shifting their focus to critical upcoming events: the FOMC meeting on Tuesday and the PCE inflation report on Wednesday. These events have the potential to set the tone for the markets for the remainder of the year.
Mixed Economic Data
The past week brought a blend of economic data, with some encouraging signals and a few disappointments:
Initial Jobless Claims (Nov. 16): At 213K, the result came in better than the 220K consensus, underscoring the resilience of the labor market and reducing recession fears.
Philadelphia Fed Manufacturing Index (Nov.): Disappointed at -5.5 against expectations of 8, reflecting continued weakness in the manufacturing sector.
Michigan Consumer Sentiment Final (Nov.): Came in at 71.8, below the 73.7 forecast, indicating a slight dip in consumer confidence.
S&P Global Services PMI Flash (Nov.): Surprised to the upside with a reading of 57.0, exceeding the expected 55.2, highlighting the strength of the services sector.
Nvidia Shines Bright
Corporate earnings added to the bullish sentiment, led by Nvidia's impressive Q3 results. The company reported revenue of 35.08 billion dollars, significantly above the consensus estimate of 33.17 billion dollars. As a leader in AI-related technology and semiconductors, Nvidia's results lifted the broader tech sector and contributed to the S&P 500’s gains.
Market Sentiment and Seasonality
The Fear & Greed Index currently stands at 61, in the "Greed" zone, indicating a risk-on environment as investors show confidence in equities. Seasonality also plays a crucial role. Historically, the S&P 500 benefits from end-of-year trends, especially in an election year, when policymakers often aim to maintain market stability.
Challenges Ahead
While the current momentum is positive, the market faces significant tests next week with two major events:
FOMC Meeting (Tuesday): The Federal Reserve’s policy decisions and commentary will be in the spotlight. Investors will look for signals on whether the Fed plans to pause or keep the door open for further rate hikes in 2024.
PCE Inflation Report (Wednesday): The core PCE inflation data, the Fed's preferred measure of price pressures, could shape expectations for monetary policy. A higher-than-expected reading might increase concerns about further tightening, while a lower figure would reinforce the soft landing narrative.
Lingering Risks
In addition to the upcoming macroeconomic events, investors remain wary of:
Trade Policy: Former President Donald Trump’s proposed tariffs on imported goods could stoke inflation and weigh on economic growth.
Geopolitics: The ongoing risk of escalation in the Ukraine conflict continues to loom over global markets.
Soft Landing: The Baseline Scenario
Looking at the current data, the S&P 500 appears to be on the path to a soft landing, supported by a strong labor market and robust technology sector performance. Favorable seasonality—both year-end trends and election-year dynamics—further bolsters the case for continued gains, which remains the baseline scenario for now.
Conclusion
The S&P 500 has shown strength, but next week’s FOMC meeting and PCE inflation report could reshape market dynamics. The key question is whether the data will support the soft landing narrative or signal a need for further monetary tightening.
What are your thoughts on the S&P 500’s outlook given the upcoming Fed meeting and inflation data? Will the index sustain its rally, or are we in for increased volatility? Share your insights in the comments.

Gold: Strong Gains Driven by Global Uncertainty and DemandGold: Strong Gains Driven by Global Uncertainty and Demand
Last week, gold continued its upward trajectory, closing at $2,716 per ounce. The positive momentum in the gold market was driven by several key factors related to geopolitics, the global economy, and structural demand for the metal.
Geopolitics and Economic Uncertainty
One of the primary drivers of gold prices remains geopolitical uncertainty. The escalation of the conflict in Ukraine has prompted investors to seek safe havens, with gold, as a traditional "safe haven" asset, attracting significant capital inflows.
Additionally, economic uncertainty in the Eurozone and China is boosting demand for gold. In Europe, tensions stem from economic instability, while in China, concerns about a slowdown in key sectors of the economy weigh on market sentiment.
Inflation Concerns
The rising risk of a global inflation rebound also supports higher gold prices. The tariffs proposed by future President Donald Trump on goods imported into the U.S. could raise production costs and consumer prices, fueling inflation concerns. In such scenarios, gold becomes an attractive hedge against inflation.
Monetary Policy and Central Bank Purchases
Gold is also benefiting from the ongoing cycle of interest rate cuts around the world. Lower interest rates reduce the opportunity cost of holding gold, making it a more appealing investment asset.
Moreover, central banks continue to bolster their reserves by purchasing gold at a strong pace, a trend that supports the market amid increasing global uncertainties and inflation risks.
Emerging Economies Driving Demand
The economic growth of emerging markets, such as China and India, is another factor driving gold prices. These countries traditionally have high demand for gold, driven by cultural and investment preferences. As the wealth of these societies grows, demand for gold, both as an investment and in the form of jewelry, is likely to rise.
Conclusion
Gold remains a key beneficiary of global uncertainties, both geopolitical and economic. Factors such as escalating conflicts, inflation fears, loose monetary policy, and rising demand from emerging economies are bolstering its upward momentum.
Will gold maintain its current growth trajectory? Much depends on the future course of geopolitical and economic developments. For now, gold stands out as an attractive asset for investors seeking safety and inflation protection.
What are your forecasts for the gold market? Share your thoughts in the comments below.

Dollar Index (DXY): More Growth is Coming?!
Dollar Index looks very bullish with a formation of a cup & handle pattern
and a strong buying imbalance candle.
The market will most likely continue growing at least to 107.43
❤️Please, support my work with like, thank you!❤️
