DXY Continuing the bullish trend?DXY Weekly Outlook
The dollar has been bullish over the past few weeks, continuing to break structure to the upside. I expect this momentum to carry on a bit further, but as price approaches a strong supply zone, we could see some short-term downside.
This potential pullback would likely cause a temporary push-up for EU and GU before the dollar resumes its bullish move overall.
I don’t trade the dollar directly, but I use it as confluence for my main pairs — and right now, it aligns perfectly with my EU and GU outlooks.
Key Levels:
Possible bullish reaction around 99.600
Potential bearish reaction around 100.000 (psychological level)
Dollar

Gold Futures (MGCZ25) – Monthly Close SetupPrice has ranged all week between 4040 and 3930. With an H4 FVG still sitting above, we might see one last liquidity grab before the next directional move.
⚖️ Neutral bias for now — watching for clean displacement at range extremes.
📍 If price reclaims 4040 → possible push into the H4 FVG.
📍 If it rejects and drops below 4020 → lower FVG fills toward 3930 could be next.
#Gold #Futures #ICT #MarketStructure #NOFOMO

Stronger dollar, ETF outflows: buy only confirmed dips__________________________________________________________________________________
Market Overview
__________________________________________________________________________________
BTC is consolidating after a reject below 115–116k, holding above 111.7k/110k in a corrective pullback within a still-up 12H/1D trend. Near-term macro flows (firmer USD, ETF outflows) cap bounces for now.
Momentum: Mildly bearish/corrective 📉 — pullback from 115–116k; upside capped until 114.6k is reclaimed.
Key levels:
- Resistances (HTF/4H) : 112.7k–114.6k (4H/1D supply), 115.4k–115.6k (1D pivot), 119.9k–120.45k (HTF).
- Supports (HTF/LTF) : 111.7k (HTF pivot), 110k (intraday shelf), 108.5k–107.4k (HTF + ISPD 30m zone).
Volumes: Very high on 1H/30m during the selloff; 1D volumes normal.
Multi-timeframe signals: 1D/12H Up; 6H/4H/1H/30m corrective; 2H basing — 111.7k/110k defense is key; a firm reclaim above 112.7k would aid bulls.
Risk On / Risk Off Indicator: NEUTRAL SELL — aligns with near-term hesitation and favors confirmed signals at support.
__________________________________________________________________________________
Trading Playbook
__________________________________________________________________________________
Primary trend constructive but capped by 114.6–116k; favor confirmed buy-the-dip and tactical sells on clear rejections.
Global bias: Cautious neutral-sell; tactical invalidation on a clean reclaim/close > 114.6k.
Opportunities:
- Buy: Confirmed bounce at 111.7k/110k (wick + 2H/4H close), target 112.7k then 114.6k.
- Deep buy: 108.5k–107.4k with 12H/1D bullish rejection; add above 112.7k.
- Tactical sell: Rejection at 112.7k–114.6k with rising sell volume, target 111.7k then 110k.
Risk zones / invalidations: Acceptance below 107.4k opens 105k then 102.7–102.9k; daily close > 115.6k invalidates shorts and unlocks 120k.
Macro catalysts (Twitter, Perplexity, news):
- Fed: 25 bps cut, QT ends Dec 1; near-term hawkish tone, firmer DXY.
- US BTC ETFs: notable daily outflow — headwind for follow-through.
- Synchronized light easing (HKMA, Saudi) + Eurozone GDP beat — mixed macro signal.
Action plan:
- Entry: 108.5k–107.4k on a strong 12H/1D bullish rejection.
- Stop: ~0.8–1.0% below 107.2k (or confirmed close below the floor).
- TP1: 111.7k; TP2: 112.7k–113.0k; TP3: 114.6k; Approx R/R: ~2.0–3.0R depending on execution.
__________________________________________________________________________________
Multi-Timeframe Insights
__________________________________________________________________________________
HTFs (12H/1D) remain up, while LTFs correct and probe nearby supports.
1D/12H: Uptrend with controlled pullback; 114.5–116k acts as ceiling; 111.7k is the key hold.
6H/4H/1H/30m: Corrective pressure, sellers active into 112.7k–114.6k; a flush to 108.5k–107.4k can offer better asymmetry.
2H: Attempting to base above 110k; a firm reclaim over 112.7k would improve MTF confluence.
Major signals: LTF very high sell volume vs normal 1D — wait for clean confirmations before adding risk.
__________________________________________________________________________________
Macro & On-Chain Drivers
__________________________________________________________________________________
Macro tilts cautiously risk-off near term (firmer dollar, ETF outflows) even as medium-term policy shifts are supportive.
Macro events: Fed -25 bps and QT to end Dec 1, near-term hawkish tone; DXY firmer; light synchronized easing (HKMA, Saudi) and better Eurozone GDP.
Bitcoin analysis: US ETF net outflows weigh on rallies; ~111.2k support watched and ~120k pivot as the gateway to 130k+ if reclaimed.
On-chain data: Elevated LTH distribution, STH stress; reclaiming ~113k STH cost basis would aid momentum.
Expected impact: Confirms a “buy dips on confirmation” bias while keeping size conservative until USD/flows improve.
__________________________________________________________________________________
Key Takeaways
__________________________________________________________________________________
Corrective consolidation below 114.6–116k with 111.7k/110k as first defense.
- Overall trend: HTF bullish, short-term neutral/bearish.
- Top setup: Confirmed dip-buy at 108.5k–107.4k, add on reclaim > 112.7k.
- Key macro factor: Firmer DXY and ETF outflows cap upside momentum.
Patience and disciplined execution on clean signals — that’s how to win this range.

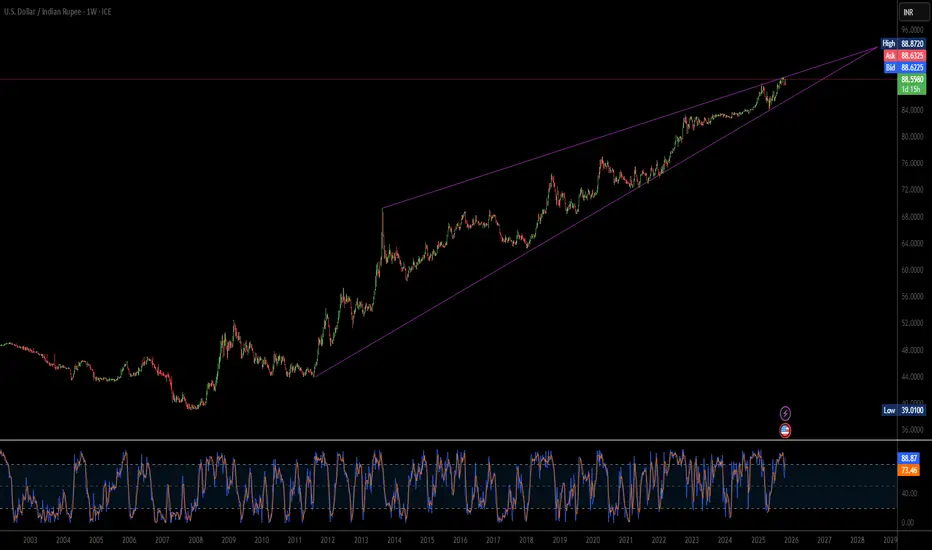
Why Is The Rupee Falling When The Dollar Is Weak?The Indian Rupee (INR) is exhibiting a pronounced, sustained weakness against the US Dollar (USD), pushing the USD/INR pair toward the 88.60 level, even as the global US Dollar Index (DXY) shows signs of softness. This resilience in the USD/INR confirms that domestic and structural headwinds—rather than external dollar strength—are primarily responsible for the Rupee's depreciation. A deep analysis across strategic, economic, and technological domains reveals that geopolitical delays and cautious monetary policy abroad are significantly outweighing any temporary relief from global dollar flows.
The central source of this structural weakness stems from two major factors: geopolitical uncertainty and macroeconomic policy divergence. The persistent delay in finalizing a comprehensive trade agreement between the US and India fuels Foreign Institutional Investor (FII) anxiety, leading to hesitant capital inflows. While FIIs showed a brief surge in buying, overall conviction remains low without a clear trade resolution. Concurrently, the US Federal Reserve's commitment to a "higher-for-longer" interest rate floor, despite a recent cut, strengthens the relative appeal of the USD. This policy stance attracts global capital to US assets, thereby limiting liquidity and increasing the cost of holding the INR.
Furthermore, India’s technological landscape adds to the structural demand for the USD. Low domestic Research & Development (R&D) investment and a heavy reliance on foreign patents mean the nation must spend more USD to import essential high-tech equipment and intellectual property. This technological deficit creates a persistent, structural requirement for foreign currency, putting continuous pressure on the Rupee. From a technical analysis perspective, the USD/INR pair's decisive hold above the 20-day Exponential Moving Average (EMA) confirms the market's bullish bias, suggesting the current trend is robust and targeting the all-time high of 89.12.
In essence, the Rupee's struggle is a complex interplay of internal and external structural factors. Until a major trade deal is confirmed, capital inflows become more decisive, or India's technological import needs stabilize, the market will continue to favor the USD. Traders must recognize that the technical path of least resistance for the USD/INR is upward, driven by these fundamental geopolitical and economic asymmetries rather than temporary movements in the global dollar index.
GC Futures – Patience While the Market Waits for a CatalystYesterday’s session was pure range — no real direction, likely ahead of Fed news and the Trump-China talks. Price continues to consolidate beneath the H4 FVG and above the Daily Low (D-L), with both sides holding liquidity.
Until we see a clean displacement, I’m sitting on my hands and preserving capital. The market’s indecision is information — it’s telling us to wait.
Key levels remain 4,046 (D-H) and 3,930 (D-L) — any clean break beyond these zones should define the next directional move.
#Gold #Futures #GC #DayTrading #NoFOMO #ICT #OrderFlow #MarketStructure

xauusd 3894 or 4060 today?October 29, 2025, XAU/USD has specific price targets. The gold price is currently around $4,018, and traders are focusing on key technical levels and the upcoming Federal Reserve interest rate decision.
Below is a summary of the key price levels to watch before the market closes today.
Analysis Type Key Resistance Key Support Primary Target Alternative Target
Technical & Scenario-Based $4,005.79 $3,951.68 $4,059.90 - $4,114.01 (if resistance breaks) $3,893.96 (if support breaks)
Bearish Correction - $3,940 $3,870 -
Range-Bound $4,010 $3,860 Movement between $3,860 and $4,010 -
🚨 Key Market Driver Today
The single most important event influencing gold's movement today is the Federal Reserve's interest rate decision. Markets are overwhelmingly expecting a 25-basis-point rate cut, and how the market reacts will depend heavily on the tone (dovish or hawkish) set by Fed Chair Jerome Powell.
Dovish Signal (Bullish for Gold): If the Fed signals openness to further easing, it could weaken the US Dollar and help push gold above the $4,005 resistance toward the higher targets.
Hawkish Signal (Bearish for Gold): If the Fed suggests this cut is a "one-and-done" move, it could strengthen the Dollar and trigger a sell-off in gold, pushing it down to test the $3,951 support and potentially lower.
💡 A Note for Your Trading
Conflicting Signals Exist: While one technical model suggests a potential rise to $4,010, another maintains a bearish outlook with a target of $3,870, contingent on the price staying below $3,940. This highlights the market's uncertainty ahead of the Fed news.
Trade the Reaction: Many analysts advise waiting for the price to convincingly break through one of the key levels ($4,005 resistance or $3,951 support) before committing to a new trade direction, rather than anticipating the move prematurely.
In summary, for the remainder of today's session, watch the $4,005 resistance and $3,951 support levels. The Fed's announcement will likely determine whether the price moves towards $4,060 or falls back to $3,894.

xauusd next target 4161?the next target for XAU/USD (Gold) is highly dependent on its ability to break through key resistance levels, with an immediate focus on the $4,161 area. The upcoming Federal Reserve policy meeting is the primary catalyst that will determine the direction.
The table below summarizes the key price levels and potential targets you should watch.
Timeframe Key Support Key Resistance Bullish Target (if resistance breaks) Bearish Target (if support breaks)
Short-Term $4,004, $3,951 $4,050, $4,161 $4,200 → $4,300 → $4,381 (All-Time High) $3,944 → $3,900
Medium-Term (e.g., 1-3 months) $3,874 - $3,878 - $4,249 - $4,300+ -
🚀 What Will Drive the Next Move?
The consensus among analysts is that the immediate price direction hinges almost entirely on the Federal Reserve's upcoming meeting and subsequent commentary.
The Primary Catalyst: The Federal Reserve
The Rate Decision: A 25-basis-point rate cut is almost fully priced in by the market. Therefore, the decision itself is unlikely to cause a major surprise .
What Really Matters: Powell's Tone: The market will react to the forward guidance from Fed Chair Jerome Powell during his press conference.
Dovish Powell (signaling potential for further easing): This would likely weaken the US Dollar and push gold above $4,161, opening the path toward $4,200 and $4,300 .
Hawkish Powell (suggesting a "cut and pause" approach): This could strengthen the Dollar and trigger a sell-off in gold, pushing it below $4,004 to test the $3,944 - $3,900 support zone .
Supporting Factors
Central Bank Demand: Ongoing accumulation of gold by central banks (e.g., India, China, Germany) provides a solid foundation, limiting severe downside moves.
Geopolitical Tensions: Factors like trade tariffs and global instability continue to bolster gold's role as a safe-haven asset.

DXY relative perf. to predict market tops.Using intermarket analysis. During expensive markets, demand for US dollar grows - and often it correlates with stock market tops. Step further - we can use intermarket analysis of DXY/SPX. Look for trend break out and Higher Lows in the structure. ✅

XAUUSD - Will Gold Continue to Fall?!Gold is trading below the EMA200 and EMA50 on the 30-minute timeframe and is trading in its descending channel. The reduction in its downward momentum in the demand range will provide us with a better risk-reward buying position. A move towards the supply range above the channel will be our next short trade!
Gold prices fell below $4,000 per ounce for the first time since October 10, following a sharp $125 decline.
According to a Reuters survey, the average gold price in 2026 is expected to reach $4,275 per ounce, while silver prices are projected to average $50 per ounce in the same year.
For 2025, the survey anticipates an average gold price of $3,400, up from $3,220 in the previous poll, while the average silver price is forecasted to rise to $38.45 from $34.52 previously.
Analysts at Nomura stated that U.S.–China relations have entered a repetitive cycle of tension, escalation, and temporary détente, likely forming a “new normal” in the long term.
Lu Ting, Nomura’s chief China economist, noted that the world’s two largest economies appear to be settling into a predictable pattern of “strain–escalation–pause”, which may define the framework of their relationship in the foreseeable future.
Recent trade talks in Kuala Lumpur hinted at a temporary easing of friction, with both sides reportedly considering limited concessions, such as extending tariff suspensions and resuming soybean imports from the U.S.
However, deep-seated disputes remain unresolved — including export restrictions on rare earth elements, compliance with trade commitments, and broader geopolitical disagreements — all of which cloud the outlook for bilateral relations.
Lu cautioned that while short-term cooperation may continue due to mutual economic dependence, long-term strategic competition between Washington and Beijing is expected to intensify.
Nomura believes this recurrent cycle of conflict and reconciliation will likely become the enduring pattern of U.S.–China relations.
Such a backdrop implies persistent volatility in global markets, particularly in commodities and technology sectors, which are highly sensitive to trade developments between the two nations.
Investors should prepare for alternating periods of optimism and renewed tension.
Meanwhile, Donald Trump’s proposed tariffs against Canada may turn into a major self-inflicted setback, as the move faces both a legal challenge before the U.S. Supreme Court and bipartisan opposition.
Next week, the Supreme Court is set to hear a case focusing on Trump’s use of the International Emergency Economic Powers Act (IEEPA) to justify these tariffs. Trump initially invoked an emergency declaration related to fentanyl to impose them — despite the fact that such powers are typically reserved for sanctions against U.S. adversaries.
The case represents not only a test of the tariffs’ legality, but also a measure of Trump’s and MAGA’s influence over the Court.
Notably, Senator Lisa Murkowski, a Republican, joined over 200 Democrats in sending a letter to the justices urging them to strike down the tariffs.
The oral arguments are scheduled for November 5, and the final ruling, which could serve as a major market mover, is expected sometime next year.
Currently, prediction markets estimate a 38% probability that the tariffs will be overturned.
At the same time, Morgan Stanley reported that U.S. dollar positioning has turned positive for the first time in several months, reflecting renewed investor confidence in the U.S. economic outlook.
This shift comes amid rising political instability in Japan and France, which has diminished the appeal of non-dollar assets and strengthened capital flows toward the greenback.
Strategists at the bank added that demand for downside protection against the dollar has declined, indicating that investors perceive a low risk of a sharp correction in the near term.
Nevertheless, Morgan Stanley warned that this uptrend might not be sustainable — if U.S. economic data, particularly employment figures, fail to show significant improvement, the dollar could again face renewed downward pressure, and rate-cut expectations from the Federal Reserve could rise.
Finally, Treasury Secretary Scott Bassent confirmed that five candidates have been shortlisted to succeed Jerome Powell as Federal Reserve Chair:
Christopher Waller, Michelle Bowman, Kevin Warsh, Kevin Hassett, and Rick Rieder.
Bassent stated that one more round of interviews will take place, and he plans to submit the final shortlist to President Trump after Thanksgiving, with a final decision expected before year-end.

Gold Sitting on the Edge – Liquidity Sweep Before the Bounce?Monday didn’t give much movement, and price is now hovering around last week’s low.
I’m expecting a liquidity sweep of the current levels — likely taking out the Daily Low before moving to fill the full Weekly FVG below.
Short-term bias is bearish for the Asian session, but I’ll be watching closely for a shift once that FVG is filled.
If absorption shows up after the sweep, I’ll flip long for the bigger move higher into midweek.
#FuturesTrading #Gold #ICT #LiquiditySweep #NOFOMO

GOLD Bull Market Over?Gold has fallen yet again today. Busting through some major technical support.
Gold is falling for 3 main reasons;
1. Trump / XI (USA vs China) meeting is expecting positive negotiations.
2. Mega Cap Tech Earnings: markets love to chase tech higher.
3. FOMC rate cut expectations.
We believe gold had a strong chance at retesting the daily 200 MA.
Picked up some GLD calls today.

Dollar In Range-And It May Not Be Broken Soon...Stocks are pushing nicely to the upside after some optimism that a deal could be reached between the US and China regarding tariffs, as reported this weekend by Trump himself. He’s clearly driving the market into a risk-on mode.
However, it’s interesting to see that the dollar is still going nowhere; the only FX market showing a more decisive move is the Aussie, which is naturally benefiting from this story.
Looking at the dollar index, no one knows where it wants to move but basic analysis in ranges is simple; "down from resistance, up from the support".
Keep in mind we’re still missing the latest US jobs data, so the outlook for further cuts remains uncertain, and that could keep the dollar moving sideways for now.
Have a nice trading week!
GH
General Market OutlookHello, I want to talk about markets in general before the week start.
The Federal Reserve is trying to navigate with limited data. Recently, after Governor Waller used ADP data without authorization, the Fed lost access to ADP’s high-frequency employment data as well.
CPI and core CPI both came in at 3%, slightly below market expectations but in line with Cleveland Fed and Bloomberg models. With inflation not overheating, there is little reason for the Fed to delay rate cuts in its remaining two meetings this year, though these cuts are likely already priced in. The real focus will be on what FED will do in 2026.
This week brings meetings from the Fed, ECB, BOJ, and BOC, while the Trump–Xi talks will take center stage. For me, the most important event will be the US–China negotiations. China holds a structural advantage: its exports have remained resilient despite US tariffs, supported by rising trade with South America, Africa, the EU, and South Asia. Meanwhile, the US remains heavily dependent on China for rare earths, a situation unlikely to change soon. However, China’s top priority remains its economy, which should keep the door open for compromise and negotiations.
Also, keep an eye on the shutdown situation and upcoming earnings reports.
US bond yield is falling, now a battle around 4% is ongoing for 10-y yield. If it bounced from 3.85% trendline dollar might try to recover, but so far I don't see any reason for a dollar jump, rather the tight range between the trendline from 2011 and 100 resistance likely to continue.
EURUSD is trying to recover with slighlty bullish trend but this trend could turn into flag formation easily if dollar index to make a move towards 100. I expect EURUSD to continue recover with strong data from EU and weaker data from US. If shutdown extends further, both stock market and dollar might turn bearish.
There’s nothing new to add for USDJPY beyond the previous analysis. If the base case scenario unfolds, it will support the dollar index retesting its trendline in the coming weeks.
Nasdaq is still trending high with insane amount of AI investments and better than expected earnings. High valuations, shutdown and China fears are not in the spotlight yet. As long as Nasdaq trend channel continues, no reason to back out bullishness, but careful if it break because corrections often came very hard.
Crypto market is yet to recover after the massive sudden crash. Bitcoin is less effected, but still has a problem. If 114k regained, maybe signs of recovery will be more clear. But the danger is not over yet.
My base case for gold to hold above 4000 and recover towards 4250. 4160 is a key resistance this week. I expect gold is getting to a long term peak, likely to hit before the year end but still has some way to go. I will write about Silver's long term cycle in a couple of days so stay tuned for that.

Stock Market New Highs on CPI? Lotto call option? Tomorrow is the CPI report.
Inflation headline number is expected to be 3.1%.
We will likely see a positive reaction tomorrow which should send the S&P500 to new all time highs.
If we gap up into new all time highs be very careful as this usually gets sold into.
We took a lotto call option on NASDAQ:CRML with members.
This is a pure speculative dead cat bounce play.

NO TRADE ZONE FOR GOLD!!!I was Looking for price to proceed with being bullish but it decided to breakdown. I'm not ready to buy again just yet. Need to see a full sweep on levels first. I think im going to sit on hands for the rest of the week.

Tech & Rates: The Unstoppable Force Driving USD/JPY SkywardThe USD/JPY exchange rate has exhibited a clear upward trend, recently touching a one-week high before a slight pull-back to around 151.74. This sustained yen weakness reflects a convergence of factors across global finance, domestic Japanese policy, and international relations. Traders must analyze these multi-faceted pressures to accurately forecast future movements.
Domestic Japanese Fiscal Expansion
Japan's new Prime Minister, Sanae Takaichi, is preparing an aggressive economic stimulus package likely exceeding last year's $13.9$ trillion yen ($92.19$ billion). This expansionary fiscal policy aims to counter rising inflation and support household incomes. Markets anticipated this policy shift, contributing to the yen's $2.6\%$ decline this month, its biggest monthly drop since July. A combination of significant fiscal spending and a challenging relationship with the central bank typically weighs heavily on a currency.
Geopolitical Instability and Safe Havens
Global political risk typically favors the U.S. dollar, cementing its position as the world's primary reserve currency. The ongoing $\mathbf{U.S.}$ $\mathbf{government}$ $\mathbf{shutdown}$, now into its third week, injects domestic uncertainty. This standoff complicates the Fed’s data-driven decision-making, potentially reinforcing expectations for rate cuts, which can weaken the dollar. Despite this, the dollar index (DXY) remains resilient at $98.84$. A brief drop in gold prices recently triggered market volatility and a rebalancing of safe-haven assets, briefly allowing the yen to climb. Yet, the persistent US political gridlock maintains a background risk premium that supports the dollar as the ultimate haven.
Geostrategy and Technology Competition
Geostrategic competition, especially involving China, supports the USD through capital flow redirection. Diversification and resilience strategies in global supply chains lead to investment shifts toward Southeast Asia and other strategic areas, often bypassing the yen. Furthermore, the dollar benefits from the High-Tech sector's dominance. High-tech and cyber security, and the associated intellectual property (IP), including patent families, are key drivers of economic growth. A country's strength in technology, quantified by international patents, significantly impacts its currency's global competitiveness and valuation, often bolstering the dollar’s perceived "soft power" relative to the yen. (www.worldscientific.com)
Conclusion and Outlook
The primary drivers of the USD/JPY's ascent are the widening interest rate differential and Japan’s expansionary fiscal outlook. While a short-term correction occurred due to safe-haven rebalancing, the structural forces remain dollar-positive. The US government shutdown presents a risk, but its historical impact on the dollar has typically been modest and short-lived. Traders should expect USD/JPY to test new highs, especially if the new Japanese fiscal policy exacerbates bond market concerns.

GBPUSD 1H Analysis: Bearish Pressure Builds After Break 📊 GBPUSD – 1 Hour Analysis (SELL)
Technical Outlook:
Bullish momentum is fading, and selling pressure is building after the recent break.
My trade plan is on the SELL side; target level: 1.33564 📉
Fundamental Analysis:
On the U.S. side, the strong dollar narrative and the Fed’s data‑driven stance continue to support USD strength.
Meanwhile, uncertainty around the U.K.’s growth/inflation balance and tighter financial conditions are weighing on GBP.
Together, these factors reinforce the downside bias in the pair.
🙏 Every like is my biggest motivation to keep sharing these analyses.

USD Index: Bearish for today?At least for today it looks like dollar index is bearish.
Waiting for #1 BOS - as initial confirmation that bearish is taking over.
#2 BOS - should provides a confirmation that bearish is on its way.

Dollar Index (DXY): New Bullish Wave Confirmed?!
Here a quick follow-up for my recent idea for Dollar Index.
The price retested a recently broken major horizontal structure cluster
and even went below that with a bearish trap.
A rising trend line was respected as a strong vertical support
and we see a bullish continuation now.
I think that we can expect a rise at least to 99.3 level now.
❤️Please, support my work with like, thank you!❤️

Gold Above 4300 – Watching for FVG Fill Before Next LegPrice consolidated all of yesterday’s Asian and London sessions before breaking bullish through NY, clearing the 4300 resistance.
Today, we’re holding above that breakout level and sitting just beneath the weekly high at 4398.
A 4H FVG rests below price around 4345–4360 — that’s my first area of interest for a retrace and possible continuation higher.
If price dips to fill that gap and shows strength, I’ll look for a long toward 4398–4420.
Otherwise, I’ll wait for a clear reclaim above the weekly high before confirming continuation.
Staying patient tonight — the easy part is waiting for the market to tell me what it wants to do.
#FuturesTrading #Gold #ICT #PriceAction #NOFOMO

Weekly Outlook — Gold Futures (MGCZ2025)Price is sitting between key levels after last week’s explosive move.
I’m watching 4,300 as immediate resistance — if bulls can’t hold above this level, I expect a sweep toward 4,200–4,150 (H4 + Daily FVGs) before continuation.
Monday might just be a setup day, building liquidity for a Tuesday/Wednesday move.
Key Levels:
🟦 4,392 – Previous Weekly High
🟨 4,300 – Near-term resistance
🟧 4,200 – Daily Low / Support zone
🟩 4,150 – H4 FVG top
Let’s see how Monday sets the tone for the week.
#Gold #Futures #TradingPlan #ICT #PriceAction

EUR/USD 4H Analysis EURUSD provided a double bottom and rallied it's away towards 1.17 then pulling back shortly after. I'd like to see the market reverse and continue the bullish rally after it's done with the pullback.
WHAT IS THE EXPECTED RETURN and DURATION of this GOLD Bull Run?Well, when measured against the DXY index, a clear trend becomes apparent.
A Golden Bull typically lasts about 40 quarters, which is essentially 1 decade (give or take a quarter).
Similar to #Bitcoin and its cyclical bull markets within a larger secular bull, the returns tend to decrease over time.
However, it seems that a triple-digit Gold price relative to the DXY is on the horizon at the very least.
What would that look like if the DXY were to hit a new low around 69? This would suggest a Gold price of $6900 at a ratio of 100:1.
A Gold price of $12K with a DXY of 80 only requires a ratio of 150...
Thus, a five-digit Gold price is certainly within the realm of possibility.
I have forecasts that extend as high as $12K.
