Gold Pauses Ahead of FOMC – Big Move Loading?Gold has been consolidating just below its all-time highs as traders await the Fed’s rate decision tomorrow.
Key levels on my chart:
Resistance: ATH 3737.5 → 3749.8 (DH)
Support: 3715.2 (WH) → 3711.6 (DL)
If the Fed cuts rates more aggressively than expected, Gold could break higher and run liquidity above 3750. On the flip side, a smaller cut or hawkish tone could give the dollar strength, driving Gold lower — first target 3700 → 3680.
I’m staying cautious during Asia and London, expecting chop until NY session. My focus will be on how price reacts after the announcement — that’s where the cleaner opportunities should come.
Patience is key here — the real move is still loading.
Dollar

Dollar Index (DXY) – Watching Both Sides LiquidityOn the daily timeframe, we can clearly identify liquidity resting on both sides of the chart:
Relative equal lows acting as sell-side liquidity.
Low-resistance highs representing buy-side liquidity.
From my perspective, the main draw on liquidity remains the sell-side lows. However, before targeting that area, price may first reach higher to grab the buy-side liquidity. Once this liquidity is collected, I expect a potential shift in momentum and a move to the downside.
💌It is my honor to share your comments with me💌
🔎 DYOR
💡Wait for the update!

Fundamental Market Analysis for September 16, 2025 EURUSDThe euro is gaining support against other currencies thanks to comments from the European Central Bank (ECB). European Central Bank (ECB) board member Isabel Schnabel said on Tuesday that interest rates in the eurozone are at a good level, adding that risks of inflation remain prevalent. Schnabel said growth is likely to exceed potential as domestic demand offsets the decline in exports.
ECB board member Peter Kazimir said on Monday that policy should not be adjusted due to “minor deviations” from the inflation target, while warning of the risks of rising inflation. Kazimir added that interest rates had been brought to a neutral level.
The EUR/USD rose as the US dollar (USD) weakened on growing expectations that the Federal Reserve (Fed) would cut rates by 25 basis points at its September meeting on Wednesday. Markets also see the likelihood of a more significant 50 basis point cut as low, while anticipating continued policy easing through 2026 to counter the risk of recession.
Trade recommendation: BUY 1.1805, SL 1.1770, TP 1.1860

Gold (MGC) – Watching 3725 Key Decision Point Ahead of CPIGold surged yesterday with aggressive bullish momentum, tagging into the 3725 BFH level. Price is consolidating just beneath it as we head into Tuesday’s London and NY sessions.
Upside: Break and hold above 3725 opens the door toward 3750+.
Downside: Rejection at 3725 + breakdown through 3700 could shift structure, with targets at 3680 and 3662.
CPI & Unemployment data in the NY session may provide the catalyst.
📌 Patience until reaction confirms — 3725 is the key battleground.

Will the US Dollar Run?Here we have a classic invert head and shoulders in validated if we take out the previous higher lows, but with how things are going, I don't see that happening, especially with Trump being in office you can argue all you want, but the charts don't lie

Head and Shoulders Pattern on U.S. Dollar Index (DXY) – Bearish Overview of the Idea (as shown in the chart)
The chart illustrates a Head and Shoulders (H&S) reversal pattern forming on the U.S. Dollar Index (DXY). This classical technical pattern signals a potential trend reversal from bullish to bearish.
Left Shoulder: The first peak followed by a pullback.
Head: A higher peak, forming the top of the pattern.
Right Shoulder: A lower peak compared to the head, roughly equal to the left shoulder.
Neckline: A support line connecting the lows between the shoulders. Once broken, it indicates potential bearish continuation.
The chart highlights:
A breakout below the neckline.
A retest of the neckline (common in H&S setups, where old support becomes resistance).
A projected downside target aligned with the height of the head-to-neckline move.
Detailed Analysis
1. Pattern Identification
The H&S is clear: higher high (Head) flanked by two lower highs (Shoulders).
The neckline is slightly ascending, but once broken, it signals sellers stepping in.
2. Breakout Confirmation
Price broke below the neckline, confirming the bearish pattern.
The retest at ~97.62 shows rejection, strengthening the bearish outlook.
3. Bearish Projection
Technical rule: the expected downside target is approximately equal to the distance from the head to the neckline, projected downwards from the breakout point.
The chart projects a move toward 97.25, which aligns with the marked support zone.
Timing
The projection points to Monday, 15/09/25, suggesting this bearish move may unfold in the upcoming trading sessions.
Walkthrough Thought Process
Think of the market like a battle between buyers and sellers:
The buyers pushed price higher (Head), but then failed to sustain strength at the right shoulder.
When price breaks the neckline, it shows sellers are gaining control.
The retest confirms that what was once support (neckline) has now become resistance.
This setup gives traders confidence to enter a short (sell) trade, targeting the projected downside.
Trade Idea
Entry : After retest rejection around 97.62.
Target (TP) : 97.25 (support zone based on H&S projection).
Stop Loss (SL) : Above the right shoulder at 97.80 (to protect if pattern fails).

DXY at Major Support – Dollar Ready to Rebound?Today, I want to analyze the DXY index ( TVC:DXY ) for you. First, I must say that this week, US indexes can have an impact on the DXY index trend .
US indexes to be released this week:
Core PPI m/m: Tomorrow
PPI m/m: Tomorrow
Core CPI m/m: Thursday
CPI m/m: Thursday
CPI y/y: Thursday
Unemployment Claims: Thursday
Prelim UoM Consumer Sentiment: Friday
Prelim UoM Inflation Expectations: Friday
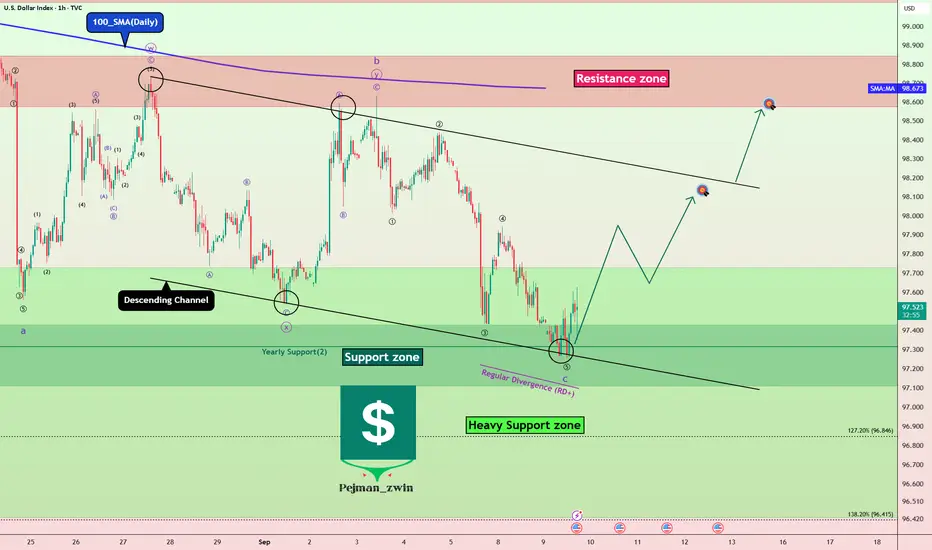
The DXY Index is currently moving near the Support zone($97.989-$97.834) , Yearly Support(2) , and the lower line of the descending channel .
In terms of Elliott Wave theory , it seems that the DXY index has managed to complete microwave 5 of the main wave C . The corrective structure is of the Zigzag Correction(ABC/5-3-5) type.
Also, we can see the Regular Divergence (RD+) between consecutive valleys .
I expect the DXY index to rise to at least $98.07(First Target) before the US indexes are announced.
Second Target: $98.56
Stop Loss(SL): $96.997
Note: With the DXY index rising, we can expect a correction in Gold( OANDA:XAUUSD ), Bitcoin( BINANCE:BTCUSDT ), and major Forex pairs (dollar strength).
Please respect each other's ideas and express them politely if you agree or disagree.
U.S. Dollar Index Analyze (DXYUSD), 1-hour time frame.
Be sure to follow the updated ideas.
Do not forget to put a Stop loss for your positions (For every position you want to open).
Please follow your strategy and updates; this is just my Idea, and I will gladly see your ideas in this post.
Please do not forget the ✅' like '✅ button 🙏😊 & Share it with your friends; thanks, and Trade safe.
Gold Setting Up for Weekly Low Sweep – Watching 3650sGold has stalled out at the highs this week and is showing signs of exhaustion after a strong 2-week bullish run. Thursday’s close left us hovering just above key support in the 3650s.
For Friday, I’m watching for a break and close below yesterday’s low on the 1H chart. If we get that confirmation, I’ll be looking for continuation shorts targeting Monday’s low and potentially the 8HR FVG around 3600–3620 to close out the week.
If bulls defend this level again, then the range may extend — but the cleaner move is down into untested imbalances below.
This sets up Friday as a key day:
✅ Break yesterday’s low = downside liquidity run in play
❌ Hold support again = chop/range into next week

Is there a chance of a 50 basis point cut? SPX traded to new all time highs today.
Many stocks had blow off move or breakout candles.
Market makers cleared out lots of short interest today.
The employment data is starting to get worse.
A new 2 year high in initial jobless claims.
Markets rallied on dollar and yields weakness.
At some point the markets will price in a recession. Growth stocks need to be monitored closely.
We took profits on Tesla & Baidu today.

Gold Stalls Ahead of CPI – Pullback Setup Loading?Gold has been aggressively bullish for the past two weeks, but yesterday showed the first signs of exhaustion. Price stalled under the daily high ($3,690), leaving liquidity below untouched.
With CPI and unemployment claims scheduled during the NY session, we may see the dollar strengthen — providing the catalyst for a deeper pullback on Gold.
Key Zones I’m watching:
Upside Liquidity: Sweep above $3,690 (D-H) could serve as a trap before reversing lower.
Downside Targets:
$3,654–$3,652 (D-L/W-H confluence)
$3,600 node
$3,530–$3,550 (H4/8H FVG rebalancing zone)
If this week is to stay bullish overall, a proper low for the week forming inside the H4/8H FVG would set the stage for continuation higher. For now, patience until price makes its move around these zones.

EURUSD: London Session Bullish BiasOn the higher timeframe, I maintain a bullish outlook, with the BSL identified as the draw on liquidity. This serves as the main directional bias.
Shifting to the 1H timeframe, price action shows that Monday’s low was purged, which often signals liquidity grab. Following this purge, the market reacted bullishly, suggesting potential accumulation of buy-side pressure.
In addition, the formation of a +FVG (Fair Value Gap) adds another layer of confluence supporting the bullish scenario. This imbalance aligns with the expectation of further upward continuation.
With these factors combined, I consider the 50% retracement of the previous leg as the initial target for this move.
💌It is my honor to share your comments with me💌
🔎 DYOR
💡Wait for the update!

Fundamental Market Analysis for September 10, 2025 USDJPYThe Japanese yen (JPY) is fluctuating within a narrow trading range against the US dollar during Wednesday's Asian session amid mixed fundamental signals. Expectations that domestic political uncertainty could give the Bank of Japan (BoJ) more reason to slow down interest rate hikes, coupled with optimistic market sentiment, are undermining the yen's position as a safe-haven currency. In addition, the overnight recovery of the US dollar (USD) on Tuesday helped the USD/JPY pair recover from its daily decline and return closer to its August low.
However, yen bears seem reluctant to make aggressive bets amid a growing understanding that the Bank of Japan will stick to its policy normalization course. On the contrary, the US Federal Reserve (Fed) is expected to resume its cycle of rate cuts next week, which could hinder the growth of the US dollar. In addition, diverging expectations regarding the policies of the Bank of Japan and the Fed could play into the hands of the lower-yielding Japanese yen and help limit the upside for the USD/JPY pair. Traders may also prefer to refrain from action ahead of Wednesday's US producer price index (PPI) release.
Trade recommendation: SELL 147.20, SL 147.65, TP 146.00

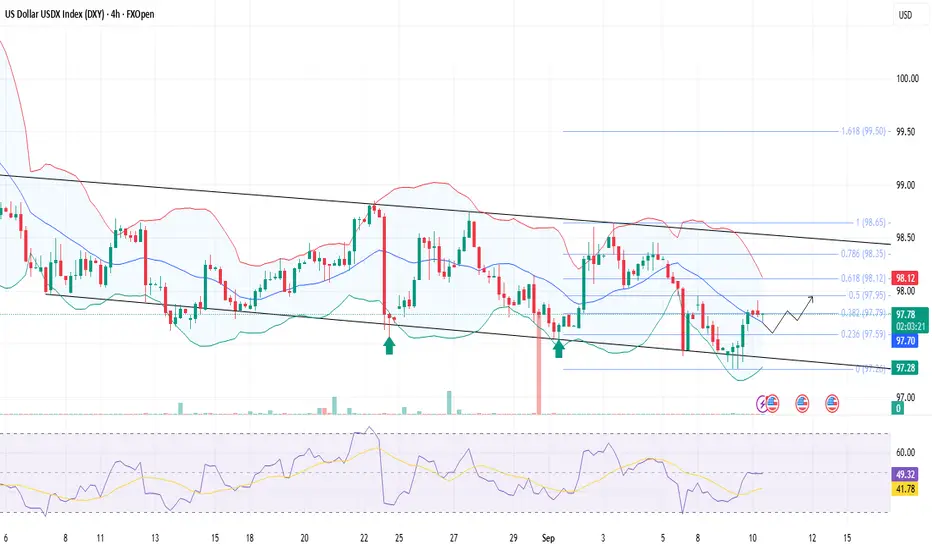
Brief Analysis of US DXYDXY is trading around 97.70, while trending within a descending channel formation, and holding above 97.60 (Fib support 0.236), with resistance seen near 97.80–98.00 zone.
The RSI is rising and holding near 46, showing mild recovery momentum but not yet strong enough for a breakout.
However, prices have taken a support at the middle Bollinger band, which might lift the dollar a little higher.
Price action suggests consolidation inside the descending channel; intraday bias stays neutral-to-bullish above 97.60.
PPI data stronger than expected could lift DXY toward 98.35–98.50, while weaker data may pressure it back toward 97.30.
The 10Y auction outcome will also guide direction — higher yields can support the dollar, while softer demand may weigh on it.
Gold is Finally giving a pullback! I have been looking for this move to happen for 2 weeks and they have been so aggressively bullish. If we can get a close below yesterdays high before we come into the killzone i think they will continue to drop at least till news during NY session in the morning.

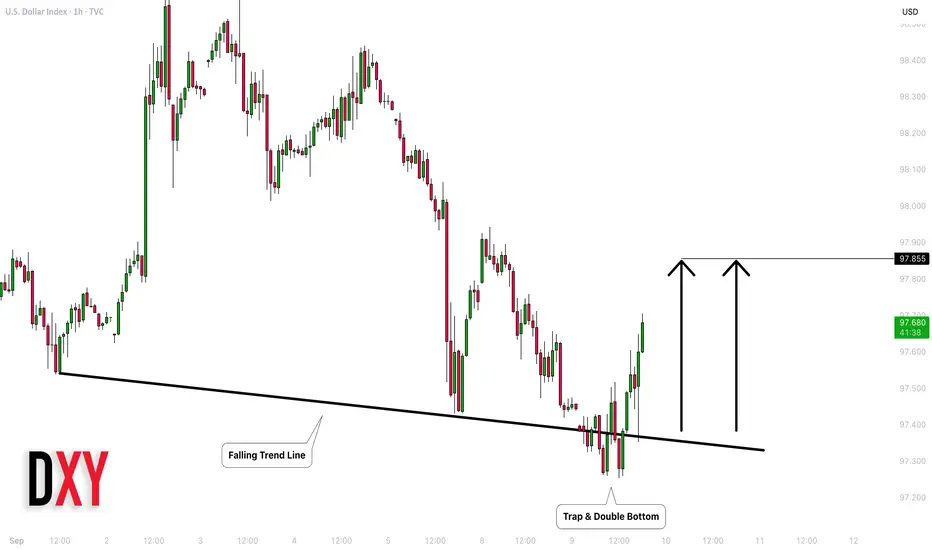
DOLLAR INDEX (DXY): Time to Recover
US Dollar finally shows a strength after a false violation
of a trend line and a formation of a double bottom pattern.
The index will most likely reach 97.85 level soon.
❤️Please, support my work with like, thank you!❤️
BUY DXYIn todays session we will be taking buys on the dollar. Our entry is at 97.677 and stops are below 97.480 targets are above 98.40. Use proper risk management.

New Week on Gold and we could continue strong!Im looking for price to give more indication on what it wants to do but we are bullish until proven otherwise. for now its is not in a position that I would like to enter cause it can go either way. All moves are scalps untill we get some more breaks on levels.

CBDCs, Cryptocurrency, & the coming Redenomination RevolutionDisclaimer: this is not financial advice - this is strictly speculation and scenario planning, and totally not drawn on privileged information from powerful people. Please consume responsibly.
Let's set aside memecoins, rugpulls, and corpo coin acquisitions to focus on what actually matters: macro.
I'm married to the money, so I follow macro wherever it goes. And it's going into CBDCs and cryptocurrency. You could say it started in the past 12 mos with the GENIUS bill, tariffs, BRICS' concept coins, etc but the truth is more devious than that. The macro perspective is much more than the flow of money, its the sentiment and interest of policy makers, national actors, and IGOs. In other words, groups that make money through passive taxation create macro conditions to control or create outcomes that influence how you make or spend money. They are interested in strategic payoff over cashing out. This means the way they look at crypto is different than retail and investors. As groups, you seek legitimacy for a profit payoff, they seek strategy for a power payoff. Fiat currency is not some platonic ideal willed into being by the laws of nature, it's entirely an instrument of the national interest. In other words, it exists only so long as policymakers find it strategically useful.
So let's look at their strategy.
For almost three years now, your world leaders and central bankers have been preparing for a reserve currency transition scenario. They've made sudden pivots to programmable currency R&D, they've been hoarding gold into CBs and taking extra steps to keep it quiet, they've been making strange comments about fantastical banking crisis scenarios, adjusting payment options for hydrocarbons (the USD is an international soft-peg), signaling the desired end of the dollar reserve (or oddly making protecting the dollar reserve part of their political platform), and building cross-border systems (BRICBridge/mBridge) to facilitate non-SWIFT or SWIFT legacy exchange/insurance/settlement capabilities. Certain essential economic entities in the West have been prepped as well but are not yet in position to disclose. Meanwhile, Ray Dalio is already identifying our monetary order as the primary vulnerability. He's not the only old rich person to notice. Buffet is done with markets by EOY. You could say that value investing is retiring.
Contrary to popular opinion, this reserve currency transition will not take place as an Orwellian CBDC takeover or some BTC moon shot, but will instead be pitched as a redenomination opportunity - likely while GSIC banks are closed to customers (including ATM withdrawals and transfers and social payments or welfare services).
Before I get into the why this will happen, let's briefly look at the fragility of the modern monetary system under fiat.
If you think of the economic macrosystem as a living body, then you can understand, especially from recent memory, how a global infection could quickly bring just about everything to a halt. The lifeforce of the economic-being is the free-flow of USD. Powell has sufficiently proven this. In fact, you could almost argue the last 5 years have been the perfect demonstration of this gameplay loop. But you can't mistake the heart for the entire circulatory system. Liquidity is a digital dependency today. If the power goes out, there is no liquidity. If Window's crashes, there is no liquidity. If Crowdstrike gets hacked, liquidity is grounded (and air travel canceled). Liquidity is a luxury. It has been a luxury for all of human history. Only in times of conventional peace and American-led globalization have people begun to delude themselves otherwise. It will not work they way most think in tough times. Especially in our just-in-time widget meets server-based-bookkeeping era. The boardgame of money has never been flatter or more fragile. In an age of infinite KYC and a Bigger Brother, a major ATM corralito will not look like your Great-Grandfather's breadlines. Accounts will be electronically frozen (thus no withdrawals or personal payments) and social payments will be halted for several days or even up to several weeks (thus no welfare). Due to incredible complexity risk, capital controls will be applied like circuit breakers to shut everything down. This is how it will be done in major countries and how it has been done in small countries in recent years. M1 M2 M3 will be iced by natsec nitwits and placed under conservatorship. They will give you any and every excuse. Power outages, Russians, 4chan hackers, Iran, North Korea, Powell, Biden, a virus, weather, a disaster, Chyna, anything. They might even blame me.
To be truly forward in global macro, having an understanding of financial securities is not enough. National securities are a necessary intersect. If the NYSE went down unexpectedly for a few days, it would in effect generate a "stroke" for the velocity of the USD. Only one link in the financial accounting chain needs to be halted to warrant shutting down the entire electronic transaction system. There is no fractal redundancy, so to speak - everything is connected and dependent on that largely centralized and live bookkeeping data feed, otherwise the whole body gets hospitalized. This is the great weakness of centralized finance and merchant services and I'm sure I'm preaching to the choir here.
Only M0, select banking accounts (some community/credit & a chosen GSIC or two - IE, not Deutsch Bank), and alternative banking through cryptocurrency, will operate in that short window until your country's cartel sets a withdrawal rationing figure and initiates redemption options for the redenomination process. This process would likely involve the favorite GSIC (in the US) JP Morgan & the Post Office - giving national coverage to all area codes. You would convert your fiat, likely in cash and at a flat rate exchange that would be difficult for the layman to valuate, and receive the new notes. It could take several days to over a week before the rationing window is brought online. And even longer for the redemption system to be in place to convert federal notes to treasury notes (TL: CBDCs). These treasury notes will be backed by national assets - varying by nation, but always playing to their strengths. In the US, this means energy commodities, PMs, and the strategic crypto reserve and associated coins that service cross-border activity. The latter is the big money play, and has specifically been legalized through GENIUS to facilitate the merchant/business level transition when that occurs (the business-level redemption process will be aided by current crypto capability - which we will get in the DD section). I don't know if this board cares about PMs, but as a general standard, most nations that go through redenomination (a figure in the 100s) will opt to double or triple PM reserves (current standard is 20%), and will be interested in cross-border cryptocurrency (mBridge and/or crypto for BRICs, most of the G88, and potentially Eurozone). The reserve currency system under the US will come to an end at this point without any legal moves necessary to close the Federal Reserve. Initially, this will seem like a huge problem for the US alone. In reality, the opposite will be true. If you're a shoemaker in that pitiful collection of tourist destinations we call the EU, this is especially for you - because the fight over a national versus a continental currency solution could paralyze you all further. To wit, for the US and the world: it will likely mean the end of the housing market as a game of musical chairs, which will be the end of the global monetary system under its current paradigm for all major nations.
Now I'm not trying to create fear and panic, even though that's the main thing this website does. No one will starve or get sent to the streets during a cash crash in a developed country in the contemporary era. The situation will start as a misunderstood market event. But there will be a Bretton-Woods tier recalibration at a national (likely international) level to follow shortly after. The "forum building" stage of this event has already begun. Tariffs are revealed to be part of broad but messy geopolitical strategy, the escalation of which will engage the monetary system itself (goods>ports>share listings>national bonds). You will see that sequence begin to play out in the months to come, especially after the Rio Reset dud and the Swiss paper metal tariff. Trump's "deals" with certain countries keep getting delayed or reneged. He will continue his holding pattern on this matter, switching between punitive and TACO to extend the tariff negotiation horizons.
1.Global Blocks
The CCP are positioning to replace their dependency on the US-led Rules Based Order. When foreign policy suits and grey moustaches say 'RBO X' or 'US superpower Y', they mean reserve currency and maritime system dominance. It all comes down to coins and boats, as it always has. For our purposes, only the former is of interest (but buy all your high end electronics soon, because further tariff escalation will draw in shipping and port strategies - even if we freed up Panama beforehand). This isn't the right board for the investor note from hell, but all indications are a go for a reserve currency challenger framework to be officially announced Q4 or H1 of 2026. Most ongoing projects intend to connect commodities to currencies. This is necessary to build an alternative SDR. Certain nations and entities in the ME will be likely facilitators and front men for this framework (particularly to ease or lobby the G88). This is battlelines over bucks. Your favorite loose lips sink ships guy already came out rambling about it when he posted out of the blue about BRICs challenging the USD. I hope you all understand by now that when it wasn't a topic on Fox and Friends, then it's because he repeats what he is told in private.
When China introduces a settlement CBDC (with Russian, various Eurasians + some MENA, and potentially Brazilian support), their international accounting will require reserves to be interchangeable with other CBDCs. These reserves will be similar to the Special Drawing Rights, but include commodities (particularly those favorable to the majority of partners; aka what they produce or already hold). This means more gold and possibly silver, to start (imagine going from 20% standard gold reserve holdings to 40/60 + 10 in silver). Later platinum, lithium, uranium, and other frontier tech minerals which will be increasingly valuable and likely included. Regardless, this transition will push Chinese investors (retail and institution) out of UST (even if the tariff threat has ended). It's not a reserve for them any more, it may even be illegal to hold UST over a certain amount. That could happen overnight. The inevitability of this sequence shouldn't be underestimated. Many of the big holders of US bonds, aka those with a stake in the ticker we call USD, are not friendly at best. Others are always looking for ways to hedge their risk. This is not the free-market as you understand it. It's being Eli Lilly but your biggest stakeholder is RFK Jr. You know that's not gonna last, right?
For Europe, the reactive risk is closely related to disaster or conflict risk. Tariffs might be enough too. I'm leaning towards Germany or the UK accelerating the contagion for the broader continent. German manufacturing and energy are critically vulnerable. German PMI has been in effective contraction for 27 of the last 30 some months, and last year saw a record-breaking number of bankruptcies in the country. Both UK or Germany would handle an economic downturn poorly due to rising populist movements jumping on alternatives ( = national bond credit risk = currency vulnerability). The possibility of a second Brexit event following a commanding populist return is not priced in. Likewise, another pandemic or an expansion of Russia's war would lead to a tap out of EU economic unity. Annoyingly, the French and Germans are unlikely to search for an economic relief package of a conventional nature or one that is associated with American interests. In other words, they will be working with ME and Asia if the EU does not guarantee European continental harmony on a new Bretton-Woods framework (which I don't think they will).
Japan also falls into the reactive risk category. The question is the cause package. They have no cushion and all it takes is a little shove. Yes they has a high savings rate, but purchasing power and their import dependencies (high-pop island country) negates any security they think that will provide. It's unlikely 3rd world exporters will keep the basic necessities flowing (think in terms of virtual water exports) for the next GFC or summer famine/disaster. 3rd world imports and access to cheap food underpins much of the shadow economy for Asia (see local news over rice cost) - so consumption would crash along with rising unemployment (uncaptured but real) - and the BOJ has no room to stop unemployment without sacrificing their national corporate champions (RIP Buffett) (and thus more unemployment in their zero-entrepreneurial environment). All of this is a pretzeled way of saying that conventional economic shocks could trigger the cash crash, or vice versa. Unconventional risk - like MENA cyberwar risks (who knows what blowback we might face after Iran), or even geophysical concerns like another "1000 year event" (happening every month now) but this time in a major financial area like Tokyo or SF (do you buy or sell disaster bonds in that scenario?). Suffice to say, the unconventional supporting fuel will be there. No one ever signals the big deflationary event to the greater public. But rest assured my fellow stallions, the leading signal flares for the USD are the health of the CNY, JPY & EUR. The rest is just conversation.
As mentioned, the ensuing crash will be salvageable at a policy level, and thus not an inevitable depression, but only after the Bretton-Woods process comes to surface and settles, which could take most of 2026/27. This will be your golden crypto opportunity.
2.Opportunity DD
Unlike the last global financial crisis, cryptocurrencies and blockchain tech are now an available solution for short term cash access and long term platform use. They are already a wedge in the US economy. People will vote with their wallets to protect their purchasing power by moving into liquidity (cryptocurrencies). Thus the demand for respective nations/regions to produce their own national digital currency to offset will rise.
This isn't to say that physical coins (especially silver) won't be in a state of colossal demand (silver at 180 by 2029). But because most consumer and business transactions, debts, liabilities, taxes, etc still happen by digital bookkeeping, then cryptocurrencies (stablecoins in particular) will take priority until a national/international alternative is released. Which will come very quickly - likely by late summer of 2026. Crypto will remain bid as a trust arbitrage trade afterwards.
I am providing this ahead of time, because a gradual buy in is the safest and most reasonable way to leave a mark on the market.
TO OWN (in the interests of crypto):
1.PMs - physical ideally or by exposure to miners and mining ETFs. I have an 8,000$ price target for gold by 2029 (in 2025 dollars). I have 180$ price target for silver by 2029 (in 2025 dollars). Platinum = higher. I could go on and on about PMs. Decades ago I had a simple question: do prime mines sell gold and aggregates to government customers without reporting it? To answer that question, I am happy to report that I am still alive today. If you don't believe in internet magic money or virtual math money is too complicated, this asset is your first stop. It's a Golden Age. Take the hint. See KGC, GLD, GOLD & GDX.
2.Commodities - Lithium. Copper. Aggregates. Historically a great way to make money if you like buying Russian billionaires their yachts, creating nightmare company towns in central Africa, or funding "mining" companies that are fronts for the military industrial complex (MLM & MP = strong buy).
3.JVs - sophisticated only (which is a legal definition, not an aspiration). Not RE though (even utility related). All those watch-collecting power plant andy's on CNBC will make some money, but not as much as they think.
4.C-Word - WSB has the F-Word, Trump has the N-Word, and we have the C-Word. Again I'm preaching to the choir here, but it needs to be said anyway. As mentioned in the next section, there will be a valuation wild west period in which the shelf-stable stablecoins, other coins, and blockchain platforms will be used by developing countries and rich countries alike to fill in interoperability gaps and as a natural solution based on cost, availability, and immediacy for retail and small business needs. Only the most totalitarian countries, see Europe and China, will gatekeep over this. I strongly suggest buying and holding any digital currency currently settling it's legal hearings in the Southern District of New York. Or any digital coin holding company recently sued by the SEC (the Big Long will be the movie this time). And any that are based in the US via a foundation or corporation (IE, not BTC, which is owned and created by a British national), or start with letter X. Because {X} marks the spot, that's the DD.
It is not a coincidence or accident the very first crypto Trump mentioned for the national crypto reserve was XRP - a coin he likely had never even heard off until hours before making that tweet. There was no BTC or ETH mentioned until spaces like this hurt themselves in confusion. Why? Because BTC was created by a British national who also owns a commanding share. ETH does not have the business or banking relationships or the payment efficiency edge - and again, founder residency (Russian/Canadian) and controlling organization (Swiss) are foreign. The XRP Ledger is strategically useful and the leading contender for cross-border activity. Cardano is of interest (and in relationship) to banks and governments around the world for tokenizing assets under the redenomination era. Virtually every traditional financial asset will be tokenized for legal, tax, and accounting purposes. That includes home and car ownership. Solana is a further potential where speed and cost matter most. Finally, though unmentioned by the tweet, XLM already has a CBDC use-case track record and should be considered as well. What else do XRP, ADA, SOL, and XLM have in common? American founders, with USA-based organizations. This isn't about jingoism, this is about strategy.
You need to leave the history, anonymity, and grassroots community aspect behind for now. I agree that those attributes made crypto special in earlier eras, but it doesn't mean it will make you money in the redenomination era. It does not matter if your favorite Goonercoin has a better white paper or more airdrops. What matters is which coins are all-in on their chosen nations, and their efforts to generate relationships with banks, businesses, and governments associated with that respective nation. That is all that matters.
You can rinse and repeat with your own countries, but I would focus on these aforementioned first, and then exchange to your local equivalent later.
TO NOT OWN:
1.RE - will take the world's biggest beating when the EUR, USD, CNH, and JPY lose 30-40% of their value. The Reserve Recession event will be particularly painful for the elderly (pension+property) - thus adding to the pressure for CBDC solutions as a retirement welfare solution. In sum, the 30 year lending architecture will no longer exist. Many pensions will convert to digital currency systems. I wonder if that 401(k) inclusion recently has anything to do with this?
2.Sectors: all sectors except healthcare and industrials. Be wary of consumer staples and utilities, especially if you want to derisk your poorfolio from geopolitics.
3.Cash Accounts: don't be that guy who keeps 25k in his savings account. If you don't have a credit card, that's fine, but for everyone else, that money needs to be in physical assets, or intelligently invested. Remember, you aren't trading market volatility, you're hedging against monetary-systemic risk.
4.Other Currencies tied to the old monetary system - especially NIRPers. You could long the AUD/JPY, for instance, but don't own either via futures or ETFs (IE: FXE, FXY, etc - not even as a short).
5.Inflated Assets: in general, anything boosted by cost of money engineering (the modern monetary system function) will deflate. Lots of discretionary goods, luxury, travel, etc (Veblen goods).
Investor Note:
Do not expect cash to disappear. Those that engage in these cash crash predictions tend to be conspiratorial or hold prepper-mindsets. Those fear biases rarely align with reality. Besides a short ATM shock, cash will exist as usual during and alongside any monetary system transition, it will simply be a losing hedge. Ease of use redemption options at post offices and big banks will not be the only incentive for most people. Businesses and merchants will lead the way. As of this July, stablecoins are effectively legal in the US, when backed by the amorphously defined US Dollar (who's definition could change overnight with the right EO). This was a key green light to industry, giving them the option to navigate outside the conventional monetary architecture if need be - effectively defanging many potential capital controls for businesses. During the transition, businesses will quickly opt for the decentralized and reliable digital alternatives due to accountability, transparency, and availability - many options already exist to serve enterprises (unlike 07-08 monetary challenge), so this "free market" movement won't be entirely retail or consumer led. As mentioned before, don't be surprised if there is a prepared and proactive solution from the GSICs this time (unlike 08, which was reactive).
3.Outsider Information, Bessent, and the Golden Age:
To summarize, crypto on the 'TO OWN' list will platform and support the CBDCs to come. Those free-market coins will present massive investment opportunities for several years to come. Eventually, you can and many of you will likely have to convert them to the digital winners of tomorrow, which will all be CBDCs. And yes, the US will eventually have a state-backed digital currency under the treasury via the redenomination process. It won't be called a CBDC because it won't be backed by a central bank, but a consortium of banks under the US Treasury, who's reserves will be required (gold) at far higher ratios than many CBs (2-3x current), but still held at the US Treasury. Will it be a golden dollar to serve the so-called Golden Age? Before he became president, Trump had a long record of statements and publicized deals that supported gold as an investment, in settlement, and as a part of a monetary system. If investors studied his ramblings the same way they study Powell's statements, they would see this. Either way, there will be an American CBDC at minimum, even if it's wrapped in golden foil and comes with QR codes on red hats.
The Secretary of Fake Teeth knows this, and he and his foreign country comparables have planned for it. With all due respect to him, he was part of an all-star team of FX traders, the best of the best. They understand what makes or breaks nations from a currency standpoint and they have a track record of macro mania to prove it. He was the analytics mastermind behind Black Wednesday (NOT Druckenmiller or Soros). He's literally the currency guy (though gold was almost always his biggest position), and now in command of the top currency and the entire mirage of the modern monetary infrastructure as soon as Powell is out. He's the one who pitched the idea of a shadow Fed Chair. I don't know if he'll get that, but I do know he will get the next best thing: being remembered as the trader that successfully margin called the Federal Reserve. That's why he was chosen, he's going to oversee the biggest currency revolution in modern history.
Simply put, over 88% of global GDP will be functional within a CBDC currency architecture according to the Atlantic Council's CBDC tracker, BIS industry research, and my own review - likely by the Q2 2026. That's a lot of imminent coverage for a reserve currency system replacement that wouldn't be needed for 20-40 years, according to modern economists (TL: wagies). Is it possible the people who facilitate cross-border cash flows in the billions know something consumers don't about the near-future status of our dollar reserve system? Or a matter of curiosity that a tracker like this is hosted on the preeminent US/EU think tank? Instead of, for instance, ronpaulgold.com-?
The transition between the known reserve and liquidity system (USD dominance) to the upcoming digital cash systems of many qualities and styles (programmable currency playground) will constitute the largest global valuation crisis window ever. Even if, at first, only the M3 or M2 is replaced or two-tracked (in the USA). Even if they use some kind of national AI to help balance the exchange markets and oversee a new lending and credit model (spoiler: that's coming). Maybe it will be great in your country, maybe not. Ultimately, it's not a depression or a problem, not if you're prepared for it. That's my recommendation - to be prepared for an unexpected currency swap on a national or international scale unlike anything crapitalism has ever seen before. Upside to any downside: you make enough money and its hard to be depressed. Yes, there will be inflation, and everything will appear to fall (rise for room temp IQs) as the fiat cost of money paradigm goes offline and confusion around the redemption under redenomination structure is common for general consumers. But in purchasing power, certain commodities and cryptos will crab market instead of play dead for great vol plays, and in some cases, represent the last great financial investment opportunities. They are on the functionality shelf that some solution-makers will draw from, so rumor over their potential incorporation will drive tremendous spikes that will mint more millionaires from the lower classes than any other time in history. Some of you reading this will be in that cohort, I guarantee it.
There is much more to be said about CBDCs, credit systems & lending, taxation changes, debt forgiveness, UBI/prebates, SWFs, and such - as all will fold into a new paradigm under programmable currency. It warrants another giant reddit thread that few will read, but you should have the right to know what neo-feudalists are planning with your money systems. From the Vineyard to the Hamptons to Jupiter Island, the dumb rich has become the dumb majority. Many of them will find out just how dumb the hard way.
Wouldn't it be nice to know ahead of time? To not be caught off guard for once? The cypherpunks designed crypto for a scenario like this. It's the failsafe for when fiat inevitably fails. You may very well be able to hold most of your liquid wealth in cryptocurrencies over CBDCs. Maybe it depends on the year of adoption, or maybe your countries policies. But doing nothing is the only bad option, and its the choice most will make.
Why take the flat risk of a programmable purgatory of software patches, invasive KYC, geofenced value, and conditionalized capital controls? Some of these CBDC solutions will not be sound, depending on your country. It's entirely possible they all lean authoritarian in implementation or inefficient and deflationary in practice. Don't comply without question. Thinking is still free. I'll give the same advice I'd give anyone in any era in any place on Earth: sound money = sound mind.
I started retail trading before most of you were born, back when Metatrader was an advanced piece of software and worked with an IP from the isle of Dominica. I understand the appeal. Doing your own research, "working" your own hours, drawing an income from anywhere in the world. Of only being responsible for your own wins or your own loses. You had the choice between life as a broke serf or a broke merchant, and you chose the latter. Historically speaking, some of you made a smart bet. Lifelong wagies will never know what a privilege this has been. Win or lose, you took your own risks - you set fear aside to try your hand at making a fortune. There's a big trillion dollar bank account floating around out there and you only need to press the right buttons to withdraw as much as you like. That's the trading market. How cool is that? It's the pirate's life and I sincerely hope it continues. I don't want to log on to this board 10 months from now and see one big cleanup on aisle 9. That's why I'm here to do the needful for free.
Thank you for reading my ZH parody.
See you on the margins.

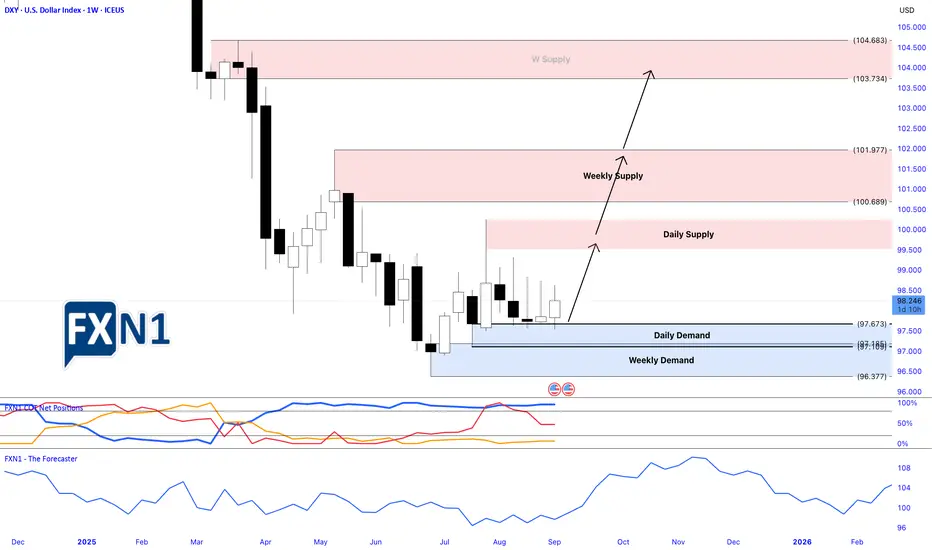
Is the DXY Poised for a Breakout?Analyzing the Bullish PotentialThe DXY (US Dollar Index) appears to be on the verge of a significant upward rally. Last week, I shared my analysis highlighting a potential trigger point for a long entry, which the price subsequently surpassed, confirming the setup. According to the latest COT reports, commercial traders have reached their highest net positions of 2023. Historically, whenever commercials hit new highs, it often signals the beginning of a bullish trend in the DXY.
Additionally, we observe that many currencies measured against the dollar have weakened recently, supporting my thesis of a continued upward move for the DXY. Seasonal patterns also point toward a potential bullish phase.
Is this the moment for the DXY to initiate a strong bullish trend? Only time will tell, but the technical and fundamental signals are aligning in favor of a possible rally.
✅ Please share your thoughts about Dollar index in the comments section below and HIT LIKE if you appreciate my analysis. Don't forget to FOLLOW ME; you will help us a lot with this small contribution.
Fundamental Market Analysis for September 04, 2025 GBPUSDOn Thursday, during the Asian trading session, the GBP/USD pair fell to around 1.3430. The pound sterling (GBP) is weakening against the US dollar (USD) amid concerns about the UK's financial situation.
UK Finance Minister Rachel Reeves said on Wednesday that she would present the annual budget on November 26, insisting that the economy is not “broken” and that she would control spending to help reduce inflation and borrowing costs. However, concerns about the UK's ability to control its finances are weighing on sentiment and dragging the pound down against the US dollar.
According to the US Bureau of Labor Statistics (BLS), the number of job openings on the last working day of July was 7.181 million. This figure followed 7.357 million (revised from 7.437 million) job openings recorded in June and was below the market consensus of 7.4 million.
The weakening of the UK labor market, announced on Wednesday, reinforced expectations that the Federal Reserve (Fed) will cut rates this month. This, in turn, could undermine the dollar and help limit losses for the major currency pair.
Trading recommendation: SELL 1.3400, SL 1.3450, TP 1.3300

Gold Futures – Momentum Strong but Eyes on Jobs DataPrice pushed extremely bullish yesterday, with little chance for pullbacks. I admittedly got stopped out a few times from reacting too quickly to impulses, so today I’m focused on patience and waiting for confirmation.
Currently, Gold is holding above recent levels after breaking higher. There’s still a clean 4H/8H FVG below that price could revisit, but as long as momentum stays intact, buyers remain in control.
⚠️ Important: Tomorrow brings ADP Non-Farm Employment, Jobless Claims, and ISM Services PMI — all of which could drive volatility. Friday is the heavyweight NFP release. Until then, we may see liquidity hunts or choppy price action.
Scenarios I’m watching:
✅ Bullish continuation toward new highs if support holds.
🔄 Deeper pullback into the FVG if momentum stalls.
Staying patient, letting the market show its hand, and keeping risk tight ahead of news.

DXY Dollar Index NFP monday journal Forecast Crystal Clear to me Dollar will keep getting stronger till NFP on friday, reversal level should be around 99/ 99.25 then big drop towards 92.50
Thats a Big drop don't miss it
GG

Gold Futures (MGC / GC) — Daily Outlook (Wed)Price just broke the previous ATH (3,578) and is in new price discovery. Momentum is bullish, but there are key imbalances below that could attract price before continuation.
🔍 Key Levels
ATH (3,578) → breakout level to watch
1H FVG (3,565–3,575) → short-term support zone
4H + 8H FVG stack (3,515–3,535) → deeper liquidity target
Immediate resistance → 3,610–3,620 zone
⚖️ Scenarios for Wednesday
1️⃣ Bullish Continuation (primary bias)
If ATH (3,578) holds → look for continuation into 3,610–3,620+
1H FVG may provide a bounce if tested
2️⃣ Deeper Pullback (secondary bias)
Failure to hold ATH → watch for a drop into 3,515–3,535 (4H/8H FVGs) before bullish continuation
✅ Trade Plan Idea
Continuation play:
Buy on ATH retest / 1H FVG bounce (3,575 zone) → target 3,610–3,620+
Deeper retrace play:
If ATH breaks clean → wait for price inside 3,515–3,535 zone → look for reversal confirmation long
📌 Notes
Momentum = bullish until proven otherwise
Don’t chase → wait for either ATH defense or clean retrace into imbalances
Manage risk → this is price discovery, expect volatility
📊 What’s your bias here? Do you see price holding ATH for continuation, or do you think we dip first into the deeper FVGs?
