DOT USD at the bottomDOT is at the bottom where the Wyckoff Accumulation Pattern was formed and it is in the final stages and I expect to start rising from these levels. The first target will be the top of the pattern at a price of $10. Breaking the top will open the way to the distant targets. I note that a huge limit has been set by Polkadot DAO on the network, as the total supply of tokens that will be minted has been changed. A ceiling has been set for it at 2.1 billion DOTs , unlike what was previously there was no ceiling, as the number of tokens was be around 5billion DOT in the year 2050.
Long-term targets:
22$
36$
60$
90$
140$
DOT

DOT USD bull market
DOT is at the bottom where the Wyckoff Accumulation Pattern was formed and it is in the final stages and I expect to start rising from these levels. The first target will be the top of the pattern at a price of $10. Breaking the top will open the way to the distant targets. I note that a huge limit has been set by Polkadot governance (DAO) on the network, as the total supply of tokens that will be minted has been changed. A ceiling has been set for it at 2.1 billion DOTs , unlike what was previously there was no ceiling, as the number of tokens was be around 5billion DOT in the year 2050.
Long-term targets:
22$
36$
60$
90$
140$

DOT ; Boring movementsHello friends
According to the decline we have, you can see that the price has created an ascending channel and is slowly rising.
But there is an important resistance in its way, which it has hit once and caused a price correction, and the price is gathering strength to rise again.
Now, if this resistance is reliably broken and the price stabilizes above it, the price can move to the specified targets.
*Trade safely with us*

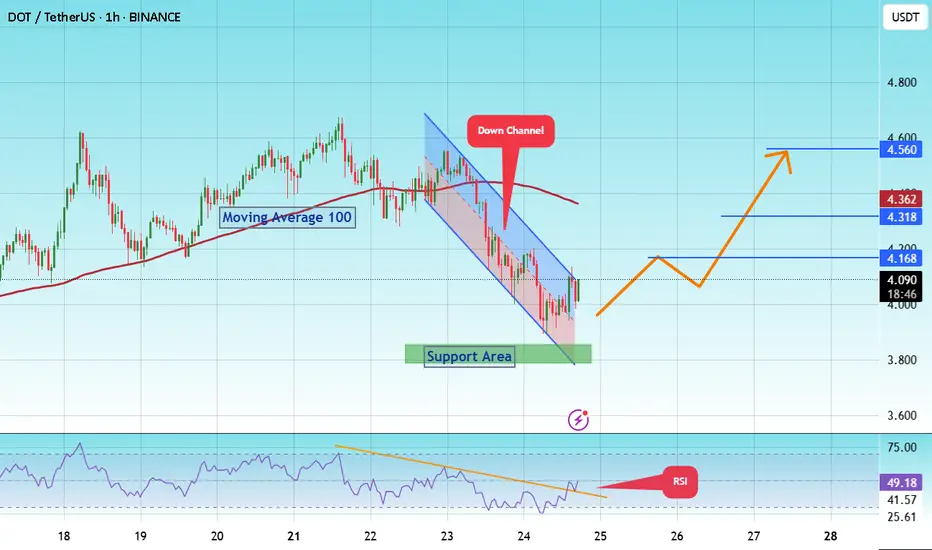
#DOT/Eyes 15% Rally, Targeting Key $ 4.560 Resistance Level#DOT
The price is moving within a descending channel on the 1-hour frame and is expected to break and continue upward.
We have a trend to stabilize above the 100 moving average once again.
We have a downtrend on the RSI indicator that supports the upward break.
We have a support area at the lower limit of the channel at 3,870, acting as strong support from which the price can rebound.
We have a major support area in green that pushed the price higher at 3,800.
Entry price: 4.084
First target: 4.168
Second target: 4.318
Third target: 4.560
To manage risk, don't forget stop loss and capital management.
When you reach the first target, save some profits and then change your stop order to an entry order.
For inquiries, please comment.
Thank you.
DOT; BUY OR SELL?Hello friends
Given the good growth we had, the price has formed a triangle, and if the triangle breaks, the price can move to the specified targets.
If the price falls, we have two excellent support areas that the price will definitely react to.
*Trade safely with us*

DOT — September 01, 2025.CRYPTOCAP:DOT #Polkadot — September 01, 2025.
Good ol' Polkadot is trading sideways on the daily chart and has hit the Long Max Pain level. I think this is a solid spot entry point with a potential for a +15% move.
Entry price: $3.612 - $3.650
Take Profit: $4.160 (+15.18%)
➖➖➖
Short Max Pain = $4.160
Long Max Pain = $3.612

DOT STARTING NEW VOLUME TRENDDOT STARTING NEW VOLUME TREND
Following to see new confirmations at DOT
DOTUSD H4 | Bullish bounce off supportBased on the H4 chart analysis, we could see the price fall to the buy entry, which is a pullback support and could bounce from this level to the upside.
Buy entry is at 3.748, which is a pullback support.
Stop loss is at 3.552, which is a pullback support.
Take profit is at 4.006, which is a swing high resistance.
High Risk Investment Warning
Trading Forex/CFDs on margin carries a high level of risk and may not be suitable for all investors. Leverage can work against you.
Stratos Markets Limited (tradu.com ):
CFDs are complex instruments and come with a high risk of losing money rapidly due to leverage. 65% of retail investor accounts lose money when trading CFDs with this provider. You should consider whether you understand how CFDs work and whether you can afford to take the high risk of losing your money.
Stratos Europe Ltd (tradu.com ):
CFDs are complex instruments and come with a high risk of losing money rapidly due to leverage. 66% of retail investor accounts lose money when trading CFDs with this provider. You should consider whether you understand how CFDs work and whether you can afford to take the high risk of losing your money.
Stratos Global LLC (tradu.com ):
Losses can exceed deposits.
Please be advised that the information presented on TradingView is provided to Tradu (‘Company’, ‘we’) by a third-party provider (‘TFA Global Pte Ltd’). Please be reminded that you are solely responsible for the trading decisions on your account. There is a very high degree of risk involved in trading. Any information and/or content is intended entirely for research, educational and informational purposes only and does not constitute investment or consultation advice or investment strategy. The information is not tailored to the investment needs of any specific person and therefore does not involve a consideration of any of the investment objectives, financial situation or needs of any viewer that may receive it. Kindly also note that past performance is not a reliable indicator of future results. Actual results may differ materially from those anticipated in forward-looking or past performance statements. We assume no liability as to the accuracy or completeness of any of the information and/or content provided herein and the Company cannot be held responsible for any omission, mistake nor for any loss or damage including without limitation to any loss of profit which may arise from reliance on any information supplied by TFA Global Pte Ltd.
The speaker(s) is neither an employee, agent nor representative of Tradu and is therefore acting independently. The opinions given are their own, constitute general market commentary, and do not constitute the opinion or advice of Tradu or any form of personal or investment advice. Tradu neither endorses nor guarantees offerings of third-party speakers, nor is Tradu responsible for the content, veracity or opinions of third-party speakers, presenters or participants.

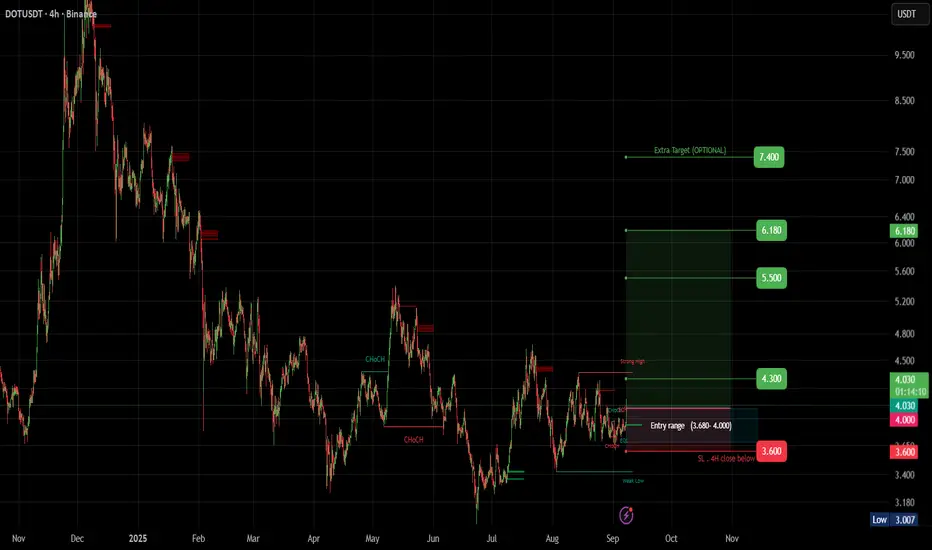
DOT (SPOT)BINANCE:DOTUSDT
#DOT / USDT
Entry range (3.680- 4.000)
SL 1D close below 3.600
T1 4.300
T2 5.500
T3 6.180
Extra Target is optional 7.400
_______________________________________________________
Golden Advices.
********************
* collect the coin slowly in the entry range.
* Please calculate your losses before the entry.
* Do not enter any trade you find it not suitable for you.
* No FOMO - No Rush , it is a long journey.
DOT Daily After a strong downtrend, the price has stabilized around the 3.23 – 3.27 support zone, showing several bullish reactions from this area.
Recently, the price action has formed a Symmetrical Triangle structure, meaning volatility is tightening and energy is building up for a breakout.
The key resistance lies in the 4.40 – 4.65 zone (pink box), which could be the first target if the triangle breaks to the upside.
A breakout above the descending trendline (upper side of the triangle) with rising volume may signal the start of a strong bullish move.
On the other hand, if the triangle support and the 3.23 level are lost, the price may continue lower toward 3.00 and possibly 2.75.
The current Symmetrical Triangle can act as either a continuation or a reversal pattern, depending on the breakout direction. Given the recent bullish reactions at support and the market’s defense of the 3.2 zone, the probability of an upward breakout seems slightly higher.
❓ Do you think this triangle pattern could be a signal for a new bullish rally in DOT?

DOTUSD H4 | Bullish bounce off major supportBased on the H4 chart analysis, we can see that the price has bounced off the buy entry, which is an overlap support that aligns with the78.6% Fibonacci projection and could rise to the take profit.
Buy entry is at 3.479, which is an overlap support that lines up with hte 78.6% Fibonacci projection.
Stop loss is at 3.189, which is a swing low support.
Take profit is at 3.837, which is a pullback resistance.
High Risk Investment Warning
Trading Forex/CFDs on margin carries a high level of risk and may not be suitable for all investors. Leverage can work against you.
Stratos Markets Limited (tradu.com ):
CFDs are complex instruments and come with a high risk of losing money rapidly due to leverage. 65% of retail investor accounts lose money when trading CFDs with this provider. You should consider whether you understand how CFDs work and whether you can afford to take the high risk of losing your money.
Stratos Europe Ltd (tradu.com ):
CFDs are complex instruments and come with a high risk of losing money rapidly due to leverage. 66% of retail investor accounts lose money when trading CFDs with this provider. You should consider whether you understand how CFDs work and whether you can afford to take the high risk of losing your money.
Stratos Global LLC (tradu.com ):
Losses can exceed deposits.
Please be advised that the information presented on TradingView is provided to Tradu (‘Company’, ‘we’) by a third-party provider (‘TFA Global Pte Ltd’). Please be reminded that you are solely responsible for the trading decisions on your account. There is a very high degree of risk involved in trading. Any information and/or content is intended entirely for research, educational and informational purposes only and does not constitute investment or consultation advice or investment strategy. The information is not tailored to the investment needs of any specific person and therefore does not involve a consideration of any of the investment objectives, financial situation or needs of any viewer that may receive it. Kindly also note that past performance is not a reliable indicator of future results. Actual results may differ materially from those anticipated in forward-looking or past performance statements. We assume no liability as to the accuracy or completeness of any of the information and/or content provided herein and the Company cannot be held responsible for any omission, mistake nor for any loss or damage including without limitation to any loss of profit which may arise from reliance on any information supplied by TFA Global Pte Ltd.
The speaker(s) is neither an employee, agent nor representative of Tradu and is therefore acting independently. The opinions given are their own, constitute general market commentary, and do not constitute the opinion or advice of Tradu or any form of personal or investment advice. Tradu neither endorses nor guarantees offerings of third-party speakers, nor is Tradu responsible for the content, veracity or opinions of third-party speakers, presenters or participants.

DOTUSD H4 | Bearish Pressure Likely to ExtendDOT/USD is rising towards the sell entry, which is a pullback resistance that aligns with the 78.6% Fibonacci retracement and could reverse from this level to our take profit.
Sell entry is at 3.899, which is a pullback resistance that lines up with the 78.6% Fibonacci retracement.
Stop loss is at 4.154, which is a swing high resistance that aligns with the 127.2% Fibonacci extension.
Take profit is at 3.587, a pullback support.
High Risk Investment Warning
Trading Forex/CFDs on margin carries a high level of risk and may not be suitable for all investors. Leverage can work against you.
Stratos Markets Limited (tradu.com ):
CFDs are complex instruments and come with a high risk of losing money rapidly due to leverage. 65% of retail investor accounts lose money when trading CFDs with this provider. You should consider whether you understand how CFDs work and whether you can afford to take the high risk of losing your money.
Stratos Europe Ltd (tradu.com ):
CFDs are complex instruments and come with a high risk of losing money rapidly due to leverage. 66% of retail investor accounts lose money when trading CFDs with this provider. You should consider whether you understand how CFDs work and whether you can afford to take the high risk of losing your money.
Stratos Global LLC (tradu.com ):
Losses can exceed deposits.
Please be advised that the information presented on TradingView is provided to Tradu (‘Company’, ‘we’) by a third-party provider (‘TFA Global Pte Ltd’). Please be reminded that you are solely responsible for the trading decisions on your account. There is a very high degree of risk involved in trading. Any information and/or content is intended entirely for research, educational and informational purposes only and does not constitute investment or consultation advice or investment strategy. The information is not tailored to the investment needs of any specific person and therefore does not involve a consideration of any of the investment objectives, financial situation or needs of any viewer that may receive it. Kindly also note that past performance is not a reliable indicator of future results. Actual results may differ materially from those anticipated in forward-looking or past performance statements. We assume no liability as to the accuracy or completeness of any of the information and/or content provided herein and the Company cannot be held responsible for any omission, mistake nor for any loss or damage including without limitation to any loss of profit which may arise from reliance on any information supplied by TFA Global Pte Ltd.
The speaker(s) is neither an employee, agent nor representative of Tradu and is therefore acting independently. The opinions given are their own, constitute general market commentary, and do not constitute the opinion or advice of Tradu or any form of personal or investment advice. Tradu neither endorses nor guarantees offerings of third-party speakers, nor is Tradu responsible for the content, veracity or opinions of third-party speakers, presenters or participants.

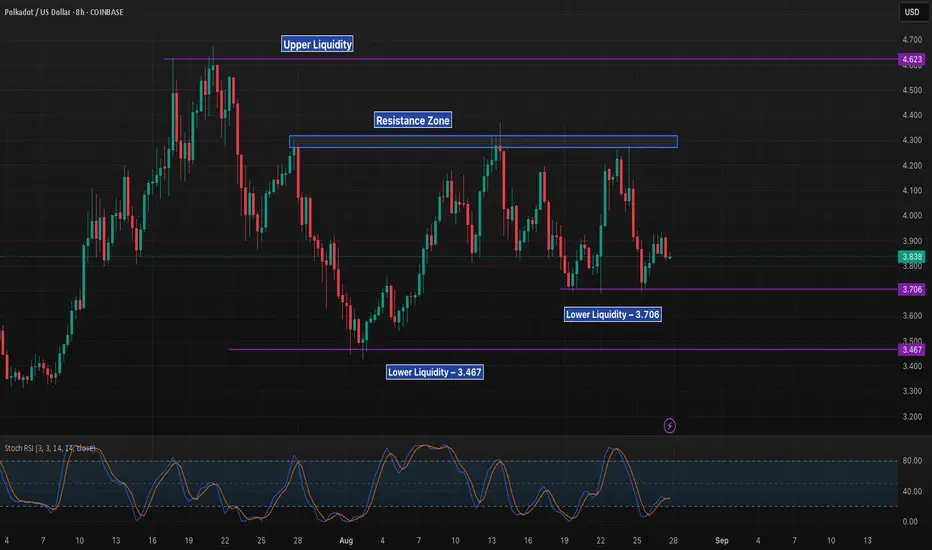
DOT 8H – Range Between Liquidity Levels, Breakout or Breakdown?Polkadot is trading in a defined range, capped by resistance at $4.20–$4.30 and supported between $3.70 and $3.46. These liquidity levels have repeatedly shaped recent price action.
Bullish path: A breakout above resistance could target the $4.62 liquidity level.
Bearish path: Losing $3.70 risks a sweep of $3.46 liquidity and possible continuation lower.
Stoch RSI is rising from oversold territory, but confirmation will require strength above resistance. Until then, DOT remains trapped in consolidation between these key zones.
DOTUSD H4 | Bullish bounce offBased on the H4 chart analysis, we could see the price fall to the buy entry, which acts as an overlap support that aligns with the 78.6% Fibonacci projection and could bounce from this level to the take profit.
Buy entry is at 3.479, which is an overlap support that lines up with the 78.6% Fibonacci projection.
Stop loss is at 3.183, which is a swing low support that lines up with the 127.2% Fibonacci extension.
Take profit is at 3.825, which is a pullback resistance.
High Risk Investment Warning
Trading Forex/CFDs on margin carries a high level of risk and may not be suitable for all investors. Leverage can work against you.
Stratos Markets Limited (tradu.com ):
CFDs are complex instruments and come with a high risk of losing money rapidly due to leverage. 65% of retail investor accounts lose money when trading CFDs with this provider. You should consider whether you understand how CFDs work and whether you can afford to take the high risk of losing your money.
Stratos Europe Ltd (tradu.com ):
CFDs are complex instruments and come with a high risk of losing money rapidly due to leverage. 66% of retail investor accounts lose money when trading CFDs with this provider. You should consider whether you understand how CFDs work and whether you can afford to take the high risk of losing your money.
Stratos Global LLC (tradu.com ):
Losses can exceed deposits.
Please be advised that the information presented on TradingView is provided to Tradu (‘Company’, ‘we’) by a third-party provider (‘TFA Global Pte Ltd’). Please be reminded that you are solely responsible for the trading decisions on your account. There is a very high degree of risk involved in trading. Any information and/or content is intended entirely for research, educational and informational purposes only and does not constitute investment or consultation advice or investment strategy. The information is not tailored to the investment needs of any specific person and therefore does not involve a consideration of any of the investment objectives, financial situation or needs of any viewer that may receive it. Kindly also note that past performance is not a reliable indicator of future results. Actual results may differ materially from those anticipated in forward-looking or past performance statements. We assume no liability as to the accuracy or completeness of any of the information and/or content provided herein and the Company cannot be held responsible for any omission, mistake nor for any loss or damage including without limitation to any loss of profit which may arise from reliance on any information supplied by TFA Global Pte Ltd.
The speaker(s) is neither an employee, agent nor representative of Tradu and is therefore acting independently. The opinions given are their own, constitute general market commentary, and do not constitute the opinion or advice of Tradu or any form of personal or investment advice. Tradu neither endorses nor guarantees offerings of third-party speakers, nor is Tradu responsible for the content, veracity or opinions of third-party speakers, presenters or participants.

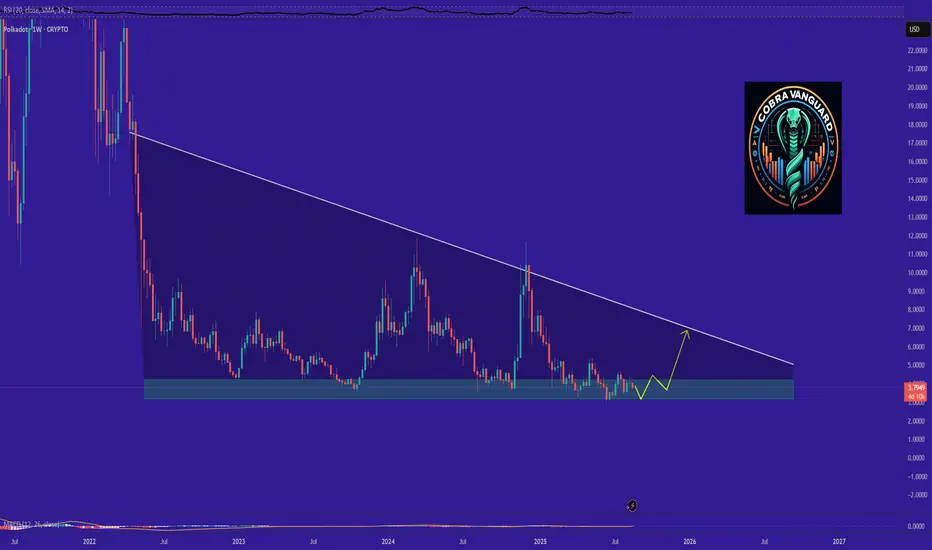
Polkadot Holds Key Support - Analysts See Toward $23 Long-TermThe price has reacted positively to a key weekly support zone, which has prevented further downside movement. As seen on the chart, the latest pivot low is higher than the previous pivot low, and the resistance that had created the lowest low was unsuccessfully broken once.
taken together, these signals suggest the beginning of a bullish trend that could provide solid returns for investors.
Price targets:
> $5.40
> $6-7
> $9
> $11
if the $10-11 resistance zone will get broken, the price has the potential to reach $23 an ultimately $49 -- although these two targets are currently considered long-term and less attainable in the near future.
This analysis reflects personal opinion and is not financial advise.

Polkadot Dot usdt daily analysis
Time frame hourly
Risk rewards ratio =1.75
Target = 4.33 $
I expected the price to drop to $3.67 and then rise.
Now, in the short term, I’m opening a position with low risk. If this position gets closed, we’ll have to see whether the price breaks the green trendline or continues fluctuating between these two lines.

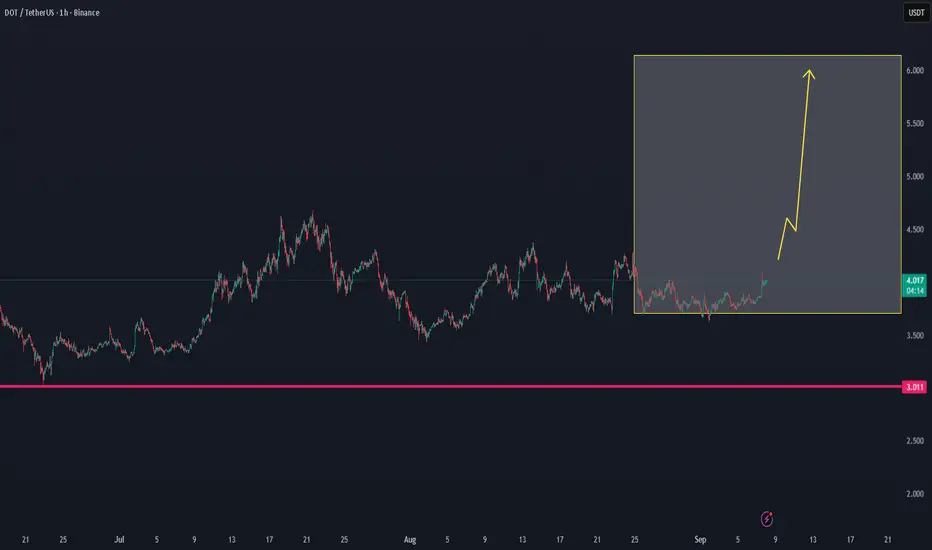
DOT is bullish now and many Traders don't see it !!The price is trapped inside a triangle, and it is currently at the triangle's bottom. If we look at previous lows, the price has typically seen strong growth after hitting the bottom. If the price follows previous trends, we should now expect a price increase.
DOTUSD H4 | Bullish bounce off major supportBased on the H4 chart analysis, we could se the price fall to the buy entry which is an overlap supprt and could bounce from this level to the upside.
Buy entry is at 3.479, which is an overlap support that is slightly below the 127.2% Fibonacci extension.
Stop loss is at 3.178, which is a swing low support.
Take profit is at 3.825, which is a pullback resistance.
High Risk Investment Warning
Trading Forex/CFDs on margin carries a high level of risk and may not be suitable for all investors. Leverage can work against you.
Stratos Markets Limited (tradu.com ):
CFDs are complex instruments and come with a high risk of losing money rapidly due to leverage. 65% of retail investor accounts lose money when trading CFDs with this provider. You should consider whether you understand how CFDs work and whether you can afford to take the high risk of losing your money.
Stratos Europe Ltd (tradu.com ):
CFDs are complex instruments and come with a high risk of losing money rapidly due to leverage. 66% of retail investor accounts lose money when trading CFDs with this provider. You should consider whether you understand how CFDs work and whether you can afford to take the high risk of losing your money.
Stratos Global LLC (tradu.com ):
Losses can exceed deposits.
Please be advised that the information presented on TradingView is provided to Tradu (‘Company’, ‘we’) by a third-party provider (‘TFA Global Pte Ltd’). Please be reminded that you are solely responsible for the trading decisions on your account. There is a very high degree of risk involved in trading. Any information and/or content is intended entirely for research, educational and informational purposes only and does not constitute investment or consultation advice or investment strategy. The information is not tailored to the investment needs of any specific person and therefore does not involve a consideration of any of the investment objectives, financial situation or needs of any viewer that may receive it. Kindly also note that past performance is not a reliable indicator of future results. Actual results may differ materially from those anticipated in forward-looking or past performance statements. We assume no liability as to the accuracy or completeness of any of the information and/or content provided herein and the Company cannot be held responsible for any omission, mistake nor for any loss or damage including without limitation to any loss of profit which may arise from reliance on any information supplied by TFA Global Pte Ltd.
The speaker(s) is neither an employee, agent nor representative of Tradu and is therefore acting independently. The opinions given are their own, constitute general market commentary, and do not constitute the opinion or advice of Tradu or any form of personal or investment advice. Tradu neither endorses nor guarantees offerings of third-party speakers, nor is Tradu responsible for the content, veracity or opinions of third-party speakers, presenters or participants.

DOTUSD H4 | Bearish drop off 50% Fibonacci resistanceDOT/USD is rising towards the sell entry which is a pullback resistance that lines up with the 50% Fibonacci retracement and could reverse to the take profit.
Sell entry is at 3.982, which is a pullback resistance that lines up with the 50% Fibonacci retracement.
Stop loss is at 4.165, which is an overlap resistance.
Take profit is at 3.600, which is a pullback support that is slightly above the 78.6% Fibonacci retracement.
High Risk Investment Warning
Trading Forex/CFDs on margin carries a high level of risk and may not be suitable for all investors. Leverage can work against you.
Stratos Markets Limited (tradu.com ):
CFDs are complex instruments and come with a high risk of losing money rapidly due to leverage. 65% of retail investor accounts lose money when trading CFDs with this provider. You should consider whether you understand how CFDs work and whether you can afford to take the high risk of losing your money.
Stratos Europe Ltd (tradu.com ):
CFDs are complex instruments and come with a high risk of losing money rapidly due to leverage. 66% of retail investor accounts lose money when trading CFDs with this provider. You should consider whether you understand how CFDs work and whether you can afford to take the high risk of losing your money.
Stratos Global LLC (tradu.com ):
Losses can exceed deposits.
Please be advised that the information presented on TradingView is provided to Tradu (‘Company’, ‘we’) by a third-party provider (‘TFA Global Pte Ltd’). Please be reminded that you are solely responsible for the trading decisions on your account. There is a very high degree of risk involved in trading. Any information and/or content is intended entirely for research, educational and informational purposes only and does not constitute investment or consultation advice or investment strategy. The information is not tailored to the investment needs of any specific person and therefore does not involve a consideration of any of the investment objectives, financial situation or needs of any viewer that may receive it. Kindly also note that past performance is not a reliable indicator of future results. Actual results may differ materially from those anticipated in forward-looking or past performance statements. We assume no liability as to the accuracy or completeness of any of the information and/or content provided herein and the Company cannot be held responsible for any omission, mistake nor for any loss or damage including without limitation to any loss of profit which may arise from reliance on any information supplied by TFA Global Pte Ltd.
The speaker(s) is neither an employee, agent nor representative of Tradu and is therefore acting independently. The opinions given are their own, constitute general market commentary, and do not constitute the opinion or advice of Tradu or any form of personal or investment advice. Tradu neither endorses nor guarantees offerings of third-party speakers, nor is Tradu responsible for the content, veracity or opinions of third-party speakers, presenters or participants.

Up to $5 - DOT weekly update August 13 - 19thWe are currently in Minor Wave 5 and Intermediate Wave 1, with the broader Primary Cycle forming a Wave 3. Once Intermediate Wave 1 is complete, I anticipate a larger corrective move toward the 0.618 Fibonacci retracement level, or potentially deeper.
The liquidation heatmap reveals limited liquidity slightly above the current price, but a substantial concentration below it—liquidity that is likely to be targeted during the formation of Wave 2. The order book further indicates some resting orders at the 1.0 Fibonacci extension level and a significantly larger cluster at the 1.618 extension level.
Funding rates remain moderately positive, and open interest is steadily increasing, suggesting a stable upward trend. This also implies that market sentiment has not yet reached excessive euphoria and that risk appetite remains relatively contained.
In summary, the confluence of liquidity positioning, derivatives data, and Elliott Wave structure leads me to favor a primary scenario in which prices reach the 1.618 extension level of Minor Wave 5, encountering both the psychological $5.00 mark and a prominent sell wall. This confluence is expected to trigger the onset of Wave 2.

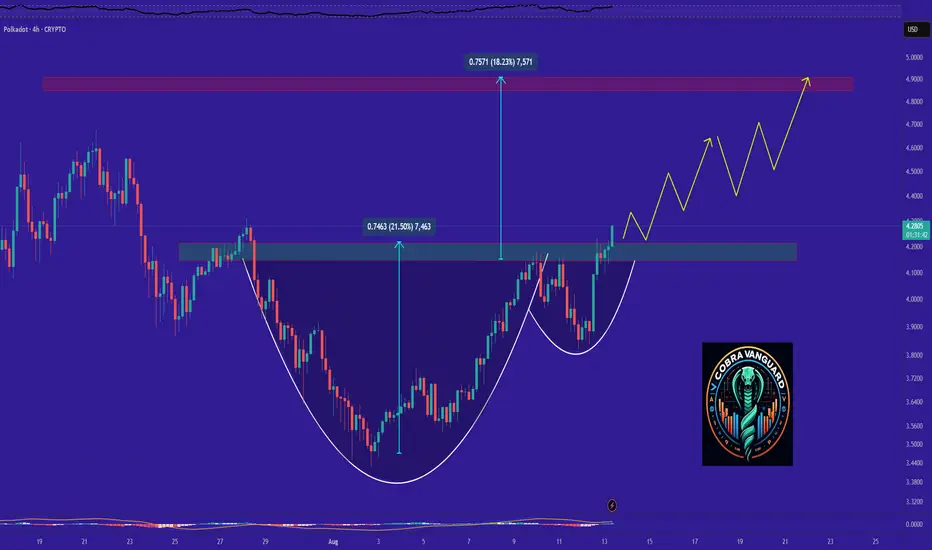
DOT is bullish now and many Traders don't see it !As I said,the cup and handle pattern has completed and broken out, which could quickly drive the price above $4.5.
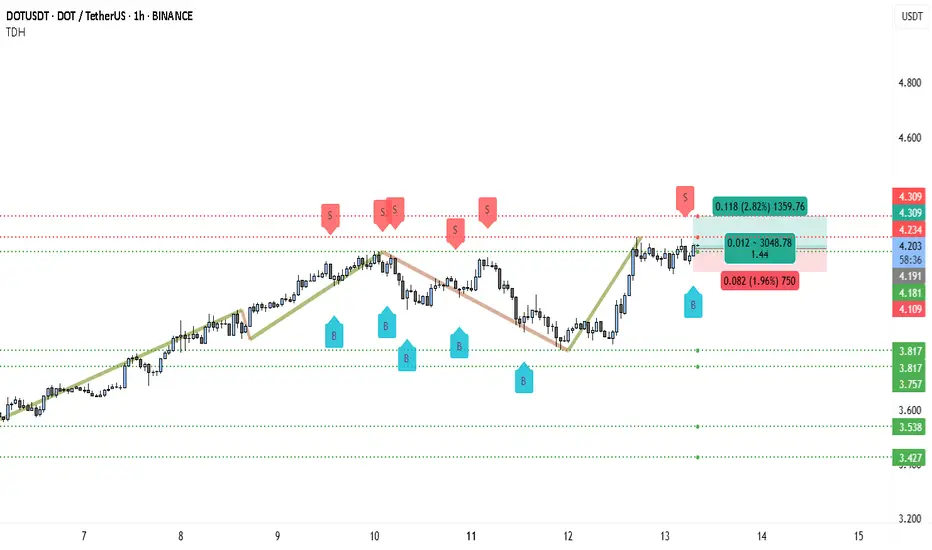
DOT Ready to Explode Above $4.20? Don’t Blink!📊 Market Structure
DOTUSDT is showing a bullish recovery after a recent pullback. From the August 7th low, the price trended upward strongly, making higher highs until around August 10th, where sellers took over and drove a retracement. The correction respected multiple support levels, and buying pressure re-emerged around $3.817–$3.757, leading to the latest rally.
Currently, DOT is trading just above the $4.181–$4.192 zone, which is a short-term support area. This level is important because it was previously resistance during the earlier uptrend and is now holding as a pivot for bullish continuation.
________________________________________
🔍 Price Action Insights
The chart shows multiple “B” buy signals during the dip phases, confirming accumulation zones. The most recent buy signal triggered right before price pushed toward the $4.309 resistance area. Sellers have previously been active around $4.234–$4.309, which explains the minor consolidation we’re seeing now.
The immediate upside target is $4.309 — a break and close above this on the 1H would likely send DOT toward higher resistances, possibly into the $4.40 area over the next sessions.
________________________________________
💼 Trading Setup (From Chart Data)
• Entry: $4.192 (current support & breakout retest)
• Stop Loss: $4.109 (below short-term support) – Risk ≈ 1.96%
• Take Profit: $4.309 (resistance) – Reward ≈ 2.82%
• Risk : Reward Ratio: ~1.44 : 1
________________________________________
📈 Bullish Scenario
If DOT holds above $4.181–$4.192 ✅, expect a retest and possible breakout above $4.309. Breaking that resistance could trigger a stronger rally toward $4.40+, with momentum building from the prior higher low.
________________________________________
⚠️ Bearish Risk
If $4.181 breaks decisively ❌, price could revisit the lower supports at $3.817 or even $3.757 before buyers attempt another push.
________________________________________
📌 Trade Management
1. Watch for bullish candles with strong closes above $4.234 — this would be the first sign of strength toward $4.309.
2. Take partial profit near $4.309 🏦 to secure gains.
3. Move stop-loss to breakeven once partial profits are taken.
4. If a breakout above $4.309 occurs, trail the stop under each new higher low to capture extended upside.
From this setup, DOTUSDT is in a bullish recovery mode and, as long as it stays above the $4.18 pivot, buyers have the advantage.
DOTUSD H4| Bearish reversal off Fib confluenceDOT/USD is rising towards the sell entry which is an overlap resistance and could reverse to the downside.
Sell entry is at 4.161, which is an overlap resistance that aligns with the 127.2% Fib extension, 78.6% Fib projection and slightly above the 61.8% Fibonacci retracement.
Stop loss is at 4.530, which is a swing high resistance.
Take profit is at 3.744, which is an overlap support.
High Risk Investment Warning
Trading Forex/CFDs on margin carries a high level of risk and may not be suitable for all investors. Leverage can work against you.
Stratos Markets Limited (tradu.com ):
CFDs are complex instruments and come with a high risk of losing money rapidly due to leverage. 65% of retail investor accounts lose money when trading CFDs with this provider. You should consider whether you understand how CFDs work and whether you can afford to take the high risk of losing your money.
Stratos Europe Ltd (tradu.com ):
CFDs are complex instruments and come with a high risk of losing money rapidly due to leverage. 66% of retail investor accounts lose money when trading CFDs with this provider. You should consider whether you understand how CFDs work and whether you can afford to take the high risk of losing your money.
Stratos Global LLC (tradu.com ):
Losses can exceed deposits.
Please be advised that the information presented on TradingView is provided to Tradu (‘Company’, ‘we’) by a third-party provider (‘TFA Global Pte Ltd’). Please be reminded that you are solely responsible for the trading decisions on your account. There is a very high degree of risk involved in trading. Any information and/or content is intended entirely for research, educational and informational purposes only and does not constitute investment or consultation advice or investment strategy. The information is not tailored to the investment needs of any specific person and therefore does not involve a consideration of any of the investment objectives, financial situation or needs of any viewer that may receive it. Kindly also note that past performance is not a reliable indicator of future results. Actual results may differ materially from those anticipated in forward-looking or past performance statements. We assume no liability as to the accuracy or completeness of any of the information and/or content provided herein and the Company cannot be held responsible for any omission, mistake nor for any loss or damage including without limitation to any loss of profit which may arise from reliance on any information supplied by TFA Global Pte Ltd.
The speaker(s) is neither an employee, agent nor representative of Tradu and is therefore acting independently. The opinions given are their own, constitute general market commentary, and do not constitute the opinion or advice of Tradu or any form of personal or investment advice. Tradu neither endorses nor guarantees offerings of third-party speakers, nor is Tradu responsible for the content, veracity or opinions of third-party speakers, presenters or participants.
