Gold Poised for a Breakout After Sideways ConsolidationGold has retraced to the 3300 level and remained range-bound for an extended period. This prolonged consolidation suggests that a sharp breakout may be imminent, with the next move — whether up or down — likely to be swift and volatile.
Looking at the 2-hour chart, the current price structure is complex. It could be interpreted as a potential double top, but it also resembles the early formation of an inverse head and shoulders, which makes trading decisions more challenging.
From a technical standpoint:
Moving averages are aligned in a bearish setup, and the area above remains densely packed with resistance.
MACD on the 2H chart shows a bearish crossover, signaling a potential continuation of the downtrend.
However, on the 30-minute chart, MACD shows some short-term bullish momentum, with the next resistance near 3306.
For bulls, if the price attempts to rise toward the 3306–3312 zone but then quickly pulls back, this would indicate weak buying pressure, and caution is advised.
In summary, short-term signals are bullish, but the medium-term trend remains bearish. With the market in a sideways range, it's best to remain patient and watch for breakout signals. The two trading opportunities shared yesterday remain valid and worth monitoring closely.
Double Top or Bottom

SWDY's New Upward Region Waiting for Chart Pattern ConfirmationSWDY stock is still trying to peak up, but unfortunately, it's rebounding back from the resistance line of 82.662. It had already broken the support line 81.970. In case of continuing, it'll break the support line 81.849 till reaching the support line 81.759. In case of rising, it'll breach the 1st resistance line to the 2nd resistance line at 82.933 points and the 3rd resistance line at 83.097. In general, it's expected to rise, especially for the presence of a double bottom, which will lead to a bullish reversal pattern and orient a new upward region, but the chart pattern confirmation is still in progress.

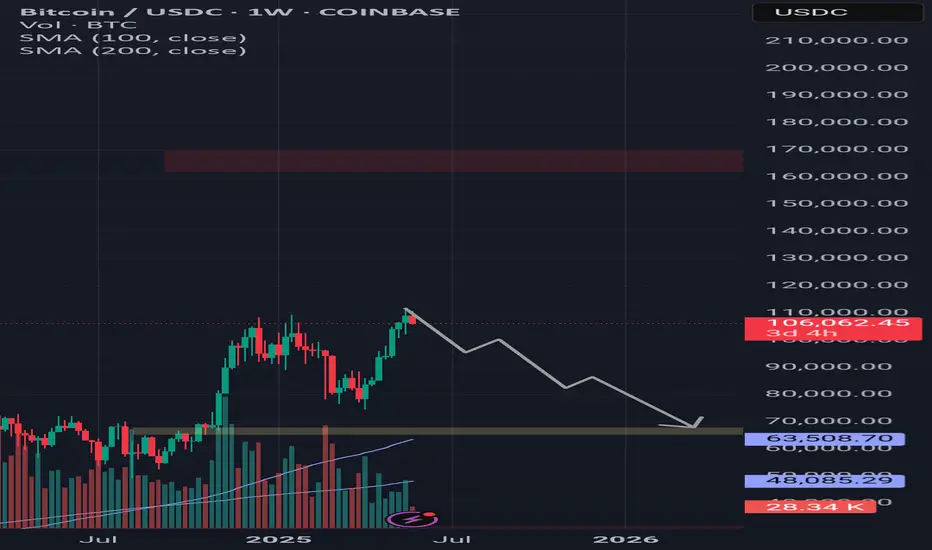
BtcusdtHello dears, I did a simple analysis of Bitcoin for you. If the next weekly candle is also bearish, it may happen with a probability of sixty percent. If you want to buy, buy at the specified price, which is about sixty-five thousand dollars. Good luck (⚠️A lot of data was reviewed for analysis, such as the Fear and Greed Index, Fibonacci, previous bullish periods, etc., but the responsibility for trading is yours⚠️)
SHORT ON EUR/USDEUR/USD has pulled back to a major supply zone that previously formed a DOUBLE TOP in that area in the past. (This is technically the re-test)
I have placed a sell limit order in the supply area and I will be expecting EUR/USD to fall past the swing low for over 100 -150 pips.

USOIL - Bullish Double BottomHello Traders !
The USOIL price formed a double bottom pattern.
Currently, The neckline is broken !
So, I expect a bullish move🚀
_______________
TARGET: 63.49🎯

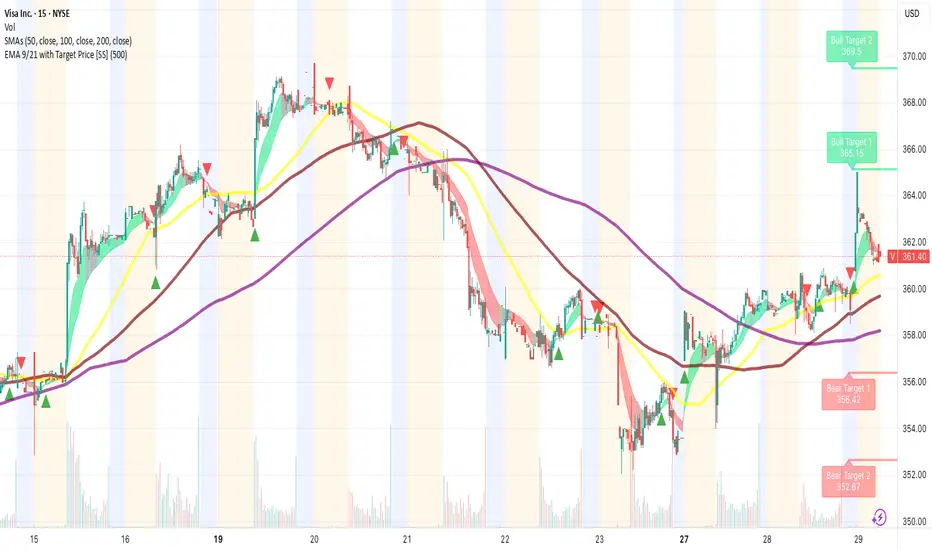
Strategic Entry in Visa (V): Stability, Growth, and Opportunity📈 Strategic CALL Entry on VISA (V) – All 20 Criteria Met
Today I’m entering a CALL option on Visa (V) based on a comprehensive analysis that aligns with all of our 20-entry criteria, combining technical indicators, fundamental strength, and disciplined risk management.
But beyond that, we are also factoring in key macroeconomic catalysts and upcoming earnings, which strengthen the setup and give us a clear path for growth.
🔍 Why Visa – and why now?
✅ Meets all 20 internal criteria, including:
Price above both the 50- and 200-day moving averages (clear uptrend)
RSI in a healthy range (not overbought)
Volume confirms price action
Consistent earnings performance
Strong sector momentum (payments & fintech)
Sound risk-to-reward structure (<6% of portfolio risk)
Positive analyst sentiment
Solid balance sheet, low debt, global dominance, etc.
📊 Earnings expected in June
Visa is set to report earnings in June. Forecasts suggest strong performance backed by increasing digital transactions and resilient global spending. A positive surprise could trigger a sharp upward move.
🌍 Macroeconomic backdrop: US GDP data out today at 8:30 AM (EST)
GDP expectations stand at +2.2%. If confirmed, it signals continued economic strength — a bullish sign for consumer-facing companies like Visa that benefit directly from transaction volume growth.
💡 Why Visa stands out:
Stability
Steady growth
Low volatility
Strong technical and fundamental alignment
📌 Bottom line:
Visa not only checks all our boxes internally, but also benefits from a favorable macroeconomic context and key catalysts ahead. This is a high-conviction, low-emotion trade backed by structure, not hype.
DB patternhi traders,
Here is an opportunity to grab 500 to 600 pts in Nifty.
A DB pattern in daily timeframe has formed, if the neckline breaks buy nifty.
Neckline level : 25116.25
Target : 25759.95
SL : 24462.40

GBPAUD: Short From Resistance 🇬🇧🇦🇺
GBPAUD may retrace from a key daily horizontal resistance.
As a confirmation, I see a double top pattern formation
on that on a 4H time frame and a breakout of its neckline.
I expect a bearish move to 1.0858
❤️Please, support my work with like, thank you!❤️
I am part of Trade Nation's Influencer program and receive a monthly fee for using their TradingView charts in my analysis.


GER40 | Pullback From High – Retesting Recent Breakout AreaPrice recently printed a new high at 24,336.23 and is now pulling back. It's currently hovering around the 24,104.39 zone — a minor price shelf that formed before the final push upward. This level is being retested and may act as a pivot for the next move.
Support at: 24,104.39 🔽 | 23,900.00 🔽
Resistance at: 24,336.23 🔼
🔎 Bias:
🔼 Bullish: If price holds above 24,104.39 and shows bullish candles, a move back toward 24,336.23 could follow. A breakout beyond that high would signal continuation.
🔽 Bearish: A drop below 24,104.39 — especially with momentum — could push price back to the 23,900.00 level, and potentially deeper.
📛 Disclaimer: This is not financial advice. Trade at your own risk.

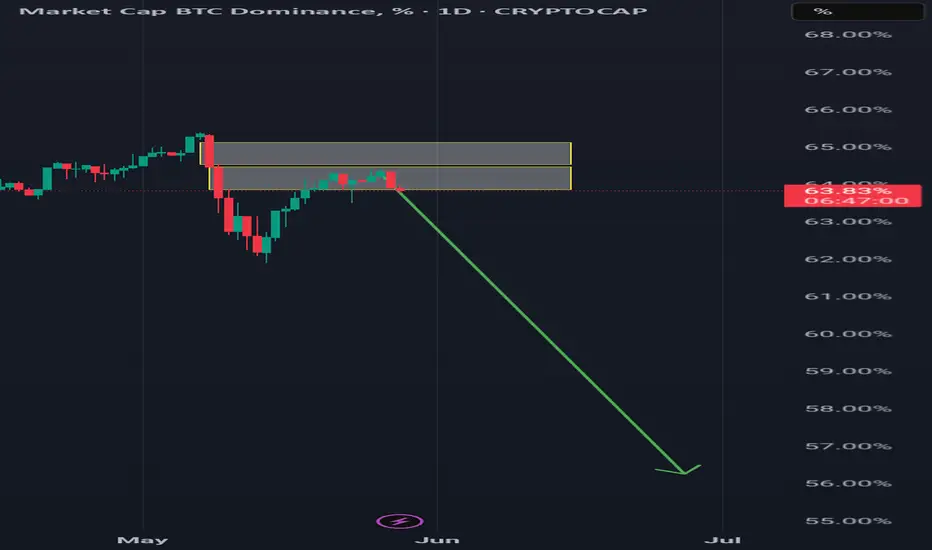
Bitcoin’s Dominance (BTC.D)I spotter 2 order blocks which seem to have been rejected from the lower. Fibonacci retracement tool didn't align perfectly with the retracement, I however used it for my July target
5/28 Gold Analysis and Trading SignalsGood morning everyone!
Yesterday, gold saw a sharp downward move, and we profited well by trading short based on the double-top pattern.
Yesterday, gold has reached the 3287 support area, and by the end of the U.S. session it rebounded slightly above 3300. Although the rebound lacks strong momentum, it does show that the support zone held on the first test. Whether the bulls can take back control depends heavily on today's follow-up strength.
📊 Key Technical Levels:
If bulls break above and hold 3323–3336, a bullish reversal is likely;
If the bounce is weak, short positions remain the preferred strategy;
4H support: 3268
Daily support: 3172
Before that, 3301–3275 also forms an important support zone;
If price breaks below 3301–3275, especially under negative news impact, a drop to 3150 or even 3100 is not out of the question.
🗞 Key News Focus Today:
Watch for May FOMC-related remarks during the U.S. session, which could become a catalyst for major market movement.
📈 Today’s Trading Plan:
📉 Sell in the 3342–3362 zone (strong resistance)
📈 Buy in the 3258–3248 zone (strong support)
🔁 Flexible intraday levels to monitor:
3336 / 3328 / 3319 / 3306 / 3295 / 3286 / 3274 / 3266
Stay sharp and combine technicals with key news events to make informed trades. Feel free to reach out if you need support — wishing you a profitable day ahead!

PNUT projects to a Dollar.TWO Clear patterns
Double bottom
and a Bull Flag.
Two respective Log Projections for you to consider.
This suggest strong Solana performance is incoming and another round of #Memecoin frenzy.

GBPUSD returns to key level with compelling risk-rewardGBPUSD is back at a key level. We analyse the recent dip to 1.3439, explore trade setups with a strong risk-reward ratio, and compare EURUSD for added confirmation. Short-term strategy, long-term potential.
This content is not directed to residents of the EU or UK. Any opinions, news, research, analyses, prices or other information contained on this website is provided as general market commentary and does not constitute investment advice. ThinkMarkets will not accept liability for any loss or damage including, without limitation, to any loss of profit which may arise directly or indirectly from use of or reliance on such information.

USEQUITIES – Rejection or Breakout at Key Resistance?After a strong recovery from April lows, US equities have climbed back into a major resistance zone around 4,555. Price recently retested the 4,435 level and bounced strongly, suggesting bullish momentum may be building.
Support at: 4,435.04 🔽, 4,344.51 🔽
Resistance at: 4,555.95 🔼, 4,650.00 🔼, 4,760.00 🔼
🔎 Bias:
🔼 Bullish: Sustained break and daily close above 4,555.95, targeting 4,650 and beyond.
🔽 Bearish: Rejection from this resistance zone and a close below 4,435.04 could trigger a retracement toward 4,344.51 or lower.
📛 Disclaimer: This is not financial advice. Trade at your own risk.

Flying into the sun or about to get burnt?Market is about to reach all-time highs again. Many trade deals must have been made. Interest rates must have been cut. Wars must have been resolved. Personal debt must have come under control. Corporate debt must have been resolved.
Wait, nothing has changed? Things are worse? Well why is the index about to hit new all-time highs? My take is a major fake out. We are about to set a double top as we complete a rising wedge pattern.
The rising wedge.
What began at the market bottom on 7 April, has remained bound in a channel. If the first pump up was an A followed by the declaration of the channel bottom as B, wave C has last over a month upward. We have wave 3 signals identifying wave 3 of C ending with the high on 19 May. Last week's dip was wave 4 and now we fly high this week. It is unclear if we actually make a new all-time high or fall just short. The below chart has 138.197% extension around 610.63. Inside wave C, my wave 1 was nine days long, and wave 3 was only 8. This points to wave 5 lasting less than 8 days. A common wave 1-3-5 duration in relation to wave 3 is around 114% for 1 and 50% for wave 5.
The height of the rising wedge covers 66.82 points. This same distance should provide the first target bottom once we exit the channel, possibly as early as next week. Once the bottom falls, we then examine the double top pattern. Although the neckline stretches far backwards, the bottom is established at the 7 April low. The distance from the neckline to the all-time high in February provides the next possible minimum target bottom by taking this 131.43 drop and subtracting it from the neckline of 481.80. This puts the initial low around 350.37 sometime later this year or early next.
There is a perfect storm of calamity brewing with zero resolutions in place or even planned. Do we finally drop or keep rising into the sun?

GBPUSD: Bearish Trend Double Top/ M Formation has appeared on the peak of this uptrend. Maybe this could be used to start the downtrend for the next several days.

This Hidden Altcoin Could Explode—But Only If THIS Level Holds!Yello Paradisers, have you seen what’s quietly brewing on REZUSDT? A high-probability bullish reversal setup is forming, and if this level holds, it could lead to one of the cleanest altcoin plays we’ve seen recently. This isn’t just about one signal—REZUSDT is showing a rare confluence of bullish indicators that deserve your full attention.
💎Currently, REZUSDT is moving within a descending channel while printing a bullish divergence on momentum indicators. At the same time, a textbook W-pattern has just formed, and what makes this even more significant is that it’s happening right at a support zone. This triple confluence—descending channel, bullish divergence, and W-pattern at support—is increasing the probability of a bullish breakout in the coming sessions.
💎From an entry perspective, those looking for more favorable risk-to-reward (RR) could benefit from a deeper pullback. That would offer a higher probability setup and tighter risk management. However, for aggressive or short-term traders, the current level still offers a 1:1 RR, which, while not optimal, is acceptable under strict trade management and position sizing.
💎That said, there’s a critical invalidation point that must be respected. If the price breaks down and closes a full candle below the support zone, it would invalidate the entire bullish structure. In such a case, the only professional move is to stay out and wait for cleaner confirmation or a better-developed setup. There is no room for hope in trading—only strategy and discipline.
🎖Strive for consistency, not quick profits. Trade smart, Paradisers. This setup could be a gift for the patient and a trap for the impulsive. The key is always the same—discipline, patience, and strategic execution. Stay sharp, stay focused, and keep protecting your capital.
MyCryptoParadise
iFeel the success🌴

USDCAD: Strong Bearish Confirmation ?! 🇺🇸🇨🇦
I see an important sign of strength of the sellers on USDCAD
on an hourly time frame after a release of the today's US fundamentals.
The price violated a support line of a horizontal range and is retesting
that at the moment.
I believe that the price may drop at least to1.374 level soon.
❤️Please, support my work with like, thank you!❤️
I am part of Trade Nation's Influencer program and receive a monthly fee for using their TradingView charts in my analysis.

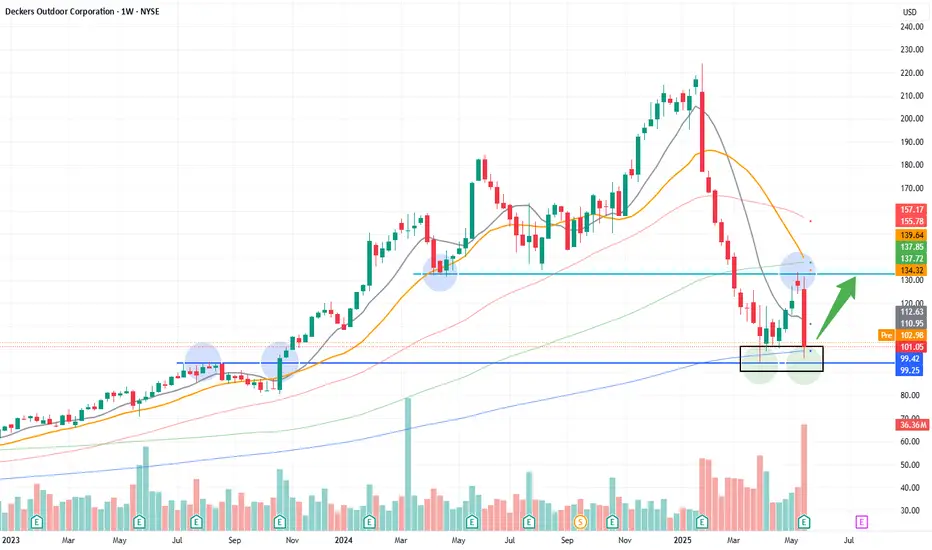
Double bottomDespite the strong quarterly results, the stock was penalized due to a lower outlook for Q2, a consequence of uncertainties surrounding tariffs, leading to a 20% decline.
The price is reaching the weekly 200-day simple moving average (blue line) for the second time, coinciding with a long-term support level (also marked in blue), initiating the formation of a double bottom pattern.
The first target is the light blue resistance area around $130 (+30%), where a potential confirmation of the double bottom could occur with a breakout of the neckline, followed by a further 25–30% increase
5/27 Gold Analysis and Trading SignalsGood afternoon everyone!
Yesterday, gold fluctuated within the flexible trading zone, and we only executed a long entry near 3323, which brought decent profit.
Today, gold opened with an upward move toward 3350, but quickly pulled back. The recent market shows a sideways consolidation, with the $3340 level acting as a key pivot zone:
Below 3340: dense support areas
Above 3340: resistance clusters
In this context, any breakout without strong momentum can easily lead to capital flow shifts, causing false breakouts or rapid pullbacks, making trend continuation more difficult.
📉 Technical View:
On the 30M chart, bearish momentum slightly outweighs bullish, and gold is likely to remain range-bound within the zone defined yesterday.
🗞 Fundamental Reminder:
There are a few important U.S. economic releases during the NY session. Watch closely to see if they provide a clear directional push.
📈 Today’s Trading Plan:
📉 Sell in the 3366–3386 zone (resistance area)
📈 Buy in the 3278–3256 zone (support zone)
🔁 Flexible intraday levels to monitor:
3353 / 3341 / 3334 / 3317 / 3309 / 3296 / 3284
Trade with flexibility, beware of fake breakouts, and focus on NY session data-driven opportunities. Let me know if you have questions — good luck and happy trading!

Double Bottom + Bullish Divergence.2280 - Closed at 51.80 (26-05-2025)
Double Bottom + Bullish Divergence.
Channel Bottom & respecting Trendline so far.
Crossing 53.20 with Good Volumes may
result in reaching 55 - 56.
50.30 should be the SL.

UNIUSDT: A Massive Bullish Move Loading… or a Trap?Yello, Paradisers! Is UNIUSDT finally gearing up for a major breakout, or is this just another fake move before a deeper correction? Let’s break it down.
💎UNIUSDT is currently trading within a descending channel, increasing the probability of an upcoming bullish move. The key support zone is holding strong, and we might be witnessing the early signs of a double-bottom formation—a classic reversal pattern.
💎However, confirmation is everything in trading. To increase the probability in our favor, we need to see: Bullish divergence, Bullish I-CHoCH (Internal Change of Character), Bullish reversal patterns such as a W-pattern or inverse head and shoulders from our support zone.
💎If UNIUSDT retraces further, we expect a bounce from the strong support zone—but again, we must wait for clear bullish confirmations before taking any positions.
💎The invalidation level? If price breaks and closes candle below the strong support zone, the entire bullish setup gets invalidated. In that case, we wait patiently for better price action before considering any new trades.
🎖Patience and discipline are key, Paradisers. Many traders will get trapped in bad positions, but those who wait for the right confirmations will be the ones making money. Trade smart & stick to high-probability setups only.
MyCryptoParadise
iFeel the success🌴
