Xauusd market update This chart presents a 4-hour analysis of Gold Spot (XAU/USD) against the US Dollar, showing potential bullish scenarios based on price zones and market reactions.
Key Insights:
Current Price:
$3,353.31, slightly down 0.11%.
---
Highlighted Zones:
1. Resistance Zone (~$3,420–$3,455):
Price reacted here previously.
Marked as a potential final target for bullish momentum.
2. Mid Supply/Resistance Zone (~$3,370–$3,405):
Critical decision area.
Price might face consolidation or rejection.
3. Demand Zone (~$3,240–$3,270):
Previously respected support.
Ideal area for a bullish reversal if price dips.
---
Projected Price Paths (Black Dotted Lines):
Scenario A (Immediate Bullish):
Price consolidates above $3,350.
Breaks into the mid-zone, then pushes to $3,450 resistance.
Scenario B (Pullback Then Rally):
Declines to the $3,250 demand zone.
Rebounds strongly, breaks mid-zone, and heads for $3,450.
Scenario C (Range-bound):
Multiple bounces between $3,250 and $3,405 before a decisive breakout.
---
Conclusion:
The chart suggests a bullish bias as long as price holds above the $3,250 support zone. Breakout confirmation above $3,405 could pave the way toward $3,450+. However, a drop below the demand zone would invalidate the bullish outlook short-term.
Would you like a trading plan based on these scenarios?
Double Top or Bottom

USOIL Double Top Breakdown | Short Setup Alert!USOIL Double Top Breakdown | Short Setup Alert!
Hey traders! A classic Double Top pattern has formed on the 4H USOIL chart (Top 1 & Top 2), signaling a potential trend reversal. After breaking the neckline, price action confirms bearish momentum. The stop-out level is clearly marked at 70.00 , while the target zone is set around 58.00. This setup offers a great risk-reward ratio.
📍 Supertrend also aligns with bearish confirmation.
💬 Drop your thoughts in the comments section – let's discuss the trade!
❤️ If you find this helpful, don’t forget to support with a like and follow!
Stay sharp and trade safe!

We hit. We failed. Now we drop.OANDA:GBPAUD
Inside this price channel, the market is forming a flag in an attempt to break out.
But given the market cycle and three failed breakout attempts,
I believe it's time for sellers to take control.
📉 I’m siding with the bears on this one!

Political Uncertainty, Dollar Weakness & A Projected CorrectionDespite being a technical trader, there are some fundamental factors floating in the background of today's trading idea.
1) We saw weakness on the GBP today due to some political uncertainty & investors having concerns over the stability of the UK's leadership and economic direction.
2) We saw a drop in the ADP Non-Farm Employment Change for the US Dollar today which is starting to look like a trend rather than a one-off.
Why this is important is because, despite the very bearish day that the FX:GBPUSD had today, I don't think the GBP reaction is as relevant as it's shown and I do think the USD is weaker than it's shown on this particular chart, due to the reactions that we've seen on other crosses.
All in all, that this means is that I wouldn't be shocked to see today's move corrected and price is at the perfect technical level to do just that.
If you have any questions, comments or opinions, please don't hesitate to leave them below.
Akil

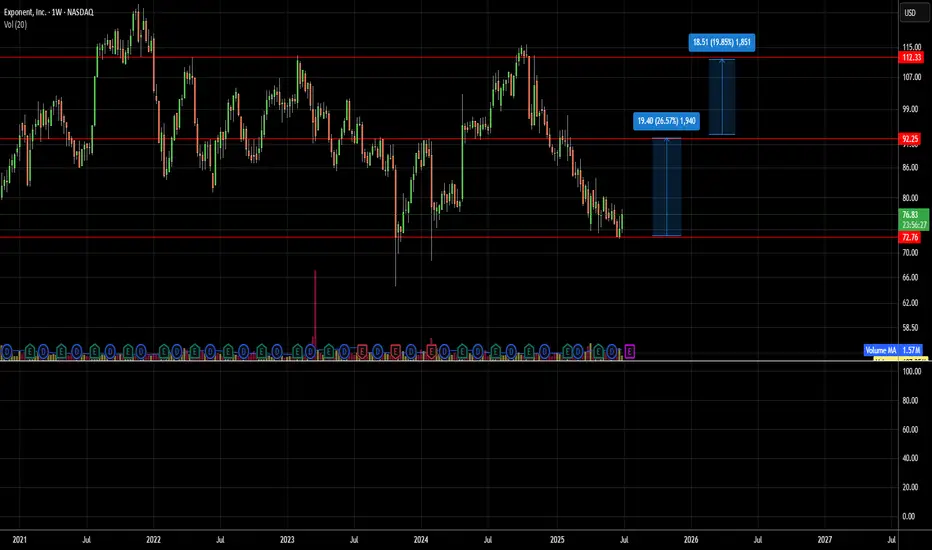
Expo near it's long term supportExponent, Inc. is a science and engineering consulting firm serving a diverse range of industries—including consumer products, energy, life sciences, environment, and health—with nearly 90 technical disciplines
Strengths
Robust financial health and profitability
High ROE and stable dividend payments
Risks
Modest growth vs peers
High payout ratio limits reinvestment
Recent insider selling could raise eyebrows
Valuation
Price/earnings slightly below historical norms
Significant upside potential per analysts (26–60%)
AUDNZDH4 double bottom off the daily support. Looking for longs only if price retests the neckline and gives bullish signals

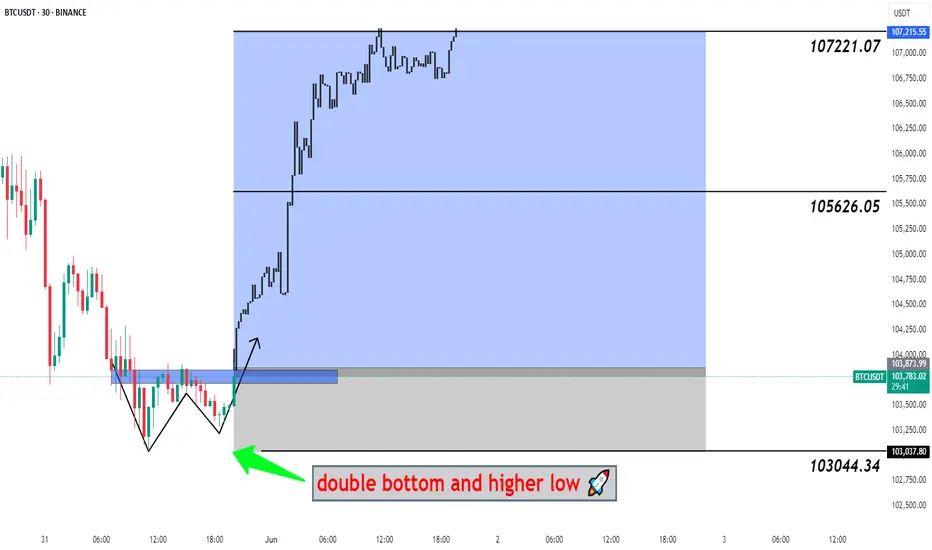
#BTCUSDT Big Pump Next Hour - Bitcoin, BTCUSD, BTCUSDT 📉 Double Bottom Pattern Forming – Potential Reversal Setup
The current price structure is showing signs of a Double Bottom – a classic bullish reversal pattern. After an extended downtrend, this pattern suggests that the market may be preparing for a trend reversal from this key demand zone.
🔹 Trade Setup
Entry, Targets, and Stop Loss (SL) are marked on the chart.
Entry: Upon breakout confirmation above the neckline.
Stop Loss: Just below the recent swing low to manage downside risk.
Targets: Calculated using the measured move method from the bottom to the neckline .
🔹 Risk & Money Management (Professional Approach)
To maintain consistent profitability and protect capital, strict risk management is essential. For this setup:
🔸 Position Sizing: Based on a fixed % of total capital (typically 1–2% of account equity per trade).
🔸 Risk-to-Reward Ratio: Minimum of 1:2, ideally higher.
🔸 Stop Loss Discipline: No arbitrary changes after entry. SL only adjusted for breakeven or trailing stops once price moves favorably.
🔸 Trade Management: Secure partial profits at key levels, trail stops as structure forms.
🔸 Capital Allocation: Avoid overexposure. Trade fits within overall portfolio strategy.
💬 Let the setup come to you. React, don’t predict.
🔁 Like, comment, or share your thoughts below!
BINANCE:BTCUSDT BITSTAMP:BTCUSD COINBASE:BTCUSD BINANCE:BTCUSDT.P INDEX:BTCUSD CRYPTOCAP:BTC.D CRYPTO:BTCUSD BYBIT:BTCUSDT.P BINANCE:BTCUSD
Double Bottom + Bullish DivergenceDouble Bottom Formation on Weekly basis.
Bullish Divergence appeared.
Crossing & Sustaining 25 may lead it towards 26 - 27
& then around 33 - 34.
However, it should not break 21.90

Ethereum - This structure decides everything!Ethereum - CRYPTO:ETHUSD - trades at a key structure:
(click chart above to see the in depth analysis👆🏻)
After Ethereum retested the previous all time high in the end of 2024, we saw quite a harsh move lower. This move was followed by an expected recovery, however Ethereum is still trading below a key structure. Either move is still possible and will shape the future of Ethereum.
Levels to watch: $2.500, $4.000
Keep your long term vision!
Philip (BasicTrading)

How to Trade Double Tops & Bottoms in TradingViewLearn how to identify, validate, and trade double top and double bottom reversal patterns using TradingView's charting tools in this comprehensive tutorial from Optimus Futures. Understanding these classic chart formations can help you spot potential trend reversals and capitalize on contrarian trading opportunities in the futures markets.
What You'll Learn:
• Understanding contrarian vs. continuation trading strategies and when to use each approach
• The psychology behind buying low and selling high through reversal pattern trading
• How to identify double top and double bottom formations on any timeframe
• Key characteristics of valid double tops and bottoms, including volume confirmation
• Using TradingView's XABCD pattern tool to validate potential double top/bottom setups
• Real-world example analysis using crude oil futures charts
• Risk management techniques for trading reversal patterns
• How to calculate appropriate entry points, stop losses, and profit targets
• Setting up 1:1 risk-reward ratios for mathematical trading edge
• Understanding win rate requirements for profitable pattern trading
• How double bottom patterns work as the inverse of double top formations
This tutorial may benefit futures traders, swing traders, and technical analysts interested in contrarian trading strategies and reversal pattern recognition. The concepts covered could help you identify potential turning points in market trends and develop systematic approaches to trading these classic chart formations.
Visit Optimus Futures to learn more about trading futures with TradingView: optimusfutures.com/Platforms/TradingView.php
Disclaimer:
There is a substantial risk of loss in futures trading. Past performance is not indicative of future results. Please trade only with risk capital. We are not responsible for any third-party links, comments, or content shared on TradingView. Any opinions, links, or messages posted by users on TradingView do not represent our views or recommendations. Please exercise your own judgment and due diligence when engaging with any external content or user commentary.
This video represents the opinion of Optimus Futures and is intended for educational purposes only. Chart interpretations are presented solely to illustrate objective technical concepts and should not be viewed as predictive of future market behavior. In our opinion, charts are analytical tools—not forecasting instruments. Market conditions are constantly evolving, and all trading decisions should be made independently, with careful consideration of individual risk tolerance and financial objectives.

BTC Pullback or Breakout? Key Levels to Watch Around 110KBitcoin is showing repeated rejections from the $110K and $108K zones. Currently, it's moving upward from the $98K area toward resistance, but price action remains compressed between the major trendline support and resistance.
This range-bound structure suggests that a pullback may be imminent, especially as RSI is forming consistent bearish divergence and the MACD is signaling weakness. A liquidity sweep to the downside could occur before a decisive move.
However, if BTC manages to break above the converging trendlines with strong volume, we may see a move toward $110K again for a retest. Watch $106K as an intermediate support. If that fails, further downside may follow.
📌 Trading Insight: Wait for confirmation before entering — don’t jump in without a clear signal.

"That last candlestick bar is a breakout 4hour (4H) session "I feel so sad because am in a situation
where i have to make a decision to receive government surpport.
Now personally i dont mind government surpport.
But doing it to please my family is not what i wanted.
It makes me sick.I hate politics.I love capitalism.
Eventhough capitalism and potics are related.
When you look at copper prices.Let me show
you a relation i saw.
On the futures prices of copper.I saw a weekly
brekout.This surprised me.It was at this time
that i then looked at the copper prices on the spot market.
TO my surprise i saw the manipulation for the
first time in my trading career,Instead of a breakout
it looked like an arbitrage.
I saw a perfect reversal on the weekly pattern.
How is that possible? When its clear
that a breakout price action is visible on the futures markets?
This connection between the futures market
of copper in india and the spot price in america.
Is something to thinnk about.
Its like mixing capitalism and politics it makes me sick
but maybe its a necessary evil just be careful
when you mix the two.
Stay humble, and see the attack coming and adjust your position
politics is very important and so dont ignore its power.
Just like studying the connection between the futures
markets and spot market.
If you look at this chart you will notice 3 candlestick patterns:
-Doji
-Hanging Man
-Bearish Engulfing.
The two Red candlestick patterns you are
seeing shows you the breakout price action.
That last candle stick bar is a breakout 4hour (4H) session entry
Rocket boost this content to learn more.
Disclaimer:Trading is risky.Please learn risk management and
profit taking strategies.Also feel free to use a simulation trading account before you
trade with real money.Also do not use margin trading.Trade safe.

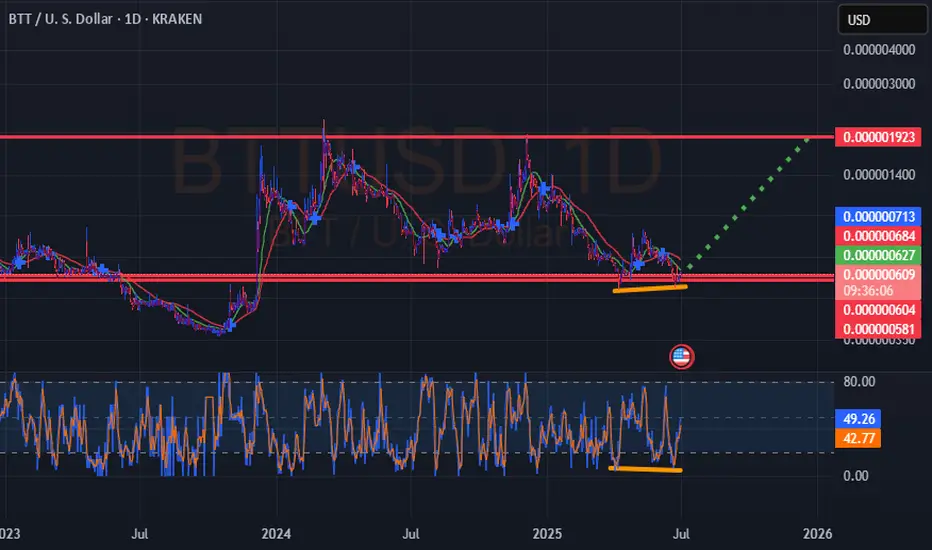
BTT USD Double BottomHi everyone. BTT in a double bottom pattern . Playing out the famous W. Let's hope it breaks through top resistance. Keep an eye for updates. Not financial advice, but probable.
WIF back to $3Complete look at Dog WIF Hat
We had some pretty nice technical setups on this meme.
#HVF
#DoubleTop
#InverseHeadandShoulders
#BullFlag
Currently it has two active patterns ...

How To Short Sell This Forex Pair In A 4h (Time Frame) EntryAm always a curious person and thats what
allows me to penetrate any culture.I have this knack for adventure.
This is means i enjoy challenging myself.
I dont want to live a boring life.So even when i visit
a "Extremely High" poverty area, am good.
Because i know i have to check in.
Every place in the world has these places.
You have to check in with the G's of
that area otherwise you cooked!!. These areas
are notorious to high crime, and disease.
So if you dont check in bro you f'*d!
Remember every trading signal has to have a double confirmation
think of this double confirmation like
checking in the "hood".
You might be the king in your area
but in another area bro you aint the king.
You have to stay humble.
If you want to learn more you have to check in
with the financial trading experts like myself.
Is that fair? heck no.But you gots to check in man.
If you want more coaching just hit
me up for a reason fee on a monthly
basis and i got you.
Rocket boost this content to learn more.
Disclaimer:Trading is risky learn risk management
and profit taking strategies.Also don't use margin.
Use a simulation trading account
before you trade with real money.

GOLD (XAUUSD): Your Trading Plan for Monday
Gold went strongly rejected from a key daily support on Friday.
Your confirmation signal for a pullback trade from that will
be a bullish breakout and an hourly candle close above
3283 intraday resistance.
After that the price will likely reach 3292 level.
❤️Please, support my work with like, thank you!❤️
I am part of Trade Nation's Influencer program and receive a monthly fee for using their TradingView charts in my analysis.

Failed to break higher — now it’s time to crash.After a sharp rally, the market has hit its previous all-time high.
📌 A double top is now forming — signaling a potential short-term pullback.
Get ready for a possible dip — let’s go! 🚨
OANDA:GBPCAD

SHORT ON NZD/CADNzd/cad has given us a double top with a confirmed change of character (choc)
to the downside.
I am waiting for price to reach into supply sweeping liquidity before taking a sell to the next demand level looking to catch 100-150 pips.

AUDNZD - Bullish Double BottomHello Traders !
On Wednesday 25 june, The AUDNZD reached the support level (1.07702 - 1.07584).
The price formed a double bottom pattern.
Currently, the neckline is broken !
So, I expect a bullish move🚀
______________
TARGET: 1.08260

EURCAD: Pullback Trade From Support 🇪🇺🇨🇦
EURCAD is going to bounce from a recently broken
key daily horizontal resistance that turned into support after a violation.
The price violated a neckline of a double bottom pattern with
a bullish imbalance candle on an hourly time frame as a confirmation.
Goal - 1.5998
I am part of Trade Nation's Influencer program and receive a monthly fee for using their TradingView charts in my analysis.

Gold LongsBullish weekly bias for Gold.
Classic Expansion Weekly profile in play. Price opened lower first, Im treating this as the possible manipulation for the week. Tuesday swept key ssl and closed back inside the range.
Drop to a 4h and OB is confirmed. 1h CISD aligned with 4h. Execution off 4h OB with stop at OB Low / Tuesday low. If BSL is the draw, I would like to see Tuesday low be protected.
LRLR is first low hanging fruit objective. 3420 roughly, with equal highs at 3476 being final target.

A very high quality potential of double top pattern A very high quality potential of double top pattern
Neck line already broken , now retest is happened and rejection confirmed by wicks rejecting and the daily candle gonna close bearish for extra confirmation
Entry plan
Entry : 107,100 , up to 107550
Tp 1 102600
Tp 2 : 101, 250
Tp 3 : 99,666
Runners : from 98,500 to 94,000 maximum
SL 108,800
Wish the best for all traders
MG Trader ✅

ADA About to Explode or Fakeout Trap?Yello Paradisers — is ADA quietly setting up for a powerful reversal, or are we about to walk straight into a painful bull trap? This zone could decide everything, and here’s why you need to pay close attention.
💎Cardano (ADAUSDT) is currently sitting right on the supportive trendline of a descending channel, while also forming a classic double bottom pattern. What makes this even more significant is the presence of bullish divergence on RSI. This combination alone already hints at a potential bullish reversal, but there’s more to it.
💎The current zone also served as a previous resistance area, and it has now flipped into support—this “resistance-turned-support” structure adds confluence and increases the probability of an upward move. When multiple bullish signals align at a major structural level like this, it usually sets the stage for a strong bounce.
💎Aggressive traders who entered early from current levels are already seeing a potential 1:1 risk-to-reward ratio. However, for safer and more strategic positioning, conservative traders can wait for a pullback to this support zone. Waiting for a bullish confirmation candle after the pullback can offer a better entry with a healthier RR and higher probability of success.
💎That said, if the price breaks below the current support and closes a candle below our invalidation level, the entire bullish idea will be invalidated. In that scenario, the smart move is to remain patient and wait for a new setup to form. Chasing trades after invalidation is how most retail traders get trapped—don’t be one of them.
🎖Strive for consistency, not quick profits. Treat the market as a businessman, not as a gambler. This is the only way you’ll make it far in your crypto trading journey. Be a PRO.
MyCryptoParadise
iFeel the success🌴
