US30 Momentum Rebuild: Breakout Retest Signals Potential Upside📈 DJI30 / US30 – Dow Jones Industrial Average Trade Opportunity Guide
🏛️ Market Context
The index is showing strong accumulation pressure, with buyers stepping back in as volatility narrows. Momentum tools and trend metrics continue to lean toward the upside, creating a setup where disciplined layering becomes highly effective for precision entries.
🔥 Trade Plan – Bullish Strategy in Play
✅ Technical Confirmation
KIJUN MA accumulation indicates steady buy-side pressure building beneath price.
HULL Moving Average breakout completed with a clean pullback + retest, confirming trend continuation strength.
Market structure remains constructive with higher lows forming consistently.
🎯 Entry Plan (Layering Method Included)
Any price level can be used, but this plan uses Thief Layering Strategy for controlled scaling:
💠 Buy Limit Layers:
47,000
47,250
47,500
47,750
48,000
(Traders can add more layers depending on personal risk and capital allocation style.)
🛡️ Stop Loss (SL)
Thief SL → 46,750
Dear Ladies & Gentlemen (Thief OGs): Please adjust according to personal strategy and risk. This SL is an example, not a fixed rule. Trade with your own management principles.
🎯 Target (TP)
Main Target → 49,500
The market is approaching major moving-average resistance + overbought zones + potential trap regions. It’s wise to secure profits as the index reaches upper supply levels.
Again, Ladies & Gentlemen (Thief OGs): TP is flexible. Manage your profit bookings based on your personal approach.
🌍 Related Pairs to Watch & Correlations
1️⃣ SP:SPX / S&P 500
Often moves in high correlation with US30.
Strong bullish momentum here typically supports US30 upside.
Watch for divergence → if SPX stalls while US30 pushes, upside may weaken.
2️⃣ NASDAQ:NDX / NAS100 (Nasdaq 100)
Tracks tech sentiment, which influences overall US risk appetite.
If NAS100 shows weakness while Dow is rising, expect mixed flows → Dow may slow down but still hold structure.
3️⃣ TVC:VIX (Volatility Index)
Inverse correlation to US30.
Falling VIX = stronger risk-on behavior, supporting bullish Dow positions.
Sudden VIX spikes signal caution on existing long positions.
4️⃣ TVC:DXY (US Dollar Index)
Strong Dollar sometimes suppresses equity momentum.
If DXY drops, US30 tends to gain strength as liquidity flows to equities.
5️⃣ CBOT_MINI:YM1! (Dow Futures)
The closest real-time mirror of US30 price action.
Useful for re-entry timing during pullbacks and session gaps.
🧭 Final Notes
Stay disciplined with your own SL/TP logic, manage exposure through layered entries, and monitor correlation assets for confirmation. This is a flexible play designed for DAY & Swing traders who thrive in momentum-driven environments.
Dowjonesindustrial
US30 Dow Jones Weekly Open Retest Strategy’m watching US30 (Dow Jones) closely right now, and it’s been in a strong bullish trend over the last two weeks. 📈🔥 We’ve seen two powerful drives to the upside, and there’s a good chance we could get that classic third drive completing a three-drive pattern before the week ends.
As price pushed higher, it’s already dipped back down into sell-side liquidity, clearing out those resting lows. That kind of move often sets the stage for another leg higher, so it’s definitely possible we see US30 continue north from the current levels. ⬆️💰
At the same time, it wouldn’t surprise me to see price pull back a bit more, possibly dipping below the weekly open to rebalance before making its next move.
Either way, my focus is on the weekly open. I want to see price break through it, come back, retest it, and show me that the level is now acting as support. That retest is the zone where I’d be interested in looking for long opportunities. 🟩📊
Stay patient and wait for clean structure.
Not financial advice.

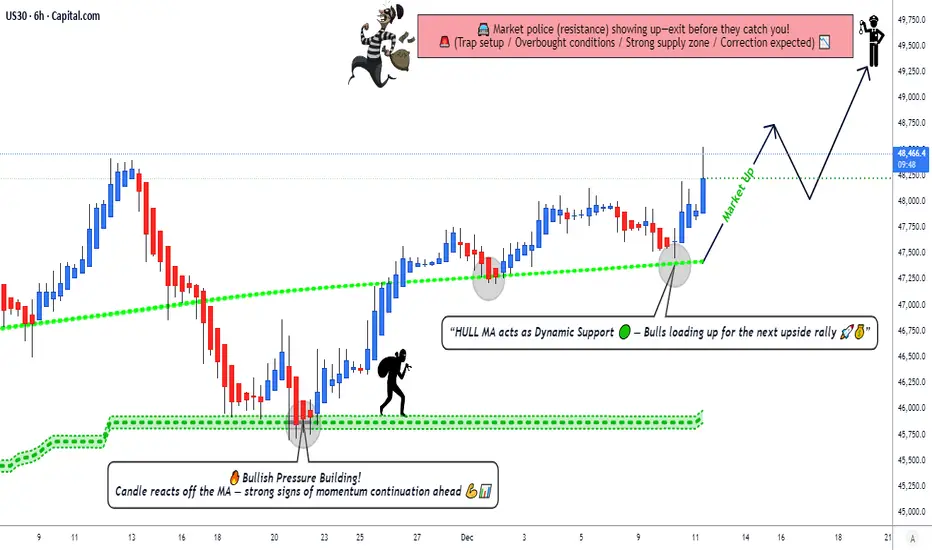
Can the Dow Jones Continue Its Bullish Momentum This Week?🚀 US30/DJI Dow Jones - Bullish Pullback Opportunity 📈
Professional Market Blueprint | Swing Trade Setup
📊 TRADE OVERVIEW
Asset: US30/DJI - Dow Jones Industrial Average Index
Timeframe: Swing Trade (4H-Daily)
Bias: 🟢 BULLISH - Hull MA Pullback Strategy
Confirmation: Heikin Ashi Reversal Candle Pattern
🎯 ENTRY STRATEGY - "LAYERING METHOD" 🎯
Approach: Multiple limit orders (Professional Risk Distribution)
Layer Entry Points:
Layer 1: 46,600 🔵
Layer 2: 46,800 🔵
Layer 3: 47,000 🔵
Layer 4: 47,200 🔵
💡 Tip: Adjust additional layers based on your risk tolerance and account size
🛑 RISK MANAGEMENT
Stop Loss: 46,400
⚠️ DISCLAIMER: This is a reference level only. You manage your own risk. Adjust SL according to your strategy and risk profile.
Take Profit Target: 48,800
📌 Rationale: Moving Average resistance + Overbought zone + Trap detection
⚠️ DISCLAIMER: This is a reference level only. You manage your own risk. Take profits at your own discretion.
📈 TECHNICAL CONFLUENCE
✅ Hull Moving Average - Bullish alignment & pullback structure
✅ Heikin Ashi Reversal - Confirmation candle pattern at entry zones
✅ Moving Average Resistance - Strong rejection level near TP
✅ Overbought Divergence - Potential trap for trap traders
✅ Risk/Reward Ratio - Favorable 1:3+ setup potential
🔗 RELATED PAIRS TO WATCH - CORRELATION ANALYSIS
📍 AMEX:SPY - S&P 500 ETF (Positive Correlation - 0.92)
US30 follows broad market sentiment. SPY strength = DJI bullish momentum.
📍 NASDAQ:QQQ - Nasdaq-100 ETF (Positive Correlation - 0.85)
Tech sector performance impacts overall market. Monitor for divergence signals.
📍 AMEX:IWM - Russell 2000 (Small Cap) (Positive Correlation - 0.88)
Small-cap rotations precede index moves. Early trend confirmation signal.
📍 AMEX:GLD - Gold Spot Price (Inverse Correlation - -0.45)
Risk-on sentiment (bullish DJI) = weaker gold. Inverse hedge setup.
📍 TVC:VIX - Volatility Index (Inverse Correlation - -0.70)
Rising VIX = market fear = DJI pullback risk. Monitor at entry zones.
📍 TVC:US10Y Yield (Negative Correlation - -0.55)
Rising yields pressure equities. Check yield strength before entries.
📍 TVC:DXY - US Dollar Index (Weak Negative - -0.30)
Stronger dollar = export headwinds. Minor impact, secondary indicator.
⚡ KEY TRADING RULES
🔴 BEFORE ENTRY:
Confirm Hull MA slope is positive
Wait for Heikin Ashi reversal candle close
Check VIX & SPY alignment
Ensure no major economic events
🟢 AT ENTRY:
Use layering strategy (don't chase)
Build position gradually across 4 layers
Scale risk based on account size
Document entry price & time
🟡 DURING TRADE:
Trail stop loss after +1% profit
Monitor related pairs for divergence
Close 50% at +2% for risk-free trade
Let remainder run to target
🔵 EXIT PLAN:
Target: 48,800 (reference level)
Or: Exit on Heikin Ashi reversal signal
Or: Close on MA resistance rejection
Never hold into major news events

US30 - DOW Hits Major Supply Reversal coming on Dow as it hits a major supply zone. This is part of a bigger cross-asset move that I am anticipating across global equities. I see a synchronised sell off in global equities coming this month.

Dow Jones Attempts to Reach New HighsThe index has managed to maintain a gain of more than 2% over the past six trading sessions, attempting once again to approach its historical highs as the market holds a consistent short-term bullish bias. For now, buying pressure has remained supported by a temporary rebound in market confidence, driven by expectations of lower interest rates from the Federal Reserve next week. If this improvement in confidence continues, current buying pressure could remain dominant in the sessions ahead.
Uptrend Line Remains Relevant
The long-term upward trendline visible in the Dow Jones has continued to hold despite recent fluctuations, and so far, no meaningful bearish correction has emerged to threaten its structure in the short term. As a result, it remains the most important technical factor to watch, especially if price manages to reach the previous high zone again, which would confirm a dominant bullish bias heading into year-end.
RSI
The RSI continues to fluctuate slightly above the neutral 50 level, suggesting that average buying momentum over the last 14 sessions remains dominant. If the RSI line continues to show steady growth, buying pressure could strengthen further.
MACD
The MACD remains very close to the neutral zero line, reflecting a sense of neutrality in the strength of short-term moving averages. Although there is buying pressure in the Dow Jones, the lack of a clear recovery in the histogram may lead to a period of consistent indecision, producing narrow-range candles and signaling a possible pause in the bullish momentum.
Key Levels to Watch:
48,248 points – Major resistance
This level corresponds to the historical highs and remains the most important bullish barrier. Buying movements approaching this zone could reactivate a strong bullish bias and extend the current upward trendline.
46,821 points – Nearby barrier
A level aligned with the 50-period simple moving average. It may serve as a key area to monitor in case of potential short-term bearish corrections.
45,677 points – Primary support
This level corresponds to the recent lows. If price approaches this zone again through bearish movements, it could signal the end of the current uptrend and open the door to a more meaningful bearish bias in the short term.
Written by Julian Pineda, CFA, CMT – Market Analyst

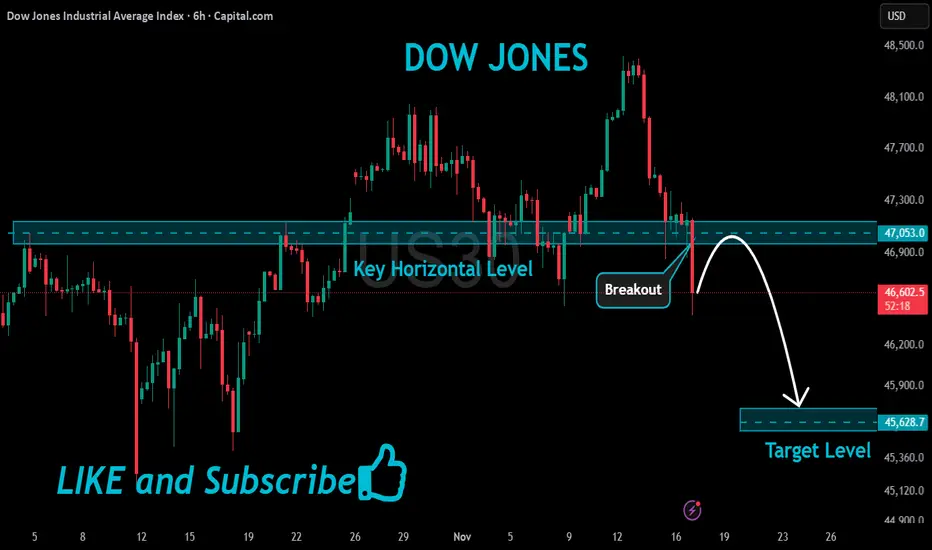
US30 Bearish Breakout!
HI,Traders !
#US30 made a bearish
Breakout of the key horizontal
Level of 47053.0 and the
Breakout is confirmed
So we are bearish biased
And we will be expecting
A further bearish move down !
Comment and subscribe to help us grow !
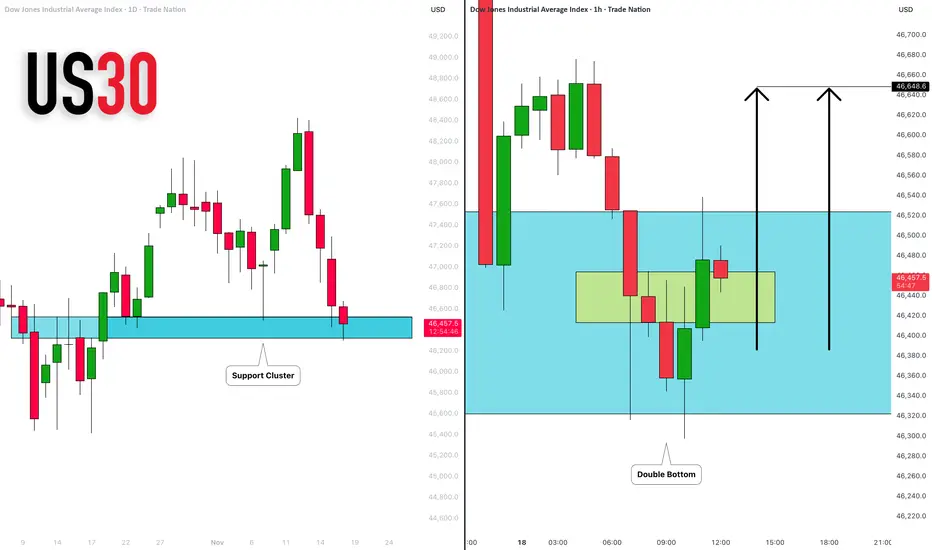
DOW JONES INDEX (US30): Time to Buy?!
It feels like US30 has finally found a bottom.
I see a strong buying interest after a test of a key
historic support cluster.
I anticipate a pullback at least to 46648
❤️Please, support my work with like, thank you!❤️
I am part of Trade Nation's Influencer program and receive a monthly fee for using their TradingView charts in my analysis.
Trading US30 DOW JONES: Bullish Momentum Here's My Trade PlanYesterday in my video 🎥, I mentioned that if US30 broke out to the upside, I'd look to enter long. That’s exactly what happened—big breakout! 🌟 Now, I’m waiting for a pullback 🕰️ to my optimal entry zone and a confirmed market structure shift for another buy opportunity 💵. (Not financial advice) 📝

US30 Strategy: Waiting for Confirmation Amid Conflicting Trends🔥📉 Currently checking out the US30 (Dow Jones)! On the ⏰ 4-hour chart, the vibe is definitely bearish, but when you zoom out to the 📅 daily chart, things look much more bullish 🚀. For me, this index is at a real crossroads! 👉
🔎 On the 30-minute chart, I’m watching closely for a bullish breakout above the recent high and a key break of structure 🟢📈 — that would spark a potential buy opportunity!
💼 If instead, price slips below the current high and we see a bearish shift in structure 🚩📉, I’m eyeing a possible sell setup!
❗️Of course, this is just my view, not financial advice! 🚫💸

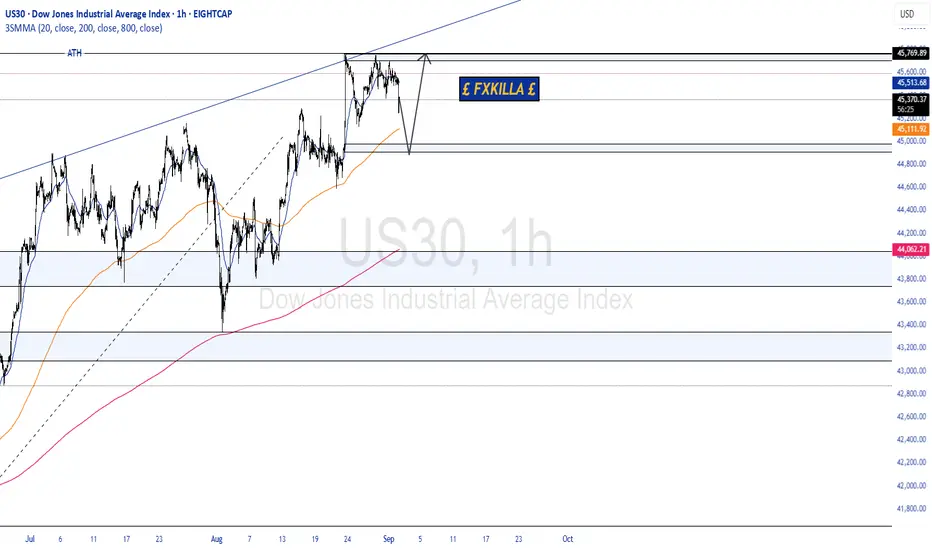
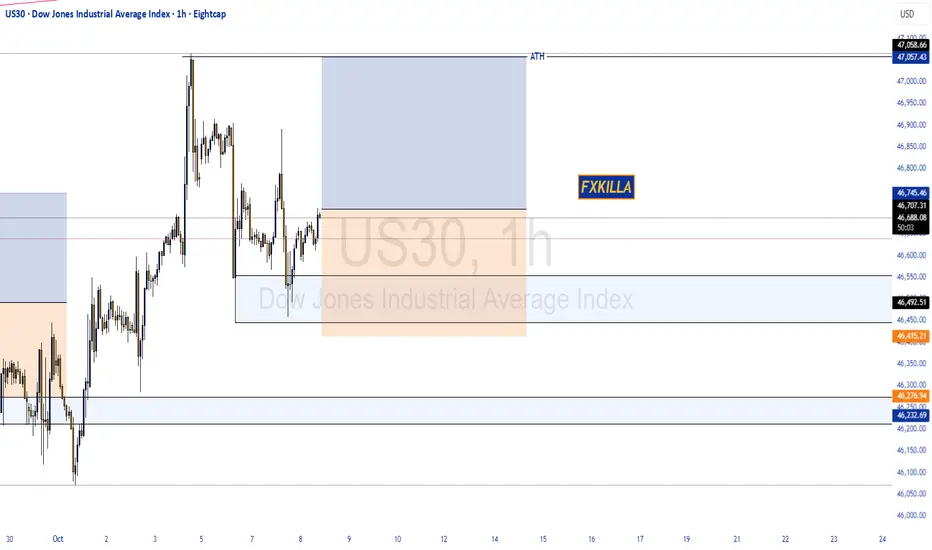
DOW JONES INDUSTRIAL HIGH PROBABILITY SETUP SOON!!!🚨 DOW30 HIGH PROBABILITY BUY SETUP 🚨
* Here We Can See Clearly The Next Potential Moves For US30 Coming Hours/Days.
* Keep Your Eyes Close On Your Trading Positions.
* Happy PIP Hunting Traders.
FXKILLA.

DOW JONES HIGH PROBABILITY SETUPS SOON!!!🚨 DOW30 HIGH PROBABILITY SELL/BUY SETUP 🚨
* Here We Can See Clearly The Next Potential Moves For US30 Coming Hours/Days.
* Keep Your Eyes Close On Your Trading Positions.
* Happy PIP Hunting Traders.
FXKILLA.

US30 DOW JONES | Elite Technical Analysis & Trading Masterclass 🔵 US30 DOW JONES | Elite Technical Analysis & Trading Masterclass | 47,566.1 🔵
📊 INSTITUTIONAL GRADE MULTI-TIMEFRAME BREAKDOWN | NOV 3-7, 2025 FORECAST 📊
Current Level: 47,566.1 | Analysis Timestamp: November 1, 2025, 00:54 UTC+4
▬▬▬▬▬▬▬▬▬▬▬▬▬▬▬▬▬▬▬▬▬▬▬▬▬▬▬▬▬▬▬▬▬▬▬▬▬▬▬▬
🎯 EXECUTIVE MARKET BRIEFING & STRATEGIC OVERVIEW
The Dow Jones Industrial Average trades at 47,566.1 , positioned at a critical inflection point that will define the market's trajectory for Q4 2025. Our institutional-grade analysis reveals a bullish bias with caution as price tests the upper boundary of a major ascending channel. This week's forecast combines classical technical analysis with modern algorithmic insights to deliver precision entry and exit strategies for both scalpers and position traders.
Institutional Support Zones: 🛡️
Primary Defense: 47,450 - 47,480 (High-frequency algo support)
Secondary Buffer: 47,350 - 47,380 (Volume-weighted anchor)
Critical Floor: 47,200 - 47,250 (Weekly pivot cluster)
Major Foundation: 47,000 - 47,050 (Psychological & structural)
Resistance & Target Matrix: 🎯
Immediate Cap: 47,650 - 47,680 (Intraday supply zone)
Secondary Barrier: 47,750 - 47,800 (Daily resistance band)
Breakout Zone: 47,900 - 47,950 (Pattern completion area)
Major Target: 48,100 - 48,150 (Weekly extension objective)
▬▬▬▬▬▬▬▬▬▬▬▬▬▬▬▬▬▬▬▬▬▬▬▬▬▬▬▬▬▬▬▬▬▬▬▬▬▬▬▬
📈 WEEKLY TIMEFRAME (1W) - MACRO STRUCTURE ANALYSIS
Elliott Wave Grand Supercycle: 🌊
We're navigating Intermediate Wave (3) of Primary Wave 5 within the grand supercycle. The current consolidation represents a Wave 4 triangle with explosive Wave 5 potential targeting 48,500-49,000. Alternative bearish count suggests completion of Wave B with Wave C decline risk below 47,000.
Wyckoff Method Application: 📚
Current Phase: Late Stage Re-Accumulation
- Preliminary Support (PS): 46,800
- Selling Climax (SC): 46,500
- Automatic Rally (AR): 47,800
- Secondary Test (ST): Successfully held 46,900
Next: Sign of Strength (SOS) breakout above 47,800
Ichimoku Cloud Master Analysis: ☁️
Weekly cloud remains decisively bullish with price trading above both Senkou spans. Chikou Span shows clear space - no resistance overhead. The lagging span at 47,200 confirms the uptrend integrity. Cloud thickness of 450 points provides substantial support cushion.
Advanced Harmonic Recognition: 🦋
Developing Bullish Bat pattern with critical ratios:
- XA retracement: 0.886 at 47,350 ✅
- AB extension: 0.382-0.5 zone active
- BC projection: Targeting 1.618-2.618 at 48,200-48,500
- Pattern invalidation: Below 47,100
▬▬▬▬▬▬▬▬▬▬▬▬▬▬▬▬▬▬▬▬▬▬▬▬▬▬▬▬▬▬▬▬▬▬▬▬▬▬▬▬
📊 DAILY TIMEFRAME (1D) - SWING TRADING BLUEPRINT
Master Candle Analysis: 🕯️
Yesterday's Hammer candlestick at 47,450 support confirms buyer absorption. The long lower shadow indicates institutional accumulation . Today's confirmation above 47,600 would complete a Morning Star reversal pattern.
Chart Pattern Mastery:
Currently resolving a Symmetrical Triangle with apex at 47,600. Breakout implications:
- Upside breakout: Targets 48,150 (measured move)
- Downside break: Targets 47,100 (risk scenario)
- Volume requirement: 20% above average for validation
Bollinger Bands Strategy: 📈
Upper Band: 47,720 (resistance)
Middle Band (20 SMA): 47,480 (support)
Lower Band: 47,240 (oversold zone)
Band Width: Contracting - Squeeze imminent
%B Reading: 0.72 (bullish momentum)
RSI Divergence Analysis:
Daily RSI at 58 with hidden bullish divergence detected. The RSI trend line from October lows remains intact. Overbought threshold at 70 provides 12 points of upside momentum potential.
▬▬▬▬▬▬▬▬▬▬▬▬▬▬▬▬▬▬▬▬▬▬▬▬▬▬▬▬▬▬▬▬▬▬▬▬▬▬▬▬
⚙️ 4-HOUR TIMEFRAME (4H) - TACTICAL POSITIONING
Gann Theory Application: 📐
Price respecting the 2x1 Gann angle from October low at 46,200. Current intersection at 47,550 acting as dynamic support. Next Gann resistance levels:
- 1x1 angle: 47,750
- 1x2 angle: 47,920
- Square of 9: 48,100
Dow Theory Confirmation:
Primary Trend: Bullish (higher highs/lows intact)
Secondary Trend: Consolidation phase
Minor Trend: Testing resistance
Volume Confirmation: Accumulation on dips
Breadth Analysis: 70% of Dow components bullish
Moving Average Orchestra:
EMA 20: 47,520 (immediate support)
EMA 50: 47,440 (strong support)
SMA 100: 47,350 (critical support)
SMA 200: 47,180 (major trend support)
Pattern Alert: ⚡
Textbook Bull Flag formation with pole from 47,200 to 47,800. Flag consolidation between 47,500-47,650. Breakout above 47,650 projects 48,250 target.
▬▬▬▬▬▬▬▬▬▬▬▬▬▬▬▬▬▬▬▬▬▬▬▬▬▬▬▬▬▬▬▬▬▬▬▬▬▬▬▬
💫 1-HOUR TIMEFRAME (1H) - INTRADAY PRECISION
Micro Pattern Development: 🔬
Inverse Head & Shoulders building:
- Left Shoulder: 47,480
- Head: 47,420
- Right Shoulder: Forming at 47,490
- Neckline: 47,580
- Target upon breakout: 47,740
VWAP Strategy Matrix:
Daily VWAP: 47,535
Weekly VWAP: 47,485
Monthly VWAP: 47,320
Upper Band 1: 47,610 (first target)
Upper Band 2: 47,685 (second target)
Lower Band 1: 47,460 (first support)
Support & Resistance Precision Map:
R3: 47,750 | R2: 47,680 | R1: 47,620
PIVOT: 47,566 (current price)
S1: 47,510 | S2: 47,450 | S3: 47,380
▬▬▬▬▬▬▬▬▬▬▬▬▬▬▬▬▬▬▬▬▬▬▬▬▬▬▬▬▬▬▬▬▬▬▬▬▬▬▬▬
⚡ 30-MINUTE SCALPING LABORATORY (30M)
Micro Structure Dynamics: 🎪
Ascending channel with precise boundaries:
- Upper channel: 47,620-47,640
- Mid-channel: 47,550-47,570
- Lower channel: 47,480-47,500
Volume Profile Insights: 📊
Point of Control (POC): 47,540
Value Area High (VAH): 47,590
Value Area Low (VAL): 47,490
High Volume Node: 47,500-47,550 (accumulation zone)
Scalping Execution Zones:
Long Zone A: 47,520-47,530 (VWAP test)
Long Zone B: 47,490-47,500 (channel bottom)
Short Zone A: 47,620-47,630 (channel top)
Short Zone B: 47,680-47,690 (resistance cluster)
▬▬▬▬▬▬▬▬▬▬▬▬▬▬▬▬▬▬▬▬▬▬▬▬▬▬▬▬▬▬▬▬▬▬▬▬▬▬▬▬
🏃 15-MINUTE & 5-MINUTE HYPERSPEED TRADING
15-Minute Lightning Setups: ⚡
Bullish Pennant completion imminent at 47,580. Breakout targets:
- Target 1: 47,620 (+40 points)
- Target 2: 47,660 (+80 points)
- Stop Loss: 47,540 (-40 points)
5-Minute Algo Trading Signals:
Entry Triggers:
- RSI < 30 + VWAP touch = Long signal
- RSI > 70 + Resistance = Short signal
- MACD crossover + Volume spike = Trend entry
Exit Rules:
- 20-point profit target OR
- RSI extremes (>80 or <20) OR
- VWAP band 2 touch
Session-Based Trading Plan: 🕐
Asian Session: Range 47,520-47,580 (60 points)
London Open: Breakout potential above 47,600
NY Premarket: Volatility increase to 80+ points
NY Session: Directional move 100+ points
NY Close: Position squaring near 47,550
▬▬▬▬▬▬▬▬▬▬▬▬▬▬▬▬▬▬▬▬▬▬▬▬▬▬▬▬▬▬▬▬▬▬▬▬▬▬▬▬
📅 WEEK AHEAD PLAYBOOK (NOVEMBER 3-7, 2025)
Monday, November 3: 🚀
Gap probability: 70% bullish to 47,620+
Strategy: Buy dips to 47,520, target 47,680
Key levels: Support 47,480, Resistance 47,700
Tuesday, November 4: 🗳️
Election Day volatility - 150+ point swings expected
Strategy: Straddle positions, tight stops
Range forecast: 47,350-47,750
Wednesday, November 5: 💥
Post-election directional breakout
Strategy: Follow the breakout with size
Bullish above 47,800, Bearish below 47,300
Thursday, November 6: 📊
Fed speak and data releases
Strategy: Fade extremes with mean reversion
Expected range: 47,500-47,900
Friday, November 7: 🎯
Weekly options expiry - gamma pinning likely
Strategy: Sell premium around 47,750 strike
Weekly close above 47,750 = Bullish continuation
▬▬▬▬▬▬▬▬▬▬▬▬▬▬▬▬▬▬▬▬▬▬▬▬▬▬▬▬▬▬▬▬▬▬▬▬▬▬▬▬
⚖️ PROFESSIONAL RISK MANAGEMENT FRAMEWORK
Intraday Risk Protocol: 🛡️
Position size: 1-2% risk per trade maximum
Risk-Reward: Minimum 1:2, target 1:3
Daily loss limit: -3% circuit breaker
Consecutive losses: Max 3, then stop
Profit protection: Trail stop at 50% of max profit
Break-even: Move stop to entry at +30 points
Swing Position Architecture: 📈
Core position: 40% at 47,450-47,500
Scale-in levels: 30% at 47,350, 30% at 47,250
Stop loss: Below 47,150 (all positions)
Target 1: 47,850 (30% exit)
Target 2: 48,100 (40% exit)
Target 3: 48,350 (20% exit)
Runner: 48,500+ (10% moon bag)
▬▬▬▬▬▬▬▬▬▬▬▬▬▬▬▬▬▬▬▬▬▬▬▬▬▬▬▬▬▬▬▬▬▬▬▬▬▬▬▬
🔴 BEARISH CONTINGENCY & RISK SCENARIOS
Invalidation Triggers: 🐻
Hourly close below 47,450 = Caution signal
4H close below 47,350 = Bearish shift likely
Daily close below 47,200 = Trend reversal warning
Weekly close below 47,000 = Major bearish confirmation
Black Swan Risk Matrix: 🦢
• Geopolitical escalation (200+ point gaps)
• Federal Reserve surprise (150+ point moves)
• Corporate earnings shocks (100+ point swings)
• Technical failures (flash crashes)
• Algorithmic liquidations (cascading stops)
▬▬▬▬▬▬▬▬▬▬▬▬▬▬▬▬▬▬▬▬▬▬▬▬▬▬▬▬▬▬▬▬▬▬▬▬▬▬▬▬
🎯 HIGH-CONVICTION CONFLUENCE ZONES
Golden Buy Zone: ✅
47,450-47,500
(Multi-timeframe support + Fibonacci cluster + Volume POC + Moving average confluence)
Premium Sell Zone: ❌
47,850-47,900
(Major resistance + Pattern targets + Round number + Weekly R1 pivot)
Breakout Confirmation: 🚀
47,680-47,720
(Triangle breakout + Flag completion + Bollinger Band penetration)
▬▬▬▬▬▬▬▬▬▬▬▬▬▬▬▬▬▬▬▬▬▬▬▬▬▬▬▬▬▬▬▬▬▬▬▬▬▬▬▬
💎 MASTER TRADER'S FINAL VERDICT
The Dow Jones at 47,566.1 presents a high-probability bullish setup with clearly defined risk parameters. The convergence of technical indicators, pattern completions, and volume dynamics creates an asymmetric risk-reward opportunity favoring longs above 47,450.
Week's Best Trade Setups: 🏆
Swing Long: 47,450-47,500 zone → Target: 48,100
Breakout Long: Above 47,680 → Target: 47,900
Scalp Long: VWAP touches at 47,535 → Target: 47,620
Success Keys: 🔑
Trade with the trend, but protect your capital. Size positions appropriately. Honor stop losses religiously. Let winners run with trailing stops.
"In trading, the disciplined mind triumphs over the brilliant mind" - Master the process, profits follow! 💰
▬▬▬▬▬▬▬▬▬▬▬▬▬▬▬▬▬▬▬▬▬▬▬▬▬▬▬▬▬▬▬▬▬▬▬▬▬▬▬▬
#US30 #DowJones #DJI #TechnicalAnalysis #Trading #StockMarket #Indices #DayTrading #SwingTrading #ElliottWave #Wyckoff #GannTheory #PriceAction #TradingStrategy #MarketAnalysis #InstitutionalTrading #OrderFlow #VolumeProfile #TradingView #SPX500 #MarketForecast
🔔 Follow for Institutional-Grade Analysis Daily! | Excellence in Execution 📊
Risk Disclosure: Trading involves substantial risk. Past performance is not indicative of future results. Always conduct thorough research and implement strict risk management protocols.
DOW JONES 30 HIGH PROBABILITY SETUP SOON!!!🚨 DJ30 HIGH PROBABILITY SELL SETUP 🚨
* Here We Can See Clearly The Next Potential Moves For US30 Coming Hours/Days.
* Keep Your Eyes Close On Your Trading Positions.
* Happy PIP Hunting Traders.
FXKILLA.

DOW JONES INDUSTRIAL HIGH PROBABILITY SETUP SOON!!!🚨 DJ30 HIGH PROBABILITY SELL SETUP 🚨
* Here We Can See Clearly The Next Potential Move For US30 Coming Hours/Days.
* Keep Your Eyes Close On Your Trading Positions.
* Happy PIP Hunting Traders.
FXKILLA.

DOW JONES HIGH PROBABILITY SETUP SOON!!!🚨 DOW30 HIGH PROBABILITY BUY SETUP 🚨
* Here We Can See Clearly The Next Potential Move For US30 Coming Hours/Days.
* Keep Your Eyes Close On Your Trading Positions.
* Happy PIP Hunting Traders.
FXKILLA.
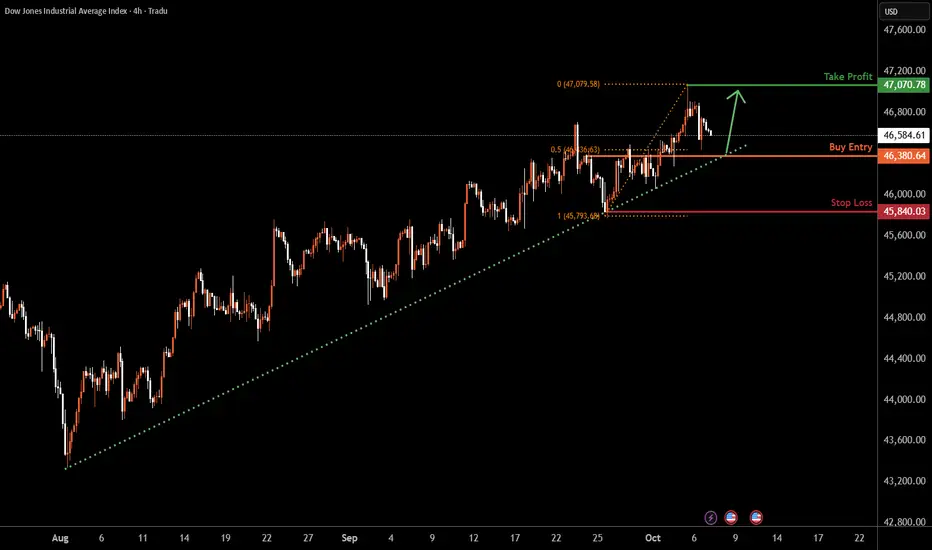
US30 H4 | Continuation Of Bullish MomentumBased on the H4 chart analysis, we could see the price fall to the buy entry at 46,380.64, whichis a pullback support that aligns with the 50% Fibonacci retracement and could bounce from this level to the upside.
Stop loss is at 45,840.03, which is a pullback support.
Tak eporfit is at 47,070.78, which is a swing high resistance.
High Risk Investment Warning
Trading Forex/CFDs on margin carries a high level of risk and may not be suitable for all investors. Leverage can work against you.
Stratos Markets Limited (tradu.com ):
CFDs are complex instruments and come with a high risk of losing money rapidly due to leverage. 65% of retail investor accounts lose money when trading CFDs with this provider. You should consider whether you understand how CFDs work and whether you can afford to take the high risk of losing your money.
Stratos Europe Ltd (tradu.com ):
CFDs are complex instruments and come with a high risk of losing money rapidly due to leverage. 66% of retail investor accounts lose money when trading CFDs with this provider. You should consider whether you understand how CFDs work and whether you can afford to take the high risk of losing your money.
Stratos Global LLC (tradu.com ):
Losses can exceed deposits.
Please be advised that the information presented on TradingView is provided to Tradu (‘Company’, ‘we’) by a third-party provider (‘TFA Global Pte Ltd’). Please be reminded that you are solely responsible for the trading decisions on your account. There is a very high degree of risk involved in trading. Any information and/or content is intended entirely for research, educational and informational purposes only and does not constitute investment or consultation advice or investment strategy. The information is not tailored to the investment needs of any specific person and therefore does not involve a consideration of any of the investment objectives, financial situation or needs of any viewer that may receive it. Kindly also note that past performance is not a reliable indicator of future results. Actual results may differ materially from those anticipated in forward-looking or past performance statements. We assume no liability as to the accuracy or completeness of any of the information and/or content provided herein and the Company cannot be held responsible for any omission, mistake nor for any loss or damage including without limitation to any loss of profit which may arise from reliance on any information supplied by TFA Global Pte Ltd.
The speaker(s) is neither an employee, agent nor representative of Tradu and is therefore acting independently. The opinions given are their own, constitute general market commentary, and do not constitute the opinion or advice of Tradu or any form of personal or investment advice. Tradu neither endorses nor guarantees offerings of third-party speakers, nor is Tradu responsible for the content, veracity or opinions of third-party speakers, presenters or participants.
Dow Jones US30 Analysis: Bullish Trend, Trade Plan📊 The US30 (Dow Jones) remains in a strong bullish trend, showing a clear sequence of higher highs and higher lows on the 4-hour chart 📈. However, when viewed on the daily timeframe, price now appears somewhat overextended ⚠️.
🔎 Dropping down to the lower timeframes and applying the Anchored VWAP (AVWAP) indicator, it’s evident that price is trading well above VWAP, signaling a premium zone. The risk here is that traders may continue buying into strength without acknowledging that price could easily retrace back into VWAP.
💡 Remember — smart money buys at a discount, not at a premium. In bullish trends like this, patience is crucial.
📹 In the video, I outline my trade plan, which focuses on waiting for a healthy pullback and then looking for a bullish setup if the structure aligns in our favor. I’m not interested in chasing price when it’s this extended — instead, I prefer to wait for the retracement and enter at better value, reducing risk and improving trade quality 🎯.
⚠️ Disclaimer: This analysis is for educational purposes only and not financial advice. Always trade responsibly and manage risk carefully.

Can You Escape the US30 High Voltage Trap in Time?💎 US30/DJ30 High Voltage Bullish Heist Plan 💎
💰 Asset: US30 / DJ30 Index CFD
🚀 Plan: Bullish — Thief OG Layered Buy Attack 🏴☠️
📍 Entry: Any price level — we’re layering in with the Bull Grid Strategy like a true market bandit.
🎯 Layered Buy Limits:
44,900 💵
44,700 💵
44,400 🔥
(💡 You can add more layers — the more vault doors you crack, the more loot you grab!)
🛑 Stop Loss: Thief SL @ 44,000 🛑 — adjust to your own risk appetite & strategy, ladies & gentlemen of the Thief OG Crew.
💎 Target: 46,300 🎯 — ⚡ high-voltage electric trap ahead! Escape with the stolen money at 46,200 before the market guards catch you.
🏴☠️ The Heist Blueprint 🏴☠️
We’re hitting US30 with multi-layer entries, scooping up the dip zones like professional vault breakers. The bull gang is in control — momentum, sentiment, and greed all lining up for a payday.
Rules of Engagement:
Use multiple buy limit layers — stack ‘em like gold bars.
Stick to longs only — don’t rob against the tide.
Place alerts at each limit level — no sleeping during the heist.
Use trailing SL to secure stolen profits while the robbery’s still in progress.
📊 Why Bullish?
US30 showing strong momentum fueled by market optimism, earnings strength, and liquidity flooding in. Macro vibes = bullish; sentiment = greedy. Bears? Scattered and broke.
⚠️ Risk & News Alert:
Avoid entry during high-volatility news drops — even thieves hate unpredictable explosions.
Manage positions like a pro — protect the stash.
💖 If this heist plan makes you richer or braver, hit that BOOST and join the Thief Trader Army. Every boost powers our next robbery.
🏆 We steal from the market, not from people.
See you at the vault door, Thief OGs. 🏴☠️💰🚀

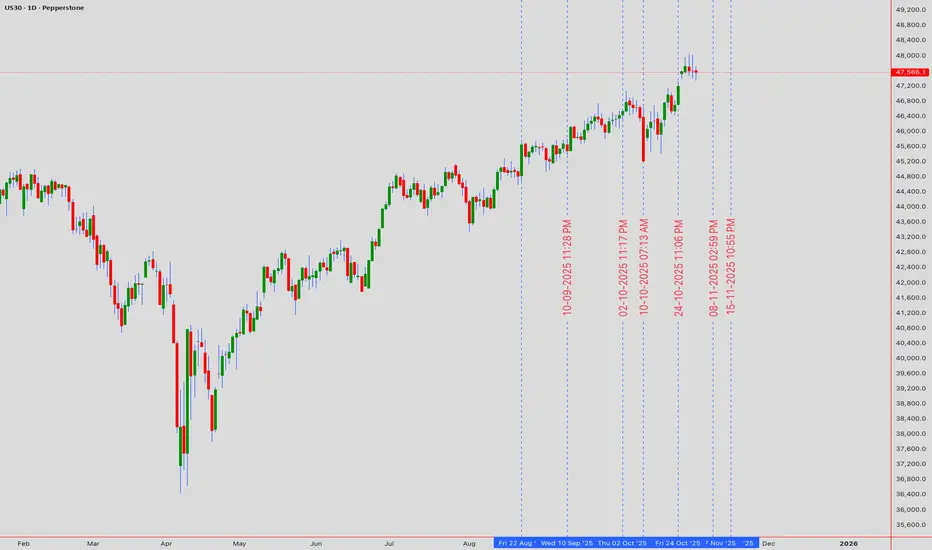
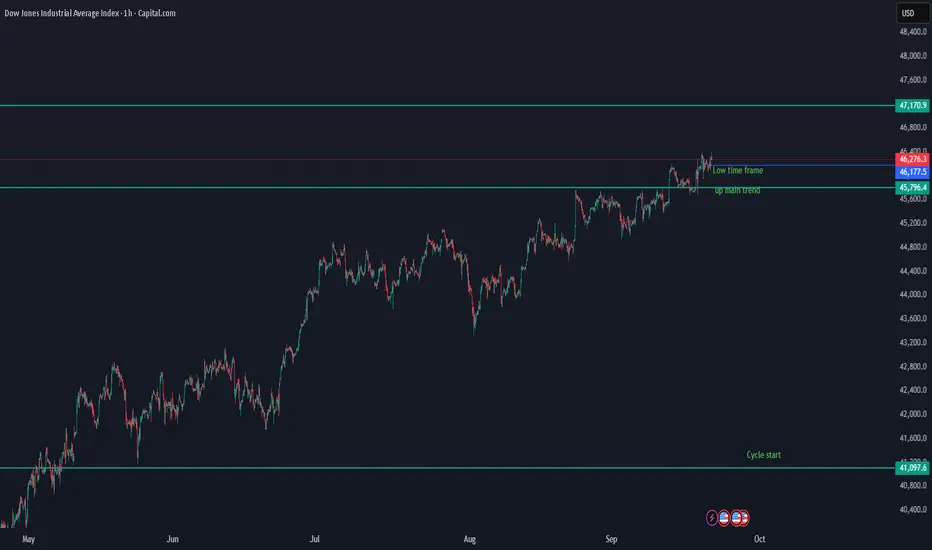
Key Levels & Trend Confirmation – US30US30 Update
We use advanced data that counts the start of the cycle and all important key levels.
On the low time frame, US30 is holding above the breakout zone (46,177 – 46,214), showing early signs of continuation.
Key levels:
46,214 → first support on the low time frame. Holding this level keeps bullish momentum intact.
46,177 → important confirmation level for the main uptrend. If US30 closes below this, it could trigger a deeper pullback.
As long as price holds above these zones, US30 remains in a bullish structure with potential to push higher.
Downside risk: A breakdown below 46,177 would invalidate the current momentum and open space for correction toward 45,796 support.
Major cycle level: 41,097 remains the cycle start and must-hold support in the bigger picture. Losing this level would shift the cycle to red.
📌 Summary
Above 46,214 – 46,177 → bullish continuation remains in play.
Break below 46,177 → correction risk, watch 45,796 as next support.
Cycle start at 41,097 → key long-term level to keep the broader bullish cycle alive.
US30 – Record Highs as Fed Cut and Nvidia Deal Fuel MomentumUS30 – OVERVIEW
U.S. stocks hit fresh record highs on Thursday, supported by the Federal Reserve’s first rate cut of 2025, a drop in jobless claims, and news that Nvidia will invest $5 billion in Intel, boosting sentiment across the tech sector. The upcoming New York session is expected to drive additional volatility.
Technical Analysis
The Dow remains in a sensitive zone near key pivots.
🔹 As long as price trades below 46,250, bearish volatility could emerge, targeting 46,120 and, if broken, 46,000.
🔹 A decisive break above 46,300 would confirm bullish continuation toward 46,400 and 46,520.
Key Levels
Pivot Zone: 46,250 – 46,300
Resistance: 46,400 – 46,520
Support: 46,140 – 46,110 – 46,000
A clean move outside the 46,250–46,300 range will set the next direction, with the U.S. session likely to provide the catalyst for a breakout.

DOW JONES HIGH PROBABILITY SETUPS SOON!!!🚨 US30 HIGH PROBABILITY SETUPS 🚨
* Here We Can See Clearly The Next Potential Moves For US30 Coming Hours/Days.
* Keep Your Eyes Close On Your Trading Positions.
* Happy PIP Hunting Traders.
FXKILLA.

US30 Bullish Setup: From Pullback to Measured Moves📊 The US30 (Dow Jones) is trending bullish on the 4-hour chart ⏰. We’ve just seen a pullback into equilibrium ⚖️, and I’ve taken a long position 📈. In the video 🎥, I break down how I set my targets 🎯 using the Fibonacci retracement 🔢 — first identifying the equilibrium pullback, then projecting measured moves above for profit targets 🚀. (Not financial advice ⚠️)

DOW JONES HIGH PROBABILITY SETUPS SOON!!🚨 US30 HIGH PROBABILITY SELL/BUY SETUPS 🚨
*Here We Can See Clearly The Next Potential Moves For US30 Coming Hours/Days.
* Keep Your Eyes Close On Your Trading Positions.
* Happy PIP Hunting Traders.
£ FXKILLA £