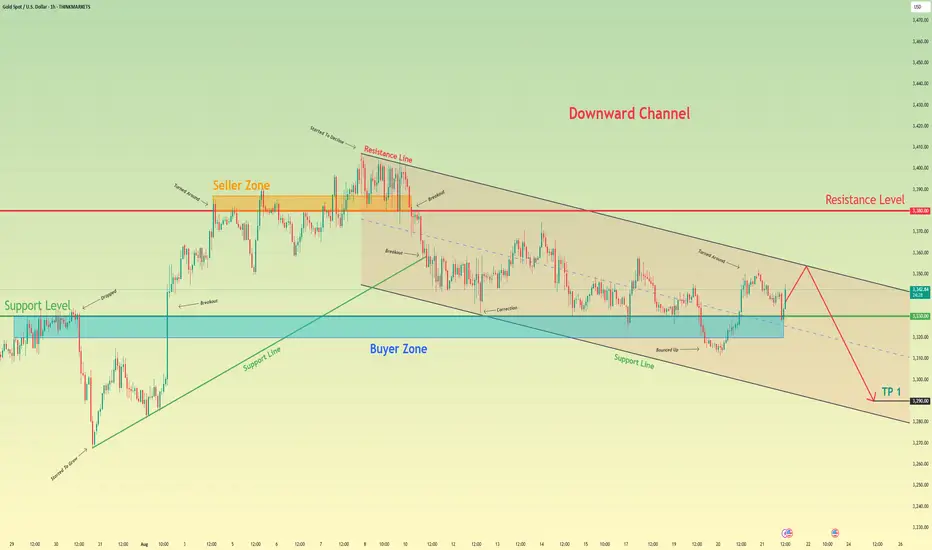
Gold can continue to decline inside downward channelHello traders, I want share with you my opinion about Gold. The price action for Gold has been dictated by a large downward channel since the last major peak was established at the 3380 resistance level. This bearish structure has effectively contained the market, guiding it through a series of impulsive declines and corrective rebounds between its well-defined support and resistance lines. After the most recent upward rebound originated from the lower boundary of the channel, the price has been in a corrective rally, now approaching a formidable confluence of resistance. This critical area is formed by the intersection of the channel's descending resistance line and the major horizontal seller zone around 3380. The primary working hypothesis is a short scenario, which is based on the expectation that this powerful resistance will hold and cause the current corrective rally to fail. A confirmed rejection from this zone would validate the integrity of the downward channel and signal that the dominant bearish trend is set to resume. This would likely trigger the next major impulsive fall, which is expected to break through the immediate support level at 3330. Therefore, the TP for this continuation scenario is logically placed at the 3290 level, a target that represents a new lower low within the channel's structure and a prudent objective for the anticipated move. Please share this idea with your friends and click Boost 🚀
Disclaimer: As part of ThinkMarkets’ Influencer Program, I am sponsored to share and publish their charts in my analysis.
Downtrend
Xauusd downtrendXAUUSD is currently trading around 3328. The market structure shows bearish momentum with sellers still in control. If this pressure continues, I expect price to push further down toward the 3288 level, which may act as the next support zone. Traders should watch for confirmation signals before entering, as volatility around key levels is likely.

EUR/USD - Bears Continue to DominateHello everyone, do you think FX:EURUSD will rise or continue to fall?
The EUR/USD pair continues to face short-term selling pressure today, with the price recently forming significant resistance levels. At the time of writing, the pair is trading around 1.164.
This movement is largely driven by a combination of technical factors and market sentiment, especially concerns about the global economy, including inflation fears and rising U.S. Treasury yields. These factors have added further downward pressure on the EUR/USD pair.
As seen in the chart, the price is struggling to break the resistance but has been unsuccessful so far. The trendline remains intact, and the bearish momentum may continue. As long as the trendline is protected by the bears, the downward targets will accelerate, with the 1.160 level in sight.
What do you think? Will EUR/USD reverse, or will it continue heading towards the next support target? Let me know your thoughts!

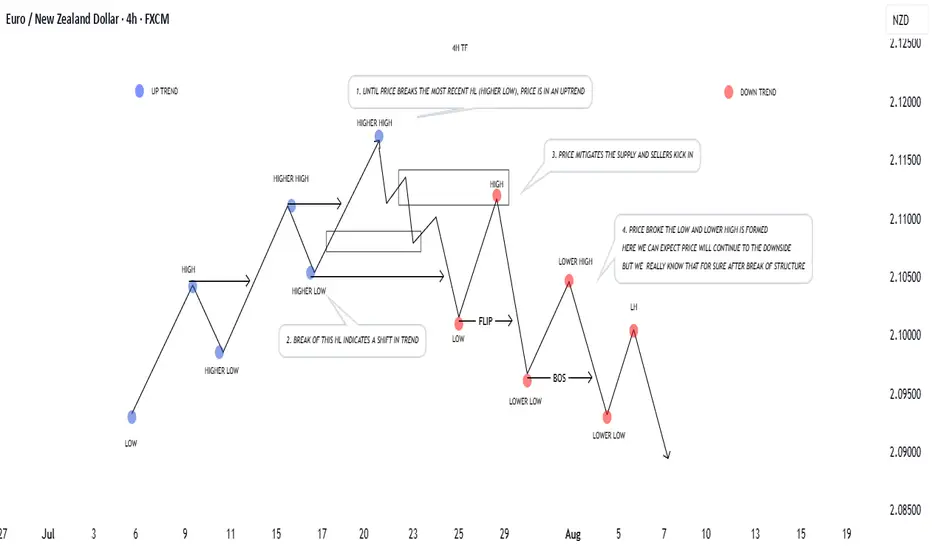
How to Identify Market Structure: From Uptrend to DowntrendUnderstanding market structure is key to trading well.
📈 In an uptrend, price forms a sequence of Higher Highs (HH) and Higher Lows (HL). As long as the most recent HL is respected, buyers remain in control. Pullbacks into demand often provide continuation opportunities.
📉 Once the most recent HL is broken, structure shifts — buyers lose control, and the market can flip into a downtrend with Lower Highs (LH) and Lower Lows (LL). Pullbacks into supply confirm bearish momentum.
🔑 Remember:
Market structure is fractal — always check higher timeframes for better understanding of price action.
A break of any important structure ( lows, highs ) tells us that either price is continuing or reversing.
Supply and demand zones are where reversals usually begin. And that is due to volatility and orders, volume coming into the market.
Don’t fight momentum — align with structure, and let the market confirm direction before you do anything.
Keep this framework in mind, and reading trends will become much clearer.
Blessings, T
Gold Declines Until the End of the SessionHello everyone, what do you think about the trend of OANDA:XAUUSD ?
Gold continues its downward trend into the close of the session, currently settling at 3,335 USD and moving near the final support zone . The precious metal remains under pressure as the US Producer Price Index (PPI) rose by 0.9% in July.
From a technical perspective, the recent news continues to act as a barrier for XAUUSD, with the price moving below both the EMA 34 and EMA 89 and being limited by the trendline.
The price wedge is pushing gold down towards lower price zones, and as mentioned, gold is now testing the final support level (in the short term). If this level continues to break, the next target for sellers could be the round level of 3,300 USD.
What do you think about the trend of XAUUSD? Leave your thoughts in the comments!

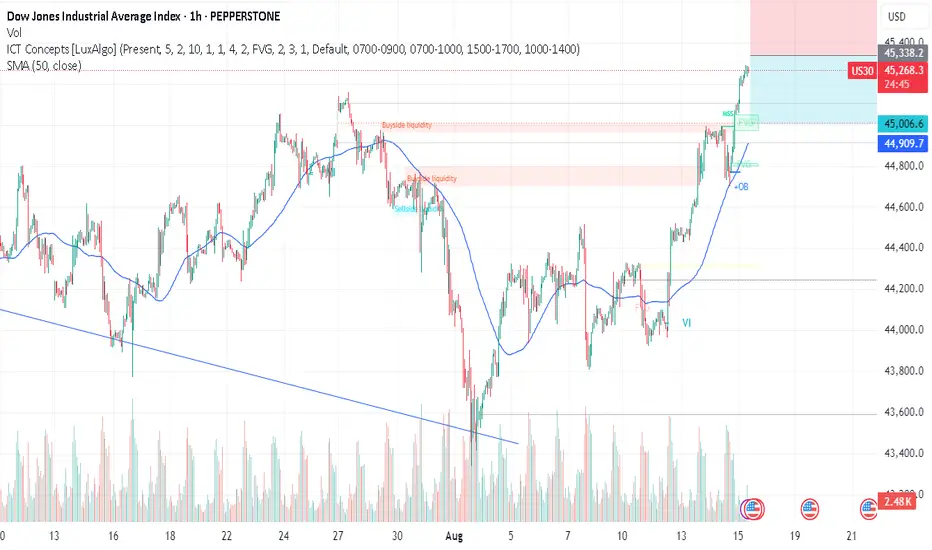
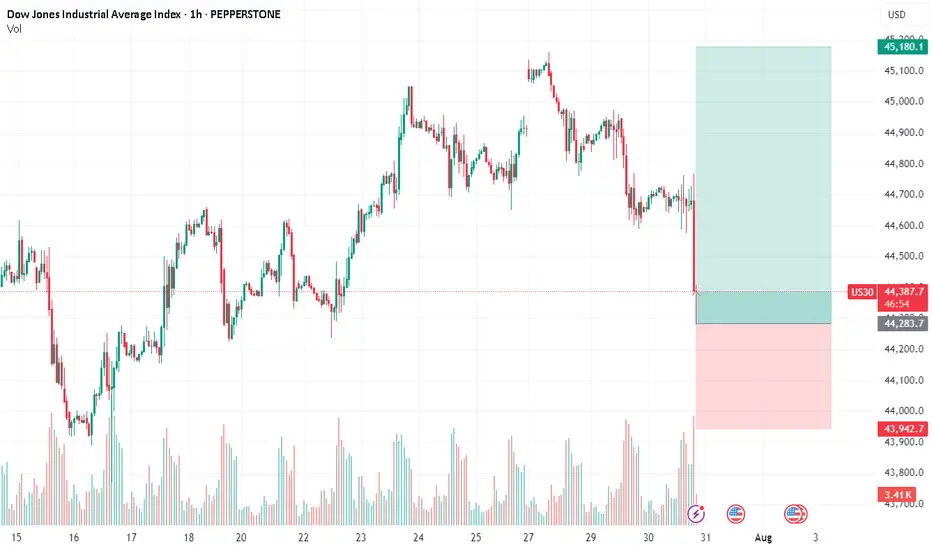
DOW - TRUMP MEETING WITH PUTIN - Team,
Today we got LONG GOLD, SHORT UK100, SHORT AUS200, all target meet at our chat room
Here is the set up trade for US30
Entry: 45,272–45,300
Stop: 45,340–45,360
TP1: 45,080
TP2: 44,880
LETS GO
Bearish trend for GoldAre you ready for bearish trend of Gold?
After touching upper line of channel, Gold is ready for starting bearish trend.

ETHUSDT 4H Chart Review🔍 General Technical Context:
Prior Trend: Upward (strong rally from around 3,150 USDT).
Current Structure: After breaking out of the ascending channel, there was a strong decline, but is currently rebounding upward – it looks like a test of prior support as resistance.
📈 Key Horizontal Levels (Support/Resistance):
Resistance:
3,794 USDT – strong resistance resulting from the prior high (green line).
3,943 USDT – high of the ascending channel.
Support:
3,504 USDT – prior support, now potentially acting as resistance (red line).
3,383 USDT – July support.
3,132 USDT – strong base support, potential correction low.
📉 Technical Patterns:
Broken Upward Channel (orange lines): A clear downward breakout suggests a weakening of the previous trend.
Downward Trendline (purple): The current price is approaching it – a test and reaction (bounce or breakout) may occur.
📊 Stochastic RSI (oscillator at the bottom):
The indicator is entering the overbought zone (>80).
This may indicate an impending slowdown or correction, especially if the price encounters resistance at the purple downward trendline.
🔮 Scenarios:
✅ Bullish (if the breakout is upward):
A breakout of the purple trendline and resistance at 3,794 USDT could signal further gains towards 3,943 USDT or higher.
Confirmation could come from a retest of the purple line as support.
❌ Bearish (if resistance rejected):
Rejection from the trendline or the 3,794 USDT zone = possible correction to 3,504 or 3,383 USDT.
Break of 3,383 = potential decline to the 3,132–3,150 USDT zone.
🧭 Conclusion:
The market has regained strength from the local low but is at a potentially strong resistance zone.
Stochastic RSI overbought + near resistance = high risk of a near-term correction.
The key will be price performance within the purple trendline and 3,794 USDT.

Bullish Divergence appearing!2222 - Closed at 24 (03-08-2025)
Currently in Downtrend.
However, Bullish Divergence has
started appearing on Bigger tf.
Bearish ABCD pattern target seems to
be around 22 - 23 & it may reverse from
that point. But Confirmation will be
required before taking position. Otherwise,
Next possible Support level can be around 20 - 20.50.
Immediate Resistance seems to be around 25 - 26.
It needs to cross & sustain 29 to start its Uptrend.

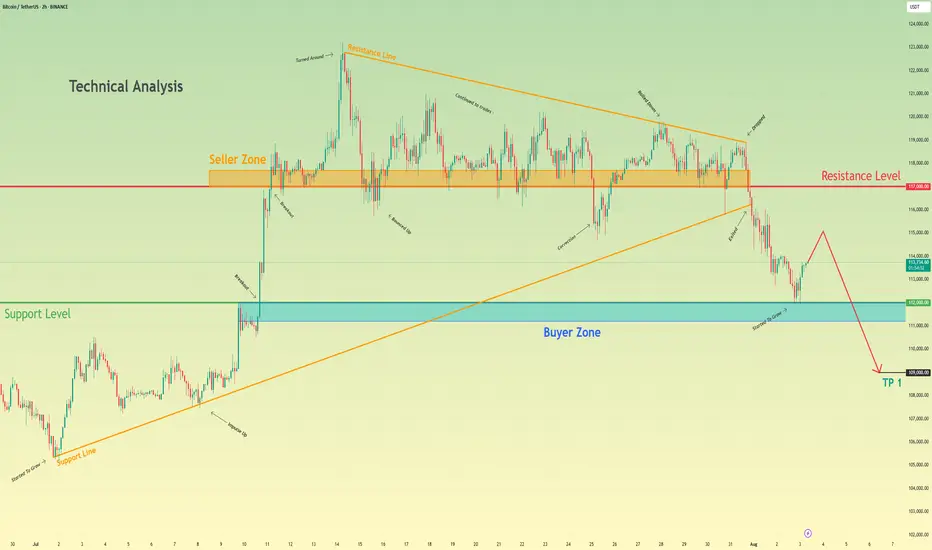
Bitcoin can continue to decline and break support levelHello traders, I want share with you my opinion about Bitcoin. Following an earlier upward trend, bitcoin entered a prolonged phase of consolidation, forming a large upward pennant where price action was tightly contested between the seller zone near 117000 and an ascending support line. This period of balance, however, has recently resolved to the downside with a significant change in market structure. A decisive breakdown has occurred, with the price breaking below the pennant's long-standing support line, signaling that sellers have ultimately gained control. Currently, after the initial drop, the asset is undergoing a minor upward correction, which appears to be a classic retest of the broken structure from below. The primary working hypothesis is a brief scenario that anticipates this corrective rally will fail upon encountering resistance from the broken trendline. A confirmed rejection from this area would validate the bearish breakdown and likely initiate the next major impulsive leg downwards. The first objective for this move is the buyer zone around the 112000 support level, but given the significance of the pattern breakdown, a continuation of the fall is expected. Therefore, the ultimate target price for this scenario is placed at the 109,000 level, representing a logical measured move target following the resolution of the large consolidation pattern. Please share this idea with your friends and click Boost 🚀
Disclaimer: As part of ThinkMarkets’ Influencer Program, I am sponsored to share and publish their charts in my analysis.
DOW/US30 - PATIENCE IS THE KEYTeam, i expect the DOW/ NAS will be selling off due RATE unchange
i am going LONG now at 44335-44300 ranges
STOP LOSS at 44195
Target 1 at 44500-44550
Target 2 at 44600-44630
LETS GO
By the way, if you trade AUS200 today, both target hit on SHORT.
USDNOK short potential setupUSDNOK recently broke down below the monthly 50ema (overlayed on this 4h chart) and has rejected off the daily 20ema (overlayed) twice this week. RSI is showing bearish momentum after a brief overbought period while the PA has remained in a strong downtrend. Short setup potential is evident but not certain.
I'm a cat not a financial advisor.

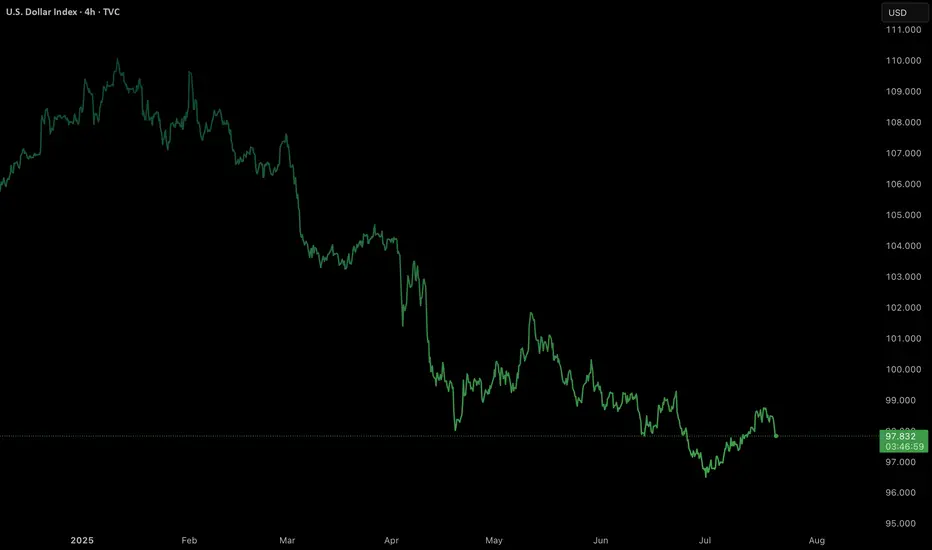
U.S. Dollar (DXY) bearish?Will dollar continue its bearish momentum or will it reverse?
Technical Summary
DXY remains in a firm bearish trend, having dropped around 11% this year. The setup is formed by a chain of lower highs and lower lows, confirming an unrelenting downtrend.
Support Level: ~97.70
Resistance Zone: 98.55–98.80
Long-Term Outlook: Bearish, unless a clear break and close over the resistance zone on the daily or weekly timeframe.
Technically, the momentum indicators remain weak, and the failure to sustain rallies above the 99.00 level also contributes to downward pressure further. The market is now consolidating within a narrow range after steep selling, which suggests probable continuation if macro catalysts are favourable.
Fundamental and Sentiment Drivers
Several macroeconomic and geopolitical drivers are underpinning the weakening of the U.S. dollar:
Federal Reserve Uncertainty:
Speculation over the ultimate fate of Federal Reserve Chairman Jerome Powell under political pressure from the executive branch has severely undermined investor confidence in the central bank’s independence. This has been manifested in increased volatility and bearish pressure on the dollar.
Trade Policy and Tariff Risks:
Ongoing trade tensions, including the possibility of sweeping tariffs (15–20%) on Chinese and European Union goods, have created a risk premium on valuations of the U.S. dollar. Market players still fear retaliation and its effects on trade stability in the world.
Fiscal Position and Credit Ratings:
The US fiscal deficit, which is approaching 7% of GDP, and recent credit rating downgrades to its outlook, have set alarms ringing regarding the structure. These fiscal developments have eroded the popularity of the US dollar as a safe-haven asset, particularly with foreign investors.
Global Monetary Landscape:
With European Central Bank and Bank of Japan maintaining policy guidance tight, and Federal Reserve already indicating that direction for a rate cut in Q4 2025 is being eyed, the falling rate differentials still maintain pressure on the dollar.
Market Outlook: Week of July 21–25, 2025
Major Geopolitical and Economic Events:
DATE : Ongoing
EVENT : U.S.- EU & U.S. — China Trade Negotiations.
MARKET RELEVANCE : High
Resolution or escalation will directly impact USD demand.
DATE : Mid-week
EVENT : Federal Reserve Speeches (including Powell)
MARKET RELEVANCE : High
Monetary policy guidance and institutional stability.
DATE : July 24–25
EVENT : Jobless Claims, Flash PMIs, New Home Sales, Durable Goods Orders
MARKET RELEVANCE : Medium–High
Labour market data, housing data, and production activity have the potential to shift rate expectations and dollar sentiment ahead of the FOMC and PCE releases.
Strategic Implications
Outlook: DXY remains structurally bearish in the short to medium term. Additional weakness below 98.80 and sustained closes below 97.70 would reassert downward momentum, risking a further retracement to the 96.00-95.50 region.
Possible Bullish Reversal Triggers:
A conclusive resolution to U.S. trade negotiations.
Unexpectedly solid economic data (particularly core inflation or employment).
Hawkish Fed commentary supporting policy tightening expectations.
Last thoughts
The U.S. Dollar Index is currently at structurally weak technical and fundamental foundations. Absent a sudden reversal of the monetary policy message or geopolitical resolution, the path of least resistance appears to remain to the lower side. Market participants need to pay special attention to upcoming economic data releases, central bank rhetoric, and trading news because any one of them could be a pivotal driver of near-term dollar behavior.
GBPUSD Week 30 Swing Zone/LevelsPEPPERSTONE:GBPUSD is expected to trend upward from the 1.34032 level towards the resistance zone. Whether it breaks through or reverses downward will ultimately depend on market players.
This projection is based on a forward-looking metric analysis, which explains why the zones are not derived from historical price action on the left side of the chart, as is common in traditional technical analysis. However, the daily candles from previous weeks still contribute meaningfully to this outlook.

RCI, Bear Flag On The Daily As Well As The 4hr Analyzing both the daily and 4-hour charts reveals a very prominent bear flag, which has formed following a steep decline. This pattern is often indicative of further downward movement, and it's hard to ignore the implications.
Word on the street is that they're currently in dire straits. Since the Shaw acquisition, they've hemorrhaged 11 billion in valuation. The situation is exacerbated by declining revenues and missed growth targets. In short, it's not looking promising.
If the trend continues downward, we might see the price testing the $19 USD mark sooner rather than later.
For those who are currently long on this or have any vested interest, it might be prudent to reconsider your position and cut your losses before it's too late.

XAUUSD Long Trendline is broken. Mid Term Swing TradeXAUUSD, Long term trendline is now broken. Price should come up to that level to continue it's downward move.
* It's entirely my prediction with some logical reason but I will request everyone to see this as a reference, Thank you

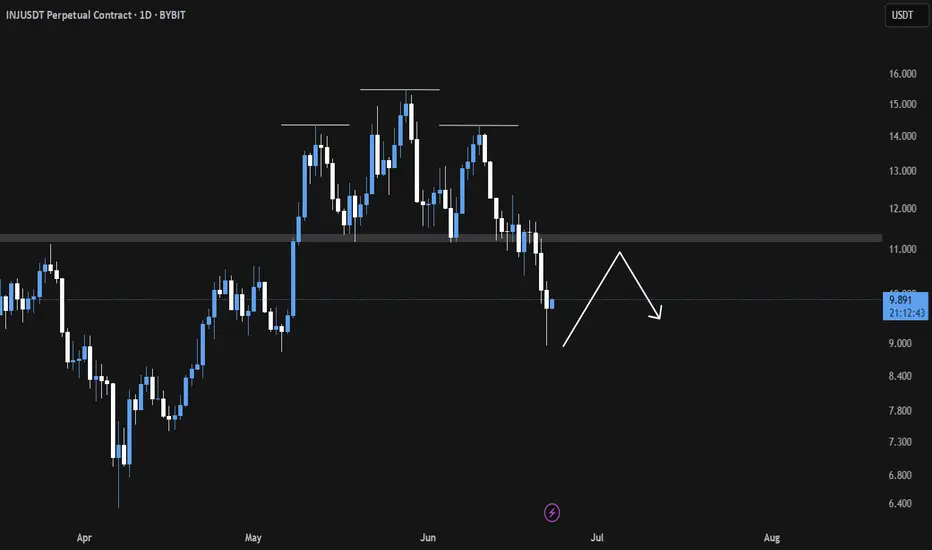
INJ Breakdown in Play Eyeing the Neckline for Precision ShortsINJ/USDT Analysis
〽️ The Head and Shoulders pattern has broken down successfully, confirming a bearish structure.
💠We anticipate a potential relief bounce towards the $11 region which aligns closely with the neckline retest zone. This area is likely to act as a liquidity trap, where institutional sellers may re-enter aggressively 👀.
🎯 Key downside targets remain at
1. $8.98
2. $8.03
3. $6.92
Strategic Plan 🎖️
Look to initiate short positions around the neckline retest near $11, as the risk-reward becomes increasingly favorable from that level.
Trade with discipline. Let the structure lead the execution. 🫡🧠
DOW30/US30 - ACTIVE TRADE - PROFITABLE SET UP TRADETeam,
today I have provide LIVE trading today provide you i did a good trade for
NAS100, DOW30 AND DAX30 - in real LIVE trading
OK, I prefer to SET UP my limit order today only. Remember, the market will be very volatile in the next 4 hours.
I expect the RATE should cut 25 points at least. Why
the employment data come out remain the same
inflation last week look under control
Retails is poorly come out today
The FED does not care about the America, they just care about taking advantage of America.
Lets now focus on the SETTING BUY LIMIT ORDER
I order small volume at 41975-42075
However I will double up at LIMIT BUY ORDER
The 1st target are looking at 4227542300
Target 2 - 42575-42675
REMEMBER - IF IT DOES NOT HIT YOUR ENTRY, JUST WALK AWAY.

The Fundamental Truths About a Trending MarketBefore you can trade successfully, you must first understand what defines a market trend.
🔼 What is an Uptrend?
An uptrend is characterised by a series of Higher Highs (HH) and Higher Lows (HL). This signals that buyers are in control and price is climbing steadily.
🔽 What is a Downtrend?
A downtrend is identified by a series of Lower Lows (LL) and Lower Highs (LH). This indicates that sellers are dominant and price is consistently falling.
📌 Important Facts About a Trending Market
Trends don’t change easily. Once a trend is established, it tends to persist.
A trend reversal takes time and effort. It doesn't happen abruptly — the market needs a strong reason to change direction.
There are always warning signs. Before a trend changes, there’s usually a pattern or shift in behaviour that acts as a clue.
The bigger the trend, the longer it takes to reverse. A well-established trend will require more time and evidence before it breaks.
🎯 Keys to Trading Any Market Successfully
Identify the market condition.
Is the market trending upwards, downwards, or moving sideways (consolidating)?
Study price behaviour at key levels.
Understand how price reacts at significant highs and lows.
Learn the anatomy of price waves.
Recognise wave structure — how price expands and contracts in trends.
Align your trades with the market condition.
Your entry and exit strategies should fit the current phase of the market.
🔚 Summary
Mastering trends is one of the most important skills in trading. When you understand what defines an uptrend or downtrend, recognise when a trend may be ending, and align your strategy with the market condition, you set yourself up for consistent success. Patience, observation, and timing are key — because the market always leaves clues, but only for those who are prepared to see them.

BTCUSD 1DI invite you to look at the current situation example, where you can see a lower high formation that has been formed, which could potentially lead to a larger price correction and the formation of a lower low in one of the 3 potentially designated locations.

USD-CHF Bearish Bias! Sell!
Hello,Traders!
USD-CHF is trading in a
Downtrend and the pair
Is making a local bullish
Pullback but will soon
Hit a horizontal resistance
Level around 0.8185
So we are bearish biased
And we will be expecting
A further bearish move down
Sell!
Comment and subscribe to help us grow!
Check out other forecasts below too!
Disclosure: I am part of Trade Nation's Influencer program and receive a monthly fee for using their TradingView charts in my analysis.

PolkaDot (DOT) Structure Analysis (1D)BITGET:DOTUSDT is showing signs of strength after a deviation below the long-standing $3.70–$4.10 demand zone.
Key Levels
• 🟢 Demand Zone: $3.70–$4.10, respected since October 2023
• 🟡 Broken downtrend resistance, retested as support
• ⚪ Current falling channel (compression) following range high retest
• 🟥 Sell Order Block: $5.10–$5.40
• 🟧 Range Resistance: $5.40
• 🎯 Target on breakout: ~$7.00, potential extension to ~$7.50
Thesis
• The recent breakdown was quickly reclaimed, hinting at a possible spring/fakeout. After retesting the range high, price is now compressing within a descending channel, building energy just above demand.
• A breakout from the channel followed by an S/R flip of the $4.40–$4.60 region could trigger a rally toward the upper range.
Watching for
• Channel breakout with volume
• Clean break above $5.40 to confirm range expansion
Invalidation
• Sustained break below the $3.70–$4.10 demand zone

Celestia (TIA) – Ascending Triangle Setup (4H)BINANCE:TIAUSDT is printing a clean ascending triangle on the 4H chart, signalling a potential reversal.
Key Levels
• Support: Ascending trendline
• Resistance: $2.30 – a key level that acted as support since early April
• Measured Target: $2.50–$2.55 – aligns with prior support area
• Watch out for the longer-term descending trendline, which could act as resistance on breakout around ~$2.40
Breakout Trigger
A solid 4H close above $2.30 with convincing volume could confirm the move
Invalidation
A sustained break below the ascending support would fully invalidate the setup and potentially lead to a drop to $1.70
