a possible trade on the eur/usddue to multiple break of lows happening on the euro/usd its indicating a strong bearish momentum
i will be waiting for a pull back to the supply zone for me to take advantage of another run to the downside
Downtrend

US 30 FALLThe analysis suggests a potential selling opportunity for US 30 (Dow Jones Industrial Average) on the daily and 4-hour timeframes.
On the daily timeframe, a selling entry zone is identified between 39,800 to 39,950 points. This range represents a level where significant selling interest has historically emerged, potentially acting as a resistance zone for the index. Traders often look for such areas to initiate short positions, anticipating a downward movement in price from these levels.
Additionally, on the 4-hour timeframe, a fresh selling zone is noted between 39,590 to 39,650 points. This zone represents a recent area where selling pressure has been observed, indicating potential renewed bearish momentum for US 30.
The trading strategy includes setting a target of 130 pips, representing the expected downside movement in US 30 from the identified selling zones. This target suggests the anticipated decrease in price from the entry zones to the desired profit level.
Furthermore, two target prices are set to manage the trade effectively. Setting multiple targets allows traders to lock in profits at different levels and adjust their positions accordingly as the trade progresses.
In summary, the analysis indicates a potential selling opportunity in US 30, with selling entry zones identified on both the daily and 4-hour timeframes. Traders may consider entering short positions with the expectation of a 130-pip downside movement, aiming to capitalize on the potential price decline from the identified selling zones.

Downtrend Reversal? Buy the Dip!NASDAQ:AAPL
As you know the justice department has issued an Antitrust suit against Apple. This news is going to cause a downtrend in the stock, as expected, because of reaction to the news. However, we can expect a reversal sooner than later.
Apple is at $172.28 as of 03/22/24
Buy until $168.52
Price target(s): $174.27, $178.79
(expectation of a downtrend if the price retraces from this high, it could encounter resistance because traders may be ready with sell orders here)

✅TESLA WILL KEEP FALLING|SHORT🔥
✅TESLA is trading in a
Strong downtrend and the
Price retested the local horizontal
Resistance around 180$ and we
Are seeing a bearish reaction
Already so I am bearish biased
And I will be expecting
A further bearish continuation
SHORT🔥
✅Like and subscribe to never miss a new idea!✅

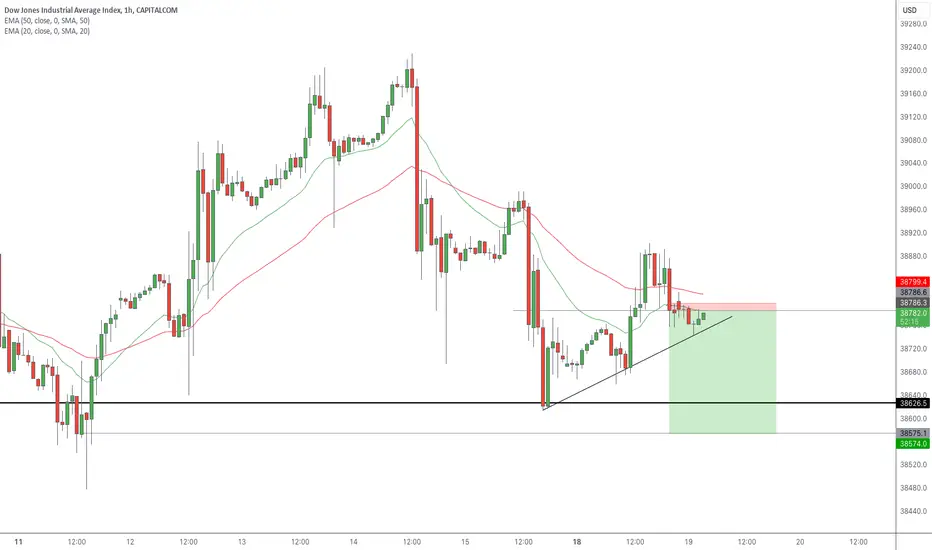
US30 NEW TARGET 38580BEAR FORMATION: if this formation holds, i am expecting a IBO on US30
A retest might be inbound but risk is tight.
Watching this pair at this hour only mean I am hungry.
Is there anyone else hungry to eat some pips today?
Trading with a trend: basics and strategyIn this video I explain how to indentify trends on the chart and how to use this knowledge to make trading decisions. At the end of the video we'll create a simple yet profitable trading strategy
Waves Light indicator:
Disclaimer
I don't give trading or investing advices, just sharing my thoughts

Crypto Heat Check: Anticipating a Cooling Off in the MarketThe crypto market's temperature seems to be rising, indicating a potential need for a healthy relief bounce. While the altseason may not have concluded, it's prudent to brace ourselves for a corrective move downward.
Taking a closer look at the SUIUSDT example, we can witness the market's respect for the supply area. Particularly noteworthy is today's occurrence—a clean bounce off the 61.8% Fibonacci resistance level, signaling a palpable downward pressure. This could potentially translate into a 15-20% price drop.
Don't get overexcited and be ready for any scenarios!

Dow Jones is going to fall ?? Dow Jones is Working this Rising Channel
Currently Index may touch 41000 on days to come but
As history shows after every rise of 20% DJIA gives the fall of 6-7%
We are little bearish on Stock markets
Well well well !!
If USA market goes down then can we expect overall world market to fall ??
Lets see !!
Thanks !!

ETH, Where to Buy the Dip ? ETH is most likely correcting 5 years up going wave ! is the correction over? Most probably NOT.
ETH at ATH more than likely completed an impulsive section of a wave cycle and currently is in the corrective section.
Normally in simple form, corrections have 3 legs with two legs down and one leg up in between. As shown on the chart , it is very possible for ETH to be in the third leg of the ABC form of correction (C) after completion of first two legs (A and B).
ETH got hammered at 50 % Retracement of down going wave A which is acceptable and also typical for a zigzag correction. If we skip some unusual types of zigzag correction, ETH should normally make a new low at lower Retracement levels shown on the chart. So, Our " Buy the Dip " targets will be 1863 and 1046 USD corresponding 0.618 and 0.786 Retracements of 5 years up going wave respectively.
After end of correction, if we are going to have a normal ascending wave cycle , there will be a shining chance to invest on ETH. It may see some unbelievable targets above 10000 USD !
I have to emphasize what has been discussed is the most probable scenario . We know that waves, especially in corrective phase, can take many complicated forms. Should it need any update, we will provide in appropriate time.
Hope this to be useful and wish you all the best.

AUD-NZD Will Keep Falling! Sell!
Hello,Traders!
AUD-NZD is trading in a
Downtrend and the pair
Made a retest of the
Horizontal resistance
Level of 1.0601 and went
Down again which reinforces
Our bearish bias and
We will be expecting
A further bearish continuation
Sell!
Like, comment and subscribe to help us grow!
Check out other forecasts below too!

AUD-NZD Will Go Down! Sell!
Hello,Traders!
AUD-NZD is trading in a
Downtrend and the pair
Broke the key horizontal
Level of 1.0590 and the
Breakout is confirmed
So I think that we will
See a bearish continuation
Sell!
Like, comment and subscribe to help us grow!
Check out other forecasts below too!

AUD-NZD Bearish Bias! Sell!
Hello,Traders!
AUD-NZD keeps going down
After the pair broke the
Key horizontal level
Of 1.0640 which reinforces
Our bearish bias
And we think that the
Pair will go further down
Sell!
Like, comment and subscribe to help us grow!
Check out other forecasts below too!

USDT.D Wyckoff Pattern Don't be bullish on market
Usdt dominance show everything
stay relax on buy BTC and all CRYPTO assets in lowest price
Bitcoin lower than 14000$
ETH lower than 800$

EURUSD, SHORT TERM SELL I believe in a short term sell for EURUSD, possible uptrend after it hits TP of 1.07180 or it may continue to go down.
Entry: 1.0760
SL: 1.0765
TP: 1.07180

EURUSD GOING DOWN!?!???I believe EURUSD will continue down, not breaking the 1.08100 level
SL: 1.08090
TP: 1.06130

⤵️⤵️ ( Gold bearish momentum technical analysis) Technical analysis🟢
Hello traders what do you think about Gold
Traders are you looking 👀 gold this week moving down
2000+ 1990+ 1980 gold friday cpi News update selling zoon 2057 big down 👇 2027) this week same retest 2030 2040)
Fullback down 👇🟢
DXY INDEX ☝️ 105 .00 🟢

EUR-USD Bearish Flag Pattern! Sell!
Hello,Traders!
EUR-USD is trading in a
Downtrend and the pair
Has formed a bearish
Flag pattern so IF we
See a bearish breakout
Then we will be expecting a
Further move down
Sell!
Like, comment and subscribe to help us grow!
Check out other forecasts below too!

NIO - more downside soon? Target 5.50I am following NIO with one eye, now switching to two eye. Even though NIO could have a bright future for the long run (years), I see more downside incoming.
The formed head and shoulder within the symmetrical triangle broke to the downside (breaking also the triangle), and as expected retested the HOS neckline (and the triangle). As expected, it got rejected, also bumping into the 200 SMA (4hr)with a huge rejection, confirming it is still in a strong bear-trend now. We are also way below on the 200day SMA, and also the 200week SMA.
On the weekly, we are loosing momentum, but some upside is expected on the short-term.
I assume (but price actions will tell), this short term uptrend will help to finish the smaller formation on the new Head and Shoulders, which I highlighted with paintbrush in white.
Currently, we are in the consolidation zone, chances are, we are going up a bit to create the top of the right sholder with the target of 9.40-9.60, then going back down to the consolidation zone.
Also, there is a possibility we have a very shallow right shoulder almost formed already, going down directly, I will wait for confirmation.
We are also below the 9day&15 day MA, and also below the 21day EMA. All theese will possibly be huge resistance.
Very short-term : uptrend target - ~9.40
Short-term: downtrend target: ~8.80
Low Mid-term: downtrend target: ~8.00-7.70
High Mid-term: downtrend target: ~7.10
Long-term: downtrend target: ~5.50

NZD-USD Bearish Breakout! Sell!
Hello,Traders!
NZD-USD made a bearish
Breakout of the key horizontal
Level of 0.6075 and the breakout
Is confirmed so I think that
We will see a further move down
Sell!
Like, comment and subscribe to help us grow!
Check out other forecasts below too!

FLRUSDT breaking on support levelFLRUSDT breaking on support level with good risk reward ratio for shorting...

NZD-CAD Will Go Down! Sell!
Hello,Traders!
NZD-CAD keeps going
Down and the pair broke
The key horizontal level
Of 0.8195 then made a
Pullback and retest and now
I think it will go further down
Sell!
Like, comment and subscribe to help us grow!
Check out other forecasts below too!

AUD-USD Broke The Support! Sell!
Hello,Traders!
AUD-USD is going down
Now and the pair broke
The key horizontal level
Of 0.6527 and the breakout
Is confirmed so I will be
Expecting a further move down
Sell!
Like, comment and subscribe to help us grow!
Check out other forecasts below too!

🔃🔃 ( GOLD first Long) and short) technical analysis 👍Hello traders 💯 what do think about Gold moving this week?
I think 💭 gold moving this week first Long 2030 + 2040 Breakdown fullback down 👇
2000+ 1980
Technical analysis 👍👇
TVC:DXY FXOPEN:XAUUSD
DXY INDEX FULLBACK Up this week 105.000 FXOPEN:XAUUSD TVC:DXY
Technical analysis 👍👇
Safe trade ❤ plaes like ❣️ and comments FXOPEN:XAUUSD TVC:DXY
