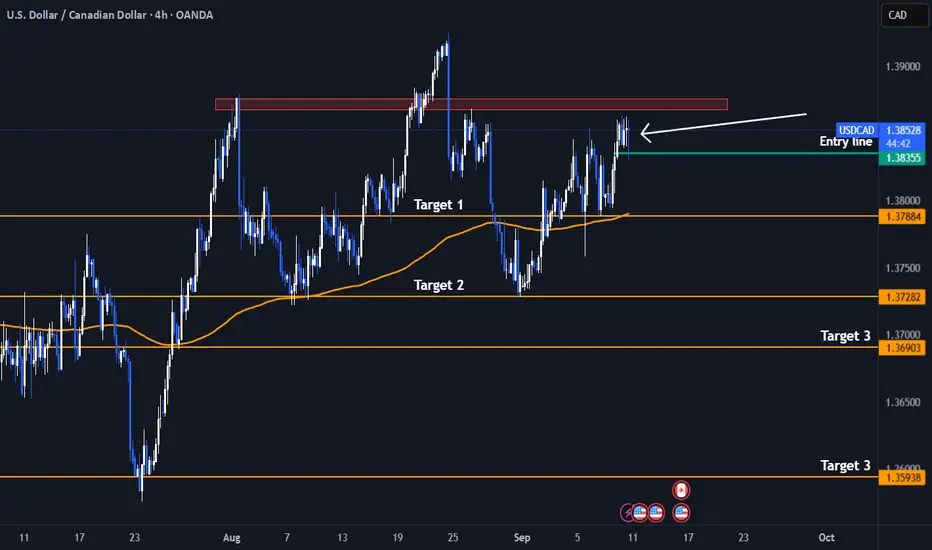
Short! Short! USDCAD - Double Head and Shoulder PatternI have identified a clear head and shoulders pattern forming within a larger head and shoulders structure on the daily timeframe for USD/CAD, indicating a potential bearish reversal.
From a fundamental perspective, several key factors are contributing to the current weakness in the Canadian dollar against the US dollar:
Canada's labor market showed significant weakness in August 2025, with a notable loss of 65.5 thousand jobs and a rise in unemployment to 7.1%, the highest in years. This has increased market expectations for monetary easing from the Bank of Canada (BoC).
Although core inflation remains above target, the weak jobs data is pushing the BoC towards potential rate cuts or a more accommodative policy stance, which weighs on the Canadian dollar.
The market is currently pricing in a very high chance (around 98%) of an additional rate cut by the BoC in September, following previous reductions to 2.75%. This dovish stance contrasts with the Federal Reserve’s more cautious or hawkish approach, creating a wider interest rate differential that supports US dollar strength.
Additionally, declining oil prices, a major export for Canada, are exerting further downward pressure on the CAD.
While recent US economic data has been mixed, the Fed is generally seen as less dovish than the BoC, sustaining demand for the USD.
Trade tensions and geopolitical risks between the US and Canada add to concerns over Canada’s growth outlook, contributing to CAD depreciation risk.
Trade Tip
A strong close below the Entry line will be a perfect entry /4hr TF
Stoploss : Above the Left Shoulder (Red Rectangle)
In summary, the combination of a weakening Canadian economy, dovish BoC bias, lower oil prices, and interest rate divergence between the US and Canada all support a bearish outlook for USD/CAD, which aligns well with the bearish head and shoulders pattern I have spotted on the chart.
Not an Investment Advise
Dump
EURUSD: Price Exit from Pennant and DropHello everyone, here is my breakdown of the current Euro setup.
Market Analysis
From a broader perspective, the price has been consolidating in a wide range between the 1.1600 support level and the 1.1720 resistance level. This extended period of balance has now tightened, leading to the current, more compressed pattern where a significant move is becoming more likely.
Currently, the price action is coiling within a pennant pattern. This compression of volatility suggests that energy is building for a breakout. The price is now trading very close to the apex of this pennant, testing the upper boundary near the major horizontal Resistance Zone.
My Scenario & Strategy
While a breakout from a pennant might seem likely, the overhead resistance at the 1.1720 level is historically significant. I'm watching for a situation where the market fakes a move to the upside to trap optimistic buyers before revealing its true intention.
Specifically, I'm watching for a brief dip, followed by a rally that pushes the price just above the pennant's resistance line and into the 1.1720 - 1.1730 resistance area. The key signal would be a swift and forceful rejection from this area, pushing the price back below the breakout point. And the primary target for the resulting decline is the 1.1600 level, which aligns with the major horizontal support zone.
That's the setup I'm tracking. Thank you for your attention, and always manage your risk.

BTC - Following Crash PlanBTC has been following my analysis of predicting a potential crash here.
We can use DXY to anticipate when a significant liquidity grab / flash crash will occur.
Since DXY is retesting a major breakdown on the weekly - monthly, it would be wise to watch for volatility today on Bitcoins price, noting these liquidity regions if we are about to enter a bull run ranging out 3-5 years.
Targets and potential corrective patterns marked on this chart.
Happy trading.

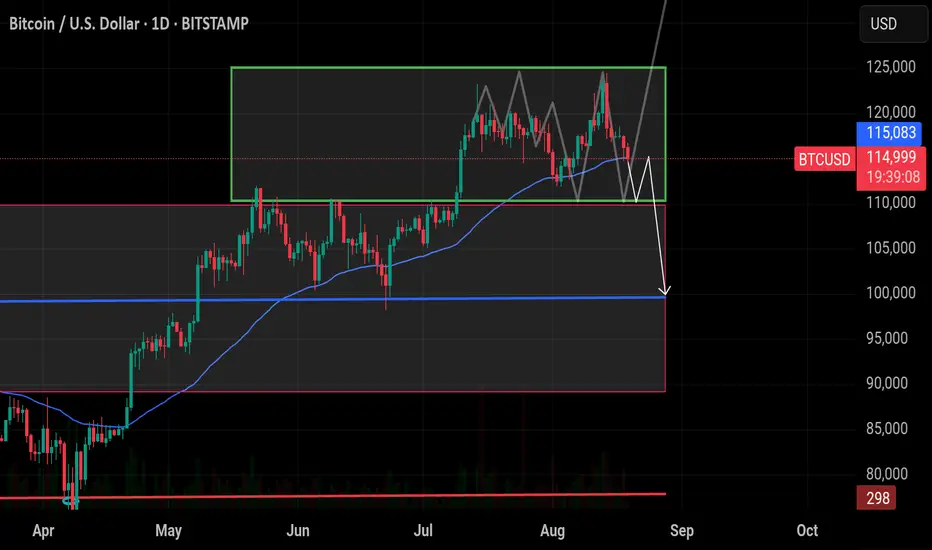
#Bitcoin Weakness Alert: $BTC is showing weakness as it struggle#Bitcoin Weakness Alert:
CRYPTOCAP:BTC is showing weakness as it struggles around the 115K (50 EMA) level.
🔸 Key Support:
If BTC loses the 115K support and resists below the 50 EMA, downside pressure increases. The next critical level is 110K.
🔸 Upside Target:
Holding above 115K with strength can trigger a move back toward 120K and possibly extend to 125K.
🔸 Risk Level :
A confirmed break below 110K will likely open the path for a dump toward 100K.🚨
🔸 Outlook:
Monitor 115K closely. If price holds above, upside continuation is possible. If broken, expect a deeper correction with 110K as the last major support before 100K.
#BTC #BTCUSD #BTCUSDT #BITCOIN #Analysis #Eddy#BTC #BTCUSD #BTCUSDT #BITCOIN #Analysis #Eddy
I have identified the important supply and demand zones of the higher timeframe for you.
This analysis is based on a combination of different styles, including the volume style with the ict style.
Based on your strategy and style, get the necessary confirmations for this analysis to enter the trade.
Don't forget about risk and capital management.
The responsibility for the transaction is yours and I have no responsibility for your failure to comply with your risk and capital management.
💬 Note: This is just a possibility And this analysis, like many other analyses, may be violated. Given the specific circumstances of Bitcoin, it is not possible to say with certainty that this will happen, and this is just a view based on the ICT style and strategy with other analytical styles, including the liquidity style. (( The fall of Bitcoin may not change the trend of altcoins and money will move out of Bitcoin and into altcoins, and we will see altcoins grow. ))
Be successful and profitable.

American Eagle looks like Litecoin did before its pump in 2017.Buying American Eagle looks really smart here. We could see a Litecoin-esque pump similar to 2017. This would, of course, lead to a large bear market, but in the meantime, the stock is looking very bullish and ready for a parabolic run. Loving this setup.
As always, stay profitable.
- Dalin Anderson

Avalanche (avax)Avax usdt Daily analysis
Time frame daily
As you see on the chart , if decrease of avax stops on 17.5 $ the pattern (double bottom)will create.
So we will see the end of decreasing and avax will reach to 25$
On the other hand , if price breaks down and reach 15 EURONEXT:OR less , this pattern will failed

Ravencoin ( RVN)RVN usdt Daily analysis
Time frame 4hours
Risk rewards ratio >1.5
Target = 0.01133
Short position for short time

Bull Trap Confirmed: GBPUSD's 8% Rally Faces ExhaustionLets Face it we had a great 6 months already clocking 60%+ Returns already.
And after sitting ducks for almost 2 months now we finally have a trade.
- Its a very self explanatory chart
- Trading at resistance
- Head & Shoulder pattern
And the best part the right shoulder is still yet to be formed! My favourite type of entry.
1.It gives a better risk reward ratio (1:7 expected)
2.Better Entry (No long red candles)
3. And even if the pattern fails it we may still reach the neck line which is target 1.
Entry Criteria
- A Red candle at the entry Line Marked
- Stoploss Above the Entry Candle
Target 1- 1.3361
Target 2- 1.3252
Target 3- 1.3169
Keep Your Risk Reward Intact! Not An investment Advice

Gold Dumped | HaHa!We anticipated gold to dump heavily, during either London or New York Session. Yes, it dumped during New York Session. Entry was taken on 1 minute after FVA got disrespect/run through.

USDT - Hope AheadMorning my friends,
Figured I'd share a little bit of this USDT chart.
Deff showing a downtrend, even though our beloved coins are still suffering. Thats mainly because of BTC.D.
Once USDT moves lower, signaling a breakdown we should get a big relief, that if maybe paired with BTC.D moving lower as it is also near very strong resistance a bull market for alts will begin.
Keep an eye on this descending triangle breakdown.
Trade thirsty, my friends!

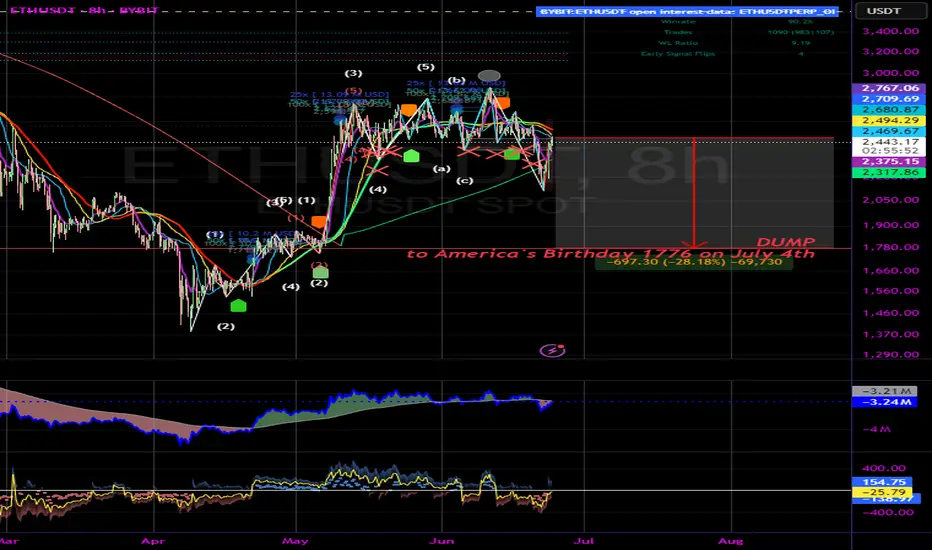
ETH Dumping to 1776 in honor of America's birthdayBART express incoming. Nice liquidity grab down there as well.
Not financial advice.
Happy July 4th!
Dogecoin is dead, short it to zeroDead coin already RIP
Doge coin can't go any higher and had lost fame and momentum

$BTC/USDT MAJOR PUMP? or MAJOR DUMP?BTC, the worlds biggest and fastest growing coin. With a market cap in the Trillions, we are facing a major moment.
Will price dump? or will it pump and go above and beyond.
Lets find out in this analysis!
1. Trend Overview
HTF Bullish:
Price remains above the long-term bullish trendline, showing strong macro support.
Recent price action is consolidating within a major supply zone and liquidity cluster — signaling indecision before a breakout or breakdown.
📈 2. OBV (On-Balance Volume) Analysis
OBV is coiling in a symmetrical triangle, indicating a volume squeeze.
This tightening range typically precedes a major breakout or breakdown, matching the price consolidation near resistance.
🔄 Market Structure
Price has formed a potential top just under the supply/liquidity zone (~$110,000–$112,000).
Swing High is defined just below $112K.
Key structure zones are:
Resistance zone at current levels.
Support zones:
1D FVG ($97K) and Weekly FVG ($87K–$93K)
🟪 Supply & Demand Zones
Supply Zone: $100k - $112k — multiple rejections here indicate this is a key short-term ceiling.
Demand Zone: Deep support between $50-$57K, aligns with trendline and historical value area.
🔵 Fair Value Gaps (FVGs)
1D FVG: $97K area — may act as magnet if price breaks below resistance.
1W FVG: $87K–$93K — stronger structural level to watch.
If both are filled, price may meet the bullish trendline around $90K.
🧠 Liquidity Zones
Above current price: ~$112K is marked as a liquidity grab area — stop hunts may occur before major reversal.
Below: FVG zones could trigger a liquidity sweep downwards before reversal.
🔴 Volume Profile
Strong high-volume node (HVN) around $80K–$97K: acceptance zone, likely to act as magnetic support.
Above $110K is a low-volume node (LVN): if broken cleanly, price may accelerate quickly toward $120K+.
✅ Bullish Scenario
Break above $112K → sweep liquidity → continuation toward $120K–$125K. (Price Discovery)
OBV breakout upwards would confirm.
Hold above FVG 1D if retested = healthy bullish continuation structure.
❌ Bearish Scenario
Rejection at supply → drop to FVG 1D ($97K), then potentially Weekly FVG (~$93K).
If OBV breaks downward, it confirms bearish volume divergence.
Breakdown below trendline could target deeper into demand zone (~$70K+).
📌 Summary
Bias: Neutral-bullish short term, bullish macro (above trendline).
Key Breakout Level: $112K.
Critical Support: $91K–$97K (FVG cluster).
Confirmation: OBV breakout + clean structure break.
Invalidation: Weekly close below long-term trendline and FVG zones.

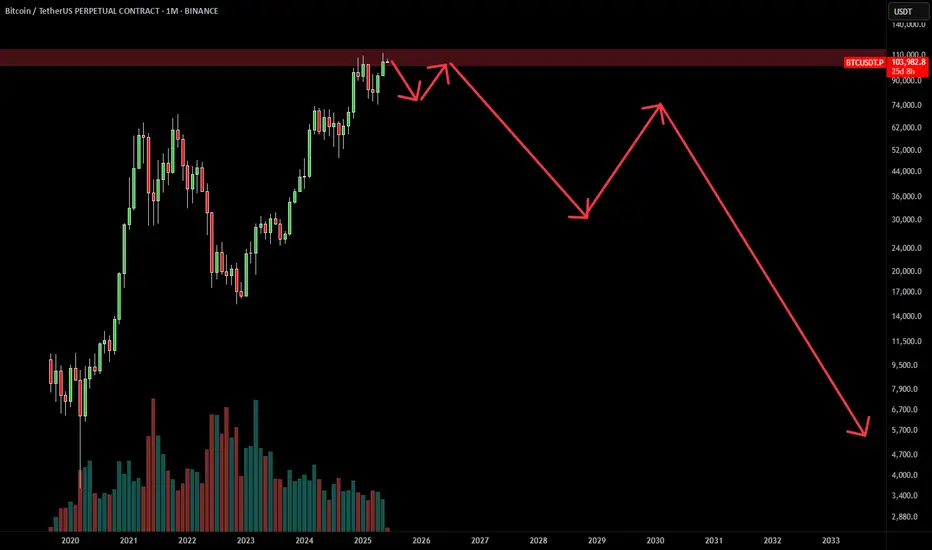
The Collapse of the Bitcoin ExperimentFew are prepared for this scenario, yet it's the most probable one: Bitcoin is heading for a major crash in the coming years.
What was once a revolutionary idea has become a centralized shitcoin, failing nearly every purpose envisioned by its creator. Aside from gamblers and speculators, hardly anyone truly believes in Bitcoin anymore.
The experiment has failed — it's time to accept its fate.
This will be the biggest short trade in the history.
05 June, 2025
Doomsie
Pump and Dump🚨 Market Update – AGT Traders Beware 🚨
On May 21, Binance saw $141.14K in short liquidations vs. $90.47K in longs.
Today, just on Gate.io, there were a whopping $609.92K in long liquidations.
Overall volume remains low compared to previous days - signaling weak momentum and increased risk.
📅 On June 1, 82.35M AGT tokens (~$2.57M) will be unlocked.
⚠️ Expect high volatility - potential pump and dump scenarios.
Stay cautious out there.

#AAVE #AAVEUSD #AAVEUSDT #Analysis #Eddy#AAVE #AAVEUSD #AAVEUSDT #Analysis #Eddy
As can be seen in the chart, the price has moved towards the supply area with a compression and has formed the 3-drive and can fall from the indicated supply area towards the daily demand zone.
I have identified the important supply and demand zones of the daily timeframe for you.
This analysis is based on a combination of different styles, including the volume style with the ict style.
Based on your strategy and style, get the necessary confirmations for this analysis to enter the trade.
Don't forget about risk and capital management.
The responsibility for the transaction is yours and I have no responsibility for your failure to comply with your risk and capital management.
💬 Note: Stop losses behind the supply and demand zones are usually hunted by market makers. Be careful of stop hunts and do not enter a trade without getting confirmation and without having a proper trading setup.
Be successful and profitable.

#CRYPTO #BTC #ETH #WARNING #DUMP #COMING #WYCKOFF #SHORT#CRYPTO #BTC #ETH #WARNING #DUMP #COMING #WYCKOFF #SHORT
50% DUMP is coming for #Bitcoin & #Ethereum
This analysis is based on the analytical style of the Wyckoff Distribution Structure of Schematic #1.
I have outlined for you the important parts of the Wyckoff style on the one-hour timeframe on Bitcoin & Ethereum.
Currently, we are in Phase C of the Wyckoff Distribution Structure on Bitcoin & Ethereum.
We have to wait for the completion of this phase and the start of Phase D of the Wyckoff Distribution Structure.
See my analysis on Bitcoin & Ethereum now and read the full description section.
My Wyckoff Analysis of Bitcoin:
My Wyckoff Analysis of Ethereum:
The responsibility for the trade is yours and I have no responsibility for your failure to comply with the risk and capital management.
Good luck and be profitable.

#ETH #ETHUSD #ETHUSDT #ETHEREUM #Wyckoff #Analysis #Eddy#ETH #ETHUSD #ETHUSDT #ETHEREUM #Wyckoff #Analysis #Eddy
This analysis is based on the analytical style of the Wyckoff Distribution Structure of Schematic #1.
I have outlined for you the important parts of the Wyckoff style on the one-hour timeframe.
Currently, we are in Phase C of the Wyckoff Distribution Structure.
We have to wait for the completion of this phase and the start of Phase D of the Wyckoff Distribution Structure.
When will this structure be fully confirmed? When the Ethereum price falls to the 1750 support and gathers the final spring when this support is broken for the fall, we will enter a short position by getting the necessary confirmations based on our style and strategy.
💬 Note: The best entry point for short positions will be the 1720_1750 support break. if the Ethereum price UTAD and test formed, high-risk traders who are willing to trade in the opposite direction can enter a short position by getting confirmation in the time frames below 15 minutes.
Where will the targets be? The first target is 1500 and the second target can be 1000 dollars. Maybe next targets is : 800_500 dollars.
When can you safely close the position and enter a reverse trade, that is, long or buy? When a Wyckoff accumulation structure is formed at one of the targets.
The responsibility for the trade is yours and I have no responsibility for your failure to comply with the risk and capital management.
Good luck and be profitable.
I also invite you to review and view my latest analysis on Bitcoin & TOTAL3 on my page.

#BTC #BTCUSD #BTCUSDT #BITCOIN #Wyckoff #Analysis #Eddy#BTC #BTCUSD #BTCUSDT #BITCOIN #Wyckoff #Analysis #Eddy
This analysis is based on the analytical style of the Wyckoff Distribution Structure of Schematics 1 and 2.
I have outlined for you the important parts of the Wyckoff style on the one-hour timeframe.
Currently, we are in Phase C of the Wyckoff Distribution Structure.
We have to wait for the completion of this phase and the start of Phase D of the Wyckoff Distribution Structure.
When will this structure be fully confirmed? When the Bitcoin price falls to the 91800 support and gathers the final spring when this support is broken for the fall, we will enter a short position by getting the necessary confirmations based on our style and strategy.
💬 Note: It is not exactly clear whether the market maker will act based on Schematic 1 or 2, so the best entry point for short positions will be the 91800 support break. If, based on the schematic 1, the Bitcoin price UTAD and test formed, high-risk traders who are willing to trade in the opposite direction can enter a short position by getting confirmation in the time frames below 15 minutes.
Where will the targets be? The first target is 62000 and the second target can be 46000 dollars.
When can you safely close the position and enter a reverse trade, that is, long or buy? When a Wyckoff accumulation structure is formed at one of the targets.
The responsibility for the trade is yours and I have no responsibility for your failure to comply with the risk and capital management.
Good luck and be profitable.
I also invite you to review and view my latest analysis on Bitcoin via the link below:
For altcoins, follow my analysis on the Total 3 chart.
My analysis of the Total 3 chart:

AT&T I Tipping Point : Short Opportunity with Head & ShouldersHey traders after a previous trade trade on the hood hitting targets of 16.4%. Today I bring you NYSE:T
Technical + Fundamental View
Pro Tip
- Breakdown below the Entry Line will be considered at Trade Initiation. (Risky Traders)
R:R= 5.4
- Rest can follow entry at day close post breakdown SL above Entry Candle.
- The Breakdown Below the Entry Line will confirm the head and shoulder pattern
Entry Line - 26.93
Stoploss - 27.53
Target 1 - 25.59 (Neckline of head and shoulder)
Target 2 - 24.74
Target 3 - 23.68
Technical View
- Head And Shoulder on Daily Time frame
- On the hourly timeframe, the chart looks weak, showing a potential double top pattern where the second peak is lower than the first, indicating growing investor fear.
Fundamental View
- High Debt: Over $140 billion in debt limits investment capacity and consumes significant cash flow.
- Network Issues: Poor service quality and outages risk losing customers to competitors.
- Strong Competition : T-Mobile and Verizon offer better plans, making customer retention harder.
- Market Saturation: The U.S. wireless market is nearly saturated, limiting new customer growth.
- Execution Risks: Growth and debt reduction depend on flawless asset sales and network upgrades; delays could harm finances and stock performance.
Additional Considerations
- AT&T’s valuation is higher than some peers, potentially capping upside.
- Telecom market competitiveness means growth hinges on successful 5G and fiber rollouts.
- Dividend yield (~3.9%) is attractive but lower than some rivals, which may impact income investors.

I'm Bullish, but... CHR / USDTEvening fellas,
My latest posts are bullish, and I did long some coins during the blood we had a couple of days ago.
But one must always be ready and I am seeing something interesting in a couple of coins, showing me that there's a hidden bearish scenario behind all the hype.
CHR is one of those coins, it's got good news, hype, etc, but I think MM'rs want to destroy some lives.
Keep an eye on it.
Trade thirsty, my friends!

People Used To Get Scared - BTC / USDMorning folks,
Read the chart, it contains all information.
I figured since I didn't update my inverted Adam & Even pattern chart much I'd just create a new one, but check it out, its playing marvelously.
Trade thirsty!
